a Fuzzy Logic Method: A Case Study from
Melbourne
By
Samira Rashetnia
Thesis submitted in fulfilment of the requirements for the degree of
Master of Engineering
College of Engineering and Science
Victoria University, Melbourne, Australia
II Flood is known as the most common natural destructive phenomenon, which can cause
severe physical, social and economic damages and losses in both rural and urban regions.
Flood vulnerability assessment is essential to identify high risk areas and develop
cost-effective flood mitigation and/or adaptation strategies, particularly for urban areas. In the
recent past, vulnerability of floods has been assessed using vulnerability indicators
consisting of components from various elements of flood damages, especially
hydrological, social and economic components. This study presents a model based on a
fuzzy rule-based system to assess the flood vulnerability of suburbs under the jurisdiction
of Moreland City (MC) area in Melbourne, Australia to identify the most and the least
vulnerable suburbs. The area is densely populated and consists of major waterways and
creeks that increase the flood vulnerability and thus endangering the safety of people and
property. Findings of the study showed that 51.6 % of the area in MC (26.21 km2 in total)
falls under very low and low flood vulnerability zones. The suburbs that fall under these 2
classes include Brunswick, Pascoe Vale and Coburg. These are the areas which have the
least population density and/or have higher range of social and economic resilience (based
on susceptibility indicators such as presence of broadband connection, number of low
income and high income households, unemployed and low educated households). The very
highly populated areas are classified into high and very high vulnerability classes, which
have 4.6% and 0.3% of the total area, respectively. The suburbs that fall under these 2
vulnerable classes include Brunswick West, Gowanbrae, and Pascoe Vale South. For these
parts of the study area that are vulnerable to floods, this study recommends to the relevant
authorities that some range of steps need to be taken to increase the social and economic
resilience in order to enhance the system’s ability to cope with and recover from the
III
“I, Samira Rashetnia, declare that the Master by Research thesis entitled “Flood
Vulnerability Assessment by Applying a Fuzzy Logic Method: A Case Study from
Melbourne” is no more than 60,000 words in length including quotes and exclusive
of tables, figures, appendices, bibliography, references and footnotes. This thesis
contains no material that has been submitted previously, in whole or in part, for the
award of any other academic degree or diploma. Except where otherwise indicated,
this thesis is my own work”.
IV
This thesis is especially dedicated to my supervisors and my family.
Firstly, I would like to express my sincere gratitude to my supervisors Dr. Nitin
Muttil and Dr. Abdullah Yilmaz from Victoria University, for their continuous
support, comments and advices. They were abundantly helpful and offered
invaluable assistance all the time that I needed their opinions and help.
Secondly, I would like to acknowledge my wonderful husband Heerbod Jahanbani
and my gratitude to him, who gave me accompany and a lot happiness and support
through this period.
Third, thanks to my little son Heerad who was a good motivation for me with his
cute smile and also, special thanks to my lovely family in Iran, particularly my
parents who always encouraged me to find my potential. All the support they have
provided me over the years was the greatest gift anyone has ever given me.
V
The following list of abbreviations are used in all through this thesis.
AMR
Annual Maximum Rainfall
AHP
Analytic Hierarchical Process
BOM
Bureau of Meteorology
BITRE
Bureau of Infrastructure, Transport and Regional Economics
DFW
Drainage system quality and number of flood protection
structure Weight
EFVI
Economic Flood Vulnerability Index
FL
Fuzzy Logic
FIS
Fuzzy Inference System
FAR
Flooded Area Ratio
FVI
Flood Vulnerability Index
FFVHI
Final Flood Vulnerability Index
HFVI
Hydrological Flood Vulnerability Index
HiH
High income Households
HLD
Historical Loss Data
HCtR
Households Close to River
IPCC
Intergovernmental Panel on Climate Change
VI
MW
Melbourne Water
MDSD
Main Drainage System Density
MFs
Membership Functions
MDs
Membership Degrees
NBUiFA
Number of Business Units in Flooded Area
NHiFA
Number of Households in Flooded Area
NPFiFA
Number of Public Facilities in Flooded Area
NPFCtR
Number of Public Facilities Close to River
NMwHR
Number of Months with Heavy Rainfall
PD
Population Density
P0-4
People aged between 0-4
P65
People aged above 65
Pdis
People need assistance due to disability
PFA
people in Flooded Area
Pli
People with Low Income
Ple
People with Low Education
PBC
People with Broadband Connection
Pcfps
People Close to Flood Protection Structure
VII
PRA
Participatory Rapid Analysis
S
Slope
SFVI
Social Flood Vulnerability Index
SDSD
Sub-main Drainage System Density
UH
Unemployed Households
VIII
Table of Contents
Abstract ... II
Declaration ...III
Acknowledgment ... IV
Abbreviations ... V
Table of contents ... VIII
List of figures ... XI
List of tables ... XII
Chapter 1: Introduction
1.1. Introduction ... 2
1.2. What is flood? ... 3
1.3. Types of floods ... 3
1.4. Flood risk management and mitigation ... 5
1.5. Motivation and objectives of the study ... 6
1.6. Overall methodology ... 8
1.7. Outline of the thesis ... 9
Chapter 2: Literature Review
2.1. Introduction ...11
2.2. Conceptualizing vulnerability ...11
2.3. Flood risk expressions ...12
2.4. Perception of Flood Vulnerability ...13
2.5. Vulnerability indicators ...15
2.6. Flood vulnerability factors ...15
2.6.1. Exposure ...16
2.6.2. Susceptibility ...16
2.6.3. Resilience ...17
IX
2.9. Summary ...19
Chapter 3: Flood Vulnerability Index Method
3.1. Introduction ...21
3.2. General structure of a FVI ...21
3.3. Components of a FVI ...22
3.4. Steps in Developing a FVI ...24
3.4.1. Selection of indicators ...25
3.4.2. Standardization ...26
3.4.3. Weighting ...27
3.4.4. Aggregation and final index calculation ...28
3.4.5. Interpretation ...29
3.5. Summary ...30
Chapter 4: Fuzzy Logic Method
4.1. Introduction ...33
4.2. What is Fuzzy Logic? ...33
4.3. Basic concepts of Fuzzy Logic ...34
4.3.1. Fuzzy sets (FS) ...34
4.3.2. Membership functions ...35
4.3.3. Fuzzy logical rules ...36
4.3.4. Fuzzification ...36
4.3.5. “IF…THEN…” Rules ...37
4.4. Fuzzy inference system ...38
4.4.1. Mamadani FIS ...40
4.4.2. Sugeno FIS ...41
4.4.3. Defuzzification ...42
4.5. Summary ...42
X
5.3. Research Methodology ...45
5.3.1. Data collection and selection of indicators ...45
5.3.2. Indicator standardization and weighting ...48
5.3.3. Calculation of FVIs applying (FIS) system ...48
5.3.3.1. Output of Final FISs ...51
5.3.4. Aggregation of FVIs ...53
5.3.5. Interpretation of the FFVIs ...53
5.4. Results ...54
5.4.1. Results for HFVIs ...54
5.4.2. Results for SFVIs ...57
5.4.3. Results for EFVIs ...59
5.4.4. Results for final FVI ...62
5.5. Summary ...63
Chapter 6: Summary and Conclusions
6.1. Summary ...65
6.2. Conclusions ...66
6.2.1. FL approach for vulnerability assessment ...67
6.2.2. Hydrological Component ...68
6.2.3. Social Component ...68
6.2.4. Economic Component ...68
6.2.5. Final FVI ...69
6.3. Limitations of this study ...70
6.4. Recommendations for future study ...70
XI
Figure 1.1. Flow chart of the study methodology………..8
Figure 3.1. General Structure of a FVI ………22
Figure 3.2. Steps used in the development of a FVI and common methods used in
each step………..…24
Figure 4.1. Triangular and trapezoidal MDs (Sen 2010)……….35
Figure 4.2. Structure of a user-interactive fuzzy expert system (Sen 2010)……...38
Figure 4.3. General steps in a fuzzy inference system application (Sen 2010)...…39
Figure 4.4. Mamadani FIS System (Yazdi and Neyshabouri 2012)………41
Figure 5.1. Location and suburbs of MC……….45
Figure 5.2. Membership shapes and fuzzy sets………...49
Figure 5.3. Schematic diagram of the FISs development for social component….51
Figure 5.4. Economic Vulnerability Index (EVI) output classes………52
Figure 5.5. Hydrological Flood Vulnerability Index (HFVI) output classes……..52
Figure 5.6. HFVI in MC Area……….55
Figure 5.7. HFVI - Most and the least vulnerable suburbs……….56
Figure 5.8. SFVI in MC Area………..58
Figure 5.9. SFVI - Most and the least vulnerable suburbs………..59
Figure 5.10. EFVI in MC Area………60
Figure 5.11. EFVI - Most and the least vulnerable suburbs………61
Figure 5.12. FFVIs in MC Area………..62
XII
Table 3.1. Common interpretation criteria ranges for the final FVI ...29
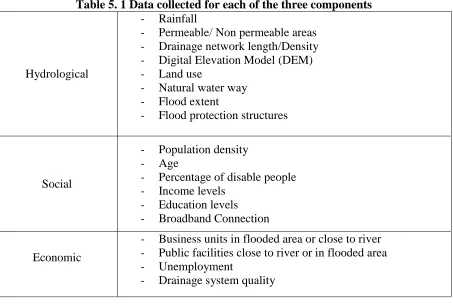
Table 5.1. Data collected for each of the three components ...46
Table 5.2. List of selected indicators ...47
Table 5.3. The FIS groups for social, economic and hydrological components ...50
Chapter 1
2
1.1.
Introduction
Floods are known as the most common and destructive natural phenomenon (Yoon et al 2014). They can cause severe physical, social and economic damages and losses in both rural and urban areas (Masood & Takeuchi 2011; Balica et al. 2012; Balica et al. 2013; Zhang & You 2013; Albano et al. 2014). Several studies (IPCC 2007; Yilmaz 2014) reported an increase in frequency and magnitude of extreme rainfalls, which have aggravated the flood related concerns.
Global warming is one of the main reasons for the increase in frequency and magnitude of extreme rainfalls (therefore floods), since the warmer atmosphere with enhanced humidity leads to a more active hydrological cycle (Mailhot et al. 2007). Katz and Brown (1992) stated that even a small change in the mean rainfall due to global warming can cause significant changes in extreme rainfalls. Also, urbanization is another driver which increases intensity and frequency of floods. Alaghmand et al. (2010) showed that there is a direct relationship between urbanization and hydrological characteristics such as infiltration, runoff frequency and flood depth in an urban area. They stated that increased urbanization increases floods, both in frequency and magnitude. The effects of urbanization and global warming on floods will increase in future (due to more urbanization to accommodate increased population in cities and rises in greenhouse gas emissions) (IPCC 2013).
3
The remaining sections in this chapter present a brief background to definition of flood, type of floods, frequency of floods, flood risk management and mitigation strategies. This chapter also presents the motivation and objectives of this study as well as the outline of this thesis.
1.2.
What is flood?
Flood and flooding are defined as below:
A flood is defined as “a temporary condition of surface water (river, lake, sea), in which the water level and/or discharge exceeds a certain value, thereby escaping from its normal confines” (Douben 2006a; Schultz 2006).
Flooding is defined as “the spilling over or failing of the normal limits for example lake, sea or accumulation of water as a result of heavy precipitation through lack of beyond of the discharge capacity of drains, or snow melt, dams or dikes break affecting areas” (Douben & Ratnayake 2005), which are normally not submerged (Ward 1978).
1.3.
Types of floods
There are in general four types of floods: coastal, river, flash and urban floods (MunichRe 2007). For this thesis, only three types of floods (namely river, flash and urban floods) were of concern and hence are explained in the following sub-sections.
1.3.1.
River floods
4
but develop gradually. Spreading of diseases and drinking water shortage can be counted as indirect threats of river related flooding (Douben 2006b).
1.3.2.
Flash floods
These types of floods are temporary inundations of different sources such as river basins, sub catchments or some parts of a city. They usually occur in combination with thunderstorm over a small area or even intense rains in short times can cause them. In fact, when the rainfall intensity exceeds the infiltration rate, water runs off the surface. However, the ground is not soaked usually. Flash floods can take place anywhere and are good signs to predict a major river flood. The engineering structures such as dams, dikes and levees are usually constructed to protect areas against these floods. They happen without warning and cause maximum damage as huge amounts of fast-moving water is involved.
1.3.3.
Urban floods
Urban flooding, which normally depends on the soil type, topographical conditions and the quality of the drainage system, is usually caused by extreme local rainfall sometimes combined with blocked drainage systems (Douben 2006b).
5
1.4.
Flood risk management and mitigation
Flood risk is defined “as a function of flood probabilities and flood impacts” (Balica et al. 2012). Flood risk management can be defined as all those activities which can help a system to be sustainable and improve its capabilities to cope with flood events and disasters. In fact, it includes different methods to reduce the floods and mitigating flood’s harmful consequences.
Number of floods and their effects can be reduced by flood risk management and flood mitigation measures and strategies. In other words, flood management includes an extensive range of measures that help to decrease the destructive effects of floods on people, environment and the economy of any region.
Followings are some objectives of conducting flood risk management studies:
- Reducing the exposure of people, properties and environment to flood risks;
- Reducing the present level of flood damages; and
- Increasing the resilience of systems and people.
In general, methods for flood mitigation can be grouped into structural and non-structural approaches. The structural methods involve modifying the flood pattern; whereas, non-structural ones help to reduce the floods’ impacts (Douben 2006b; Andjelkovic 2001).
The structural methods consist of infrastructure development such as dams or levees, which reduce the flood risk to people and property. Non-structural methods on the other hand consist of various mitigation measures such as planning, programming, raising awareness, preparedness, and flood forecasting and warning systems.
6
1.5.
Motivation and objectives of the study
Moreland City (MC) is located in the inner and mid-northern parts of Melbourne. The area is mainly bordered by Moonee Pond Creek to the west and Merri Creek to the east and experiences river floods as well as urban floods. Moreover, as MC is a densely populated urban area, the major floods from the creeks and insufficient drainage network increases the risk of floods. Thus, assessing the flood vulnerability is vital for the area under the jurisdiction of Moreland City Council (MCC), which can be part of the council’s flood risk management plans.
The overall objective of this study to develop a FVI for MC, which would be easily understood and used by the water authorities as well as the general public. This would create an easily understandable link between the theoretical concepts of flood vulnerability and the day-to-day decision making process. This study also aims to identify regions that are highly vulnerable to floods and those that are least vulnerable. In other words, the goal is to convert knowledge into actions by assessing the vulnerability to floods of the different suburbs of MC. Identifying the hotspots highly vulnerable to floods and raise the public awareness about such areas could save lives of people and could also reduce the economic losses due to floods.
There is an advantage of using the FVI method in that it considers not only the hydrological and economic aspects of flood damages, but also the social aspect of damage caused by floods. However, hydrologic events include many uncertainties due to their nature such as climate, limited data and imprecise modelling (Sen 2010; Bogardi et al. 2003). Moreover, there is not a clear boundary for the different vulnerability components and indicators (Yazdi & Neyshabouri 2012). Therefore, it is useful to adopt a methodology to develop and assess the vulnerability which can deal with uncertainties in development of a FVI. Thus, in order to integrate a probabilistic approach to FVI development, this study used a Fuzzy Logic (FL) based FVI which would consider the uncertainties involved in hydrology.
7
selected 6 indicators to map the flood vulnerability based on the availability of data and considering the fact that a system can be vulnerable to a hazardous event because of physical exposure, susceptibility and socio-economic aspects. On the other side, Balica et al. (2009), explained that the exposure, susceptibility and resilience are three main factors, which should be considered while evaluating flood vulnerability of any system (region). Exposure can be estimated from the value of goods, infrastructure, cultural heritage and people present in the flooded area. Susceptibility is mostly related to social aspects of flood damage specially awareness and preparedness of people, and resilience is the system capacity to cope with changes by modifying itself when it’s exposed to flood.
In this study, a methodology was developed to use a FL based FVI to the case study area of MC. Flood vulnerable areas were identified and mapped in GIS environment, which in turn would help policy makers and other concerned authorities to develop sustainable flood management and mitigation policies.
In summary, the objectives of this study are as follows:
1- To develop a FL based FVI using data representing hydrological, social and economic
components of flood vulnerability. The study used 24 indicators grouped under the above mentioned three components.
2- To apply the developed fuzzy based FVI in the areas under the jurisdiction of (MC)
area in Melbourne. Such an application will identify the areas (or suburbs) that are highly vulnerable to floods.
8
1.6.
Overall methodology
The methodology and all its details which have been applied to develop a FVI in this study is explained in chapter 5, section 5.3. However, the overall view of the research methodology has been shown in Figure 1.1.
Selection of indicators
Standardization
Weighting of indicators
Aggregation and final index
calculation by applying FL method
Interpretation ( GIS mapping)
9
1.7.
Outline of the thesis
The outline of this thesis is as follows:
1. This chapter presented the context of the present study and provided some basic
definitions of terms and concepts used in this study. The motivation and objectives of this study were also presented in this chapter.
2. Chapter 2 presents a detailed literature review on flood vulnerability, including the
definitions of vulnerability, vulnerability indicators and factors, as well as the fuzzy logic based approach used in hydrology.
3. Chapter 3 presents the FVI method and includes the common components used in
this method. This chapter also presents in detail the five steps that need to be undertaken to develop and apply a FVI.
4. Chapter 4 explains the Fuzzy Logic (FL) approach and the steps involved in its
application.
5. Chapter 5 presents the application of the FL based FVI method to the study area.
The research methodology used in this study is presented in detail in this chapter. The result from the application of the developed methodology to the case study areas is also presented in this chapter.
6. Chapter 6 presents the conclusions drawn from this study. This chapter also
Chapter 2
11
2.1. Introduction
As presented in Chapter 1, this study aims to demonstrate the applicability of the developed FL based FVI methodology as a useful tool to identify flood prone areas and quantify flood vulnerability (FV). This chapter explores the concept of vulnerability, expressions used in past studies to estimate flood risk, perception of FV, FV factors and finally, the FL approach in hydrology.
2.2. Conceptualizing vulnerability
Over the last two decades the concept of vulnerability has changed frequently since it’s been used in different disaster studies and consequently there have been several attempts to define the term of vulnerability. Some specific definitions of vulnerability refer to climate change (IPCC 1992, 1996 and 2001), some others to environmental hazards (Blaikie et al. 1994; Klein & Nichols 1999), and also some refer to floods (McCarthy et al. 2001; Veen & Logtmeijer 2005; Connor & Hiroki 2005). Based on the literature, the various definitions of vulnerability are explained as follows:
12
Kasperson et al. (2005), Adger (2006), and IPCC (2007) combined the above concept of vulnerability into a vulnerability function related to exposure, sensitivity and resilience. The International Panel of Climate Change (IPCC) defined vulnerability as the incapability degree to cope with the climate change consequences and later, IPCC (1996) defined it “as the extent to which climate change may damage or harm a system; it depends not only on a system’s sensitivity but also on its ability to adapt to new climatic conditions” (Watson et al. 1996). The latest IPCC report defined vulnerability as “The propensity or predisposition to be adversely affected”. It is also stated in this report that “Vulnerability encompasses a variety of concepts and elements
including sensitivity or susceptibility to harm and lack of capacity to cope and adapt” (IPCC 2014).
2.3. Flood risk expressions
The procedure for managing a flood risk event is termed as the flood risk management (Plate 2002). The term of risk is defined as “the probability that a hazard will turn into a disaster” (Balica et al. 2009). Vulnerability and hazard do not define risk separately, but they are combined to estimate the risk as presented in Equation (2.1).
Risk = Hazard × Vulnerability (2.1)
Where, risk is the consequence, and the hazard and vulnerability are premise and base respectively.
Also, risk can be explained as “the probability of occurrence of an event multiplied by the event consequences” (Bouma et al. 2005).
Risk = Probability X Effect (2.2)
Barredo et al. (2007) used below function to evaluate the flood risk:
Flood risk = f(Hazard, Exposure, Vulnerability) (2.3)
In the IPCC (2007), risk is a product of the likelihood of a hazardous condition and the consequences of that.
13
economic, social and cultural assets, services (including environmental services) and infrastructure”.
2.4. Perception of Flood Vulnerability
The floods have gained importance in recent years since a large number of people, ecosystems, and economic activities are negatively impacted (Balica et al. 2012). Developing countries faced by widespread poverty, high population density, and high rates of unemployment, and illiteracy make them more vulnerable. In general, every society is vulnerable to floods, based on their different conditions and cases which make them unique. To improve the quality of life of the people as well as improving policies, understanding the privileges amongst societies are very helpful.
United Nations (1982) defined the flood vulnerability “as a degree of loss to a given element at risk from a flood of given magnitude “expressed on a scale from 0 to 1. This is the definition which is applied in this study.
The concept of vulnerability was expanded by Veen and Logtmeijer (2005) to explain flood vulnerability from an economic perspective. “A system is susceptible to floods due to exposure, a perturbation, in conjunction with its ability to cope or basically adapt” (Balica et al. 2009). In order to assess flood vulnerability, flood vulnerability should be quantified first. In general, the following three primary approaches were used in the past to quantify flood vulnerability:
(i) Historical Loss Data (HLD) approach (Dilley et al. 2005)
(ii) Vulnerability Curve (VC) approach (Büchele et al. 2006)
(iii) FVI approach
14
The VC method is based on depth-damage relationship which assigns a damage percentage (for residential buildings) against various water depths during the flood event (Albano et al. 2014). The curve method is more accurate with respect to the HLD approach, since it is based on the real damage survey and loss data are often unevenly recorded (Dilley et al. 2005). However, the vulnerability curve method is very site specific; therefore generated curve for an area cannot be applicable for other regions.
Among these three quantifying methods (i.e. HLD approach, VC method and FVI), the FVI is the most widely adopted approach and is also a tool to identify the risks of flood disaster and increase the safety of infrastructure and humans (Albano et. al. 2014). In other words, the FVI is a tool that can assist urban planners and policy makers in prioritizing flood mitigation strategies and in increasing public awareness by providing information such as hotspots for the flood risk, communities vulnerable to floods and so on (Balica et al. 2009). The most important advantage of the FVI method is that it considers not only the hydrological and economic aspects of flood damage, but also the social aspect of damage caused by floods. This method is more complex than the other two approaches defined above, and it has the potential to assess flood vulnerability in a far better way than the other methods. Due to these advantages, the FVI method is the most widely adopted approach in many recent studies (Kumar et al. 2010; Solin 2012; Kumar & Kunte 2012; Balica et al. 2012, Zhang & You 2013; Kunte et al. 2014; Balica et al. 2013).
Based on the above explanation, it can be concluded that the FVI can quantify the vulnerability in the most accurate form. However, there is not a clear boundary for the different vulnerability components and indicators (Yazdi & Neyshabouri 2012). Therefore, it is useful to adopt a methodology which can deal with uncertainties in the development of a FVI.
15
2.5. Vulnerability indicators
Since a direct measurement of vulnerability is not possible, an indicator or a set of indicators should be used to quantify the condition of a system as an inherent characteristic (Balica et al. 2012). Gomez (2001) noted that indicators should focus on quantifiable and understandable small aspects of a system and give people a sense of a bigger picture. In fact, indicators are input data can be used in indicator based method to decide flood vulnerability of a region. Considering specific indicators can help to assess the systems vulnerability, which can lead to identifying actions needed to decrease the vulnerability (Balica et al. 2012).
In the indicator-based vulnerability assessment, the first step is selecting proper minimum number of indicators (Sullivan 2002). Routine practice for indicator selection is following a conceptual framework to prepare a list of them considering suitability, usefulness and recollection process (Balica et al. 2012). Selected indicators should cover actual conditions and reflect the essentials of flood disaster in any system (Li et al. 2013).
Methods which are used to select indicators of FVIs are broadly grouped into 2: quantitative methods (which are based on expert’s opinions) and qualitative methods (statistical approaches). Among different qualitative methods Principal Component Analysis (PCA) has been commonly used in literature to select indicators (Ka źmierczak & Cavan 2011; Zhang & You 2013). The main quantitative methods to select indicators are Analytic Hierarchical Process (AHP), Delphi technique and Participatory Rapid Analysis (PRA). In addition, Balica et al. (2012) used a deductive approach to identify the best indicators in terms of the vulnerability conceptual frame work. As an alternative approach, Barroca et al. (2006) conducted extensive literature review on local projects to identify and finalize best indicators.
2.6. Flood vulnerability factors
16
2.6.1. Exposure
The values such as infrastructure, goods, cultural heritage, and mostly people are exposed to flood as they are present at the location where the floods occurred. In fact, this factor extents to humans and their properties, which are positioned in flood risk areas. Indicators for this factor can be categorized in 2 groups: first group covers the exposure of elements at risk and the second one provides the details of general specifications of the flood. In more detail, the first group covers information about the location, elevation, population density and land use. The other group supplies information about frequency of flood in floodplains or in the urban area such as slope. Messner and Meyer (2006) explained that the indicators of exposure supply certain facts about hazardous effect on the present elements at risk. In this study, exposure factor is defined similar to definition of Balica et al. (2012), which is “predisposition of a system to be disrupted by a flooding event due to its location in the inundated area”.
2.6.2. Susceptibility
17
2.6.3. Resilience
The term of resilience was expressed by Holling (1973) as “a measure of a system’s solidity and its capability to absorb perturbation and change and still maintain the same relationships between populations and state variables”. De Bruijn (2005) expressed the resilience as the system capability to resume from floods. Resilience can also be defined as the system capacity to re-achieve its balance after a reflex into a perturbation (Begon et al. 1996; Jorgensen 1992). Galderisi et al. (2005) argued that the resilience is a society or a system capacity to adapt itself to any change by resisting and modifying itself, to maintain or gain an acceptable level of structure and functioning. Pelling (2003) also explained this factor as any system or community ability to adjust to threats or mitigate the hazardous event damage. In this study, resilience or resistance is defined as the ability of a system to reduce the effect of floods.
2.7. Uncertainty in flood vulnerability
When the probabilities and extent of hazard and/or its related consequence are doubtful, uncertainty occurs due to the ambiguity of knowledge (De Bruijn 2005). The importance of uncertainties in flood risk management depends on the effects on decisions. Green (2004) explained that the decision is uncertain if the choices to be made are in doubt. Originally, uncertainty comes from vagueness in knowledge of the alternatives or their consequences or of the decision criteria.
18
storage potential (wetlands, ponds, reservoir etc.); characteristics of drainage system, etc. (Ahmad & Simonovic 2013).
The use of a FVI can help in modelling various scenarios to reduce the uncertainty. Balica et al. (2012) mention that this function cannot reduce the uncertainty essentially; however it can be a useful tool to assist the decision makers for decisions that increase the mitigation and adaptation to flood risk. It helps them to identify hotspots, where for instance, specific actions can be prioritised and can take place to raise the public awareness.
2.8. Fuzzy logic approach in hydrology
Water resources and hydrology mostly involve a system of principals, methods and concepts to deal with modes of reasoning which are approximate rather than exact. In fact, hydrology involves uncertainties due to factors such as climate, limited data and imprecise modelling capabilities (Bogardi et al. 2003). In order to integrate a probabilistic approach, FL allows researchers to consider the treatment of vagueness in hydrology (Zadeh 1965). Fuzzy rule-based modelling can be considered as an extension of FL. This type of modelling has a high potential in some cases when a causal relationship is well established but is difficult to calculate under real life conditions and scarce data situations (Sen 2001, 2010).
19
Among above studies, Yazdi and Neyshabouri (2012) assessed the flood vulnerability index for an urban watershed in Iran by applying a fuzzy rule-based method. They selected 6 indicators to map the flood vulnerability based on the availability of data and considering the fact that a system can be vulnerable to a hazardous event because of physical exposure, susceptibility and socio-economic aspects. The present study uses 24 indicators from three components (social, socio-economic and hydrological) and therefore provides a more comprehensive and detailed fuzzy based FVI in comparison to Yazdi and Neyshabouri (2012).
2.9. Summary
Chapter 3
21
3.1. Introduction
Human population have always been vulnerable to floods, which are increasing in frequency and
magnitude due to the climate variability. Flood is also known as the most common natural
destructive phenomenon (Yoon et al. 2014) causing severe physical, social and economic losses in rural and urban regions (Masood & Takeuchi, 2011; Balica et al. 2012; Zhang & You 2013; Balica et al. 2013; Albano et al. 2014). Since the number of people who are exposed to the adverse effects of hazardous flood events are increasing, the assessment of flood impacts have gained more importance in recent years. Flood studies and protection policies have been combined with technical and social aspects in flood prone areas (Balica et al. 2013).
In a restricted sense, Flood Risk Management (FRM) is managing procedure of an existing flood risk condition however, in a general sense it’s a planning process which reduces the flood risk in a system (Plate 2002). FRM will bring a new holistic view on flood management and policy and a FVI can play a key role in the area of risk assessment as well as making comparisons across different urban and rural flooded areas.
This chapter presents the structure of a FVI including the commonly used components, the general steps used in the development of a FVI as well as various issues and challenges in its development.
3.2. General structure of a FVI
22
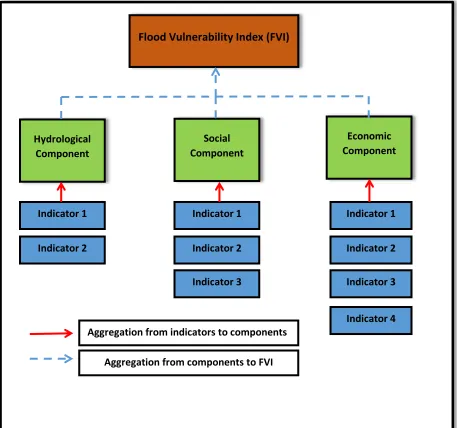
3.3. Components of a FVI
As explained earlier, the general structure of a FVI includes different components (i.e. hydrological (physical), social and economic). As the direct measure of flood vulnerability is not possible, all components (i.e. hydrological, social and economic) use set of indicators. These indicators can be decided by variables, which characterize the flood vulnerability of a region (Solín 2012). McLaughlin and Cooper (2010) explained that using all available data to create an index
Flood Vulnerability Index (FVI)
Hydrological Component
Social Component
Economic Component
Indicator 1 Indicator 2
Indicator 1 Indicator 2 Indicator 3
Indicator 1 Indicator 2 Indicator 3 Indicator 4 Aggregation from indicators to components
Aggregation from components to FVI
23
were popular in the initial FVI development studies. For instance, Dal Cin and Simeoni (1989) stated that using more indicators (variables) can result in more accurate results. However, this is not necessarily true since the indicators, that represent the associated component (i.e. hydrological, social or economic) best, should be selected in FVI development. Moreover, some of the indicators, which are showing high correlation, can be eliminated in index development (Balica et al. 2009).
Hydrological component or physical component comprises geo-morphological and hydro-climatic condition of a region using physical indicators. This component is related to the predisposition of infrastructure to be damaged by floods. Also, explains how the physical condition can influence the vulnerability of a certain region to floods. Some common indicators of this component are daily water stage, annual peak flow, rainfall intensity and distribution, topography, runoff, slope, geological conditions, soil type, drainage network, flood water depth.
Social component explains how lives of population which belongs to a system are affected due to the flood events. In other words, this component considers the indicators directly related to human beings. They can measure variables explaining the context, skills, knowledge, capacity, beliefs, households, organizations and communities in a system. In other words, social indicators are typically used to evaluate current conditions or achievements of social goals in terms of human health, education, housing and social equity issues. Population is the most significant and common indicator of social component of a FVI (Kubal et al. 2009). In population, elderly people and children are more vulnerable to floods, therefore age of the people should also be considered as indicator in social component of a FVI (Meyer et al. 2009).
24
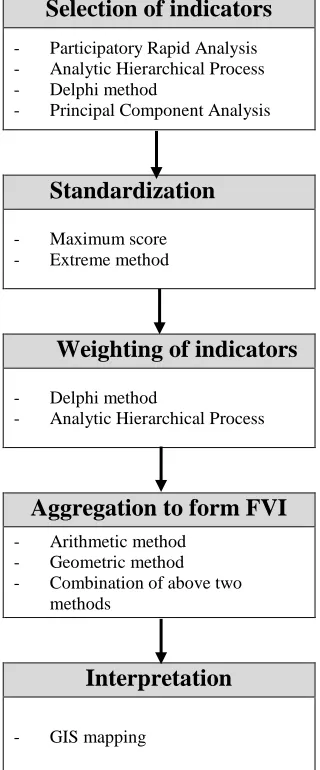
3.4. Steps in Developing a FVI
There are in general five steps undertaken for the development of a FVI, which are as follows:
i) Selection of indicators
ii) Standardization
iii) Weighting of indicators
iv) Aggregation to form FVI
v) Interpretation
Figure 3.2 presents the common methods used in each of the above five steps, which are discussed in detail in the following sub-sections.
Selection of indicators
- Participatory Rapid Analysis - Analytic Hierarchical Process - Delphi method
- Principal Component Analysis
Standardization
- Maximum score - Extreme method
Weighting of indicators
- Delphi method
- Analytic Hierarchical Process
Aggregation to form FVI
- Arithmetic method - Geometric method - Combination of above two
methods
Interpretation
- GIS mapping
25
3.4.1. Selection of indicators
The first step of FVI development is the selection of appropriate indicators. Standard practice (Peduzzi et al. 2001; Pratt et al. 2004; Adger & Vincent 2005; Guillaumont 2008) is preparing a list of indicators considering factors such as suitability, having a conceptual framework or a clear definition, accessibility of data, their usefulness and ease of recollection. Selected indicators should cover actual conditions and reflect the essentials of flood disaster (Li et al. 2013).
Methods which are used to select indicators of FVIs can be broadly grouped into 2 groups: quantitative methods (which are based on expert’s opinions) and qualitative methods (statistical approaches).
Among different qualitative methods Principal Component Analysis (PCA) has been commonly used in some studies to select indicators (Ka´zmierczak & Cavan 2011; Zhang & You 2013). The main quantitative methods to select indicators are Analytic Hierarchical Process (AHP), Delphi technique and Participatory Rapid Analysis (PRA).
PCA is a statistical way to convert a set of related variables by linear transformation in to another group of unrelated variables and present descending order based on the variance. In other word, PCA method is used to reduce the complexity of multidimensional data or avoiding double-counting of inter-correlated indicators .This method is applied in some studies to finalize the best indicators (Ka´zmierczak & Cavan 2011; Zhang & You, 2013; Lujala et al. 2014).
Analytic Hierarchical Process (AHP) approach (Saaty 1986) can be considered as a mathematical core of Multi Criteria Decision-Making or Multi Criteria Analysis (MCA) tool which uses pair wise comparison matrices to create a scale of preference from a set of variables (Dai et al. 2001).
26
Participatory Rapid Analysis (PRA) is a form of quick appraisals of rural and environmental conditions, developed between 1970s and 1980s, to conventional sample surveys (Younus & Harvey 2013). In this method, the analysis is open-ended which usually performs by groups of people through comparison. Participating local people in research and planning increase their effectiveness as well as saving time and money (Cornwall & Jewkes 1995). Younus and Harvey (2013) identified 45 indicators for their research through the PRA sessions in a community level in their study. In Delphi technique experts are the only participants involve in a project to get opinion while in PRA local people and communities with an extensive experience in related issue can be involved. In addition to commonly used indicator selection methods in literature (as explained above), Balica et al. (2012) used a deductive approach to identify the best indicators in terms of the vulnerability conceptual frame work. As another approach, Barroca et al. (2006) conducted extensive literature review on local projects to identify and finalize best indicators. In
this study, indicators are selected based on availability of data and MCC experts’ opinion.
3.4.2. Standardization
Considering the fact that the actual data have different measurement scales and, some of the indicators have different relationship and effectiveness on flood vulnerability (some positive and some negative), indicators should be standardized from their original values to the value ranging from 0 to 1 to eliminate the impact of different scales and dimensions on the final index (Wang et al. 2011). The standardization has to be done individually for all indicators (Fedeski and Gwilliam. 2007).
There are different methods for standardization such as standard score, maximum score, extreme method (Featuring scaling), and coefficient of variation. Featuring Scaling and the maximum score are the most common methods (Equation (3.1) and (3.2)) (Wang et al. 2011; Zhang and You 2013):
𝑉𝑖𝑠= 𝑋𝑖 − X𝑖𝑚𝑖𝑛
𝑋𝑖𝑚𝑎𝑥− 𝑋𝑖𝑚𝑖𝑛 (3.1)
where 𝑉is is a standardized value, 𝑋𝑖is the ith value, 𝑋𝑖𝑚𝑎𝑥 is the maximum value, and X𝑖𝑚𝑖𝑛 is the
27
Solin (2012) used maximum score approach to standardize indicators using the following equation:
𝑋′
𝑖 =
X𝑖
𝑋𝑖𝑚𝑎𝑥 (3.2)
where 𝑋′𝑖 is standardized score, X𝑖 is criterion score, and 𝑋𝑖𝑚𝑎𝑥is the maximum criterion score. In
this study standardization is done using the second equation.
3.4.3. Weighting
After the selection of indicators and standardization, the next step is to assign suitable weights to the selected indicators. At this step, a weighting score is individually assigned to each indicator. Weighting the indicators enables to take into account the relevant effects of each of them in vulnerability level. For weighting process, one of the most important issues is to adopt worst-case approach, if there is more than one probability to rank a specific indicator (Del Rio and Gracia, 2009).
Weighting can be carried out in two different ways: equal and unequal weighting. In the equal weighting, indicators have the same (equal) importance on the final index, whereas some of the indicators have greater or lesser degree of importance on the final index in unequal weighting. The most common unequal weighting methods in the literature to assign the weights are Delphi and AHP methods.
As mentioned above, the Delphi method involves getting expert’s opinion by using a series of questionnaires without congregating the experts at an agreed place and time. This application includes the design of some questioners, selection of key experts (respondents), distribution and collection of the completed questionnaires and data analysis (Wang et al. 2011).
28
The other methods, which were used in few studies for weighting assignment, are simple additive weighting (SAW) (Scheuer et al. 2010; Kubal et al. 2009), the weighted matrix index value (Younus and Harvey 2013) and the optimization model (Li et al. 2013; Huang et al. 2012).
In this study, indicators are weighted equally except the susceptibility indicator (i.e., drainage system quality and number of flood protection structure (DFW)) of economic component. For this indicator, considering existing flood protection structures and the quality of drainage system in each suburb, the good, medium or poor conditions are assumed and arbitrary weights are assigned to each suburb. The drainage system quality has been assessed based on the number of hotspots which are reported for the drainage system in each suburb (Moreland Flood Management Plan, 2013). The arbitrary weights for DFW indicator are 0.25, 0.5 and 0.75, which represent poor, medium and good conditions for each suburb.
3.4.4. Aggregation and final index calculation
Once suitable weights for all indicators are decided, aggregation process takes place. The two common methods for aggregation are arithmetic (additive) or geometric (multiplicative). Also, combination of these two basic methods (i.e. additive and multiplicative) can be applied for aggregation.
The arithmetic method is applied through the summation of weighted indicator (and components) values (as shown in Equation 3.3), whereas geometric method is used by multiplying weighted indicator (and component) values (Equation 3.4).
𝐼 = ∑ 𝑊𝑖𝐶𝑖
𝑁
𝑗=1
(3.3)
𝐼 = ∏ 𝐶𝑖𝑊𝑖
𝑛
𝑖=1
29
where I represents the aggregated index, n is the number of indicators to be aggregated, 𝐶𝑖 is the
component of indicator i and 𝑊𝑖 is the weight of indicator i. Aggregation can be done in three
ways: (1) from indicators to components (2) from components to final index and (3) from indicators to final index (without aggregating indicators to components). In this study, the final vulnerability index has been calculated based on arithmetic aggregation with equal weights for each component. In fact, aggregation has been done from components to create the final index by summing up amounts for each components and dividing by 3.
3.4.5. Interpretation
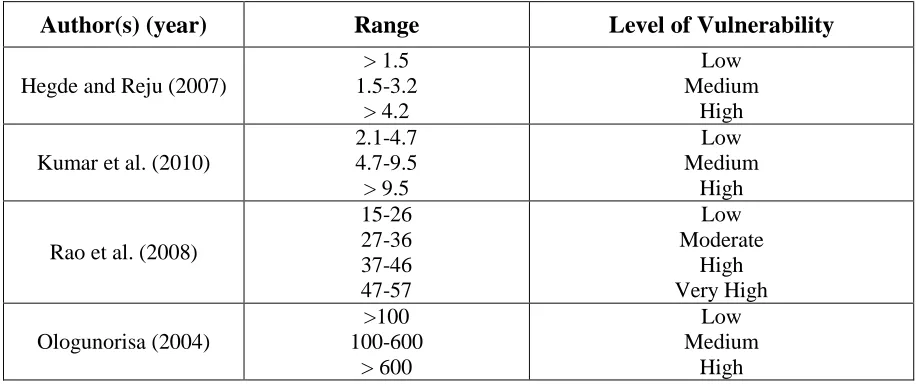
The final step of FVI development is to define an interpretation criterion to evaluate final index values. Some studies (Fedeski & Gwilliam 2007; Kumar et al. 2010) evaluated the final index based on three classes: low, moderate and high vulnerability, whereas some other studies (Balica et al. 2013; Rawat et al. 2012; Wang et al. 2011) defined a more detailed classification as very low, low, moderate, high and very high vulnerability. The common range for classifying the final index in the literature is from 0 (very low vulnerability) to 1 (high and very high vulnerability) (Solin 2012; Balica et al. 2013). Some other common ranges used in the literature are mentioned in Table 3.1 based on Hegde and Reju (2007), Ologunorisa (2004), Rao et al. (2008) and Kumar et al. (2010).
Table 3.1. Common interpretation criteria ranges for the final FVI
Author(s) (year) Range Level of Vulnerability
Hegde and Reju (2007)
> 1.5 1.5-3.2 > 4.2 Low Medium High Kumar et al. (2010)
2.1-4.7 4.7-9.5 > 9.5 Low Medium High Rao et al. (2008)
30
3.5. Summary
The structure of FVIs, consists of three components, in general, which are hydrological, social and economic as explained earlier. However, some components such as politico-administrative and environmental were rarely used in literature (Meyer et al. 2009; Balica et al. 2012). It is mostly a challenge to find reliable socio-economic data in particular for developing countries. On the other hand, hydrological indicators, which represent hydro-climatic aspect of a region, can be easily measured and to be quantified to evaluate the flood risk in a true scale (Ologunorisa 2004). Therefore, majority of FVIs in many studies consider hydrological component.
Chapter 4
33
4.1. Introduction
As discussed in earlier chapters, there is not a clear boundary for the different vulnerability components and indicators. Therefore, it is useful to adopt a methodology which can deal with uncertainties in development of a Flood Vulnerability Index (FVI). For this purpose, this chapter presents the FL method which has been applied to develop the FVI for the study area. The chapter also illustrates the different components of FL method, namely fuzzy sets, fuzzy membership degrees, fuzzy logic rules (IF…THEN rules), fuzzification and defuzzification steps as well as the fuzzy inference engine and its two common methods (Mamadani and Sugeno).
4.2. What is Fuzzy Logic?
The concept of FL or fuzzy set theory was proposed by Zadeh for the first time (Zadeh 1965). It is known as a powerful and flexible tool to model uncertainties and linguistic expressions of human knowledge in the form of mathematical relationships (Yazdi and Neyshabouri 2012). In fact, this theory was developed to deal with uncertainties that are not statistical in nature and by using fuzzy sets, a wide range of real-world problems involving linguistic descriptions may be dealt effectively (Zadeh 1997).
34
4.3. Basic concepts of Fuzzy Logic
This study uses fuzzy inference which is a primary application of FL. The main approach of fuzzy inference is taking input variables through a mechanism which is comprised of parallel IF-THEN rules and fuzzy logical operations, and then reaches the output space. The IF-THEN rules are expressed directly by human words, and each of the word is regarded as a fuzzy set. All of these fuzzy sets are required to be defined by membership functions before they are used to build IF-THEN rules. In this section, basic FL concepts such as fuzzy sets and their properties, membership functions, fuzzy logical rules, IF-THEN rules and fuzzification are presented.
4.3.1. Fuzzy sets (FS)
Fuzzy sets are introduced by Zadeh (1965) as a mathematical method to explain the vagueness in linguistics, which can be considered as a generalization of classical set theory that is known as crisp set theory. The main difference between crisp and fuzzy sets is that the crisp sets always have unique Membership Functions (MFs) however, every fuzzy set has infinite MFs which provide the maximum ability to adjust its utility based on any condition (Ahmad & Simonovic 2011; Afshar et al. 2011). To understand the fuzzy sets, first, it’s important to understand the crisp (deterministic) sets. The traditional logic assigns a Membership Degree (MD) of 1 to each item as a member of a set and 0 to the non-members.
In hydrology field, basic concepts can be generalized by replacing a crisp set as a target under the concept of fuzzy sets. In fact, by adopting the FS theory, a linguistic variable can be converted to the mathematical form of a FS. A set of linguistic variables (A) can be normalized as (Zimmermann 2010):
A={X1, µA(x)| x ⴹ X} 0≤ µA(x) = 1 (1)
where, x1 belongs to X (a range of possible values) and is an element of fuzzy set A, and the value
of µA(x) shows the membership grade of x1 in fuzzy set A (specifying to what degree x1 belongs
35
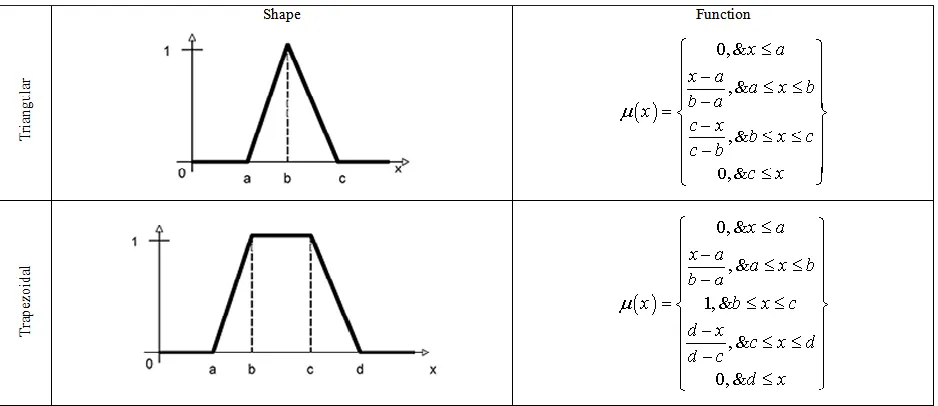
4.3.2. Membership functions
Membership Functions (MFs) or Membership Degrees (MDs) are the fuzzy sets that can be expressed by mathematical expressions by considering the normality and convexity properties. Fuzzy sets can be defined in terms of these MDs and map a domain of interest (each point in the input space) to the interval [0, 1] and generally, these fuzzy sets can be in different forms such as triangular, trapezoidal, bell and Gaussian (Lermontov et al. 2008). The simplest MD has a triangular shape and is a function of a support vector x which depends on three (a, b and c) scalar parameters, however, the trapezoidal MD is a function of a support vector x which depends on four scalar parameters (a, b, c and d). The mathematical expression of triangular and trapezoidal MDs as the most common ones are shown is shown in Figure 4.1.
Figure 4.1. Triangular and trapezoidal MDs (Sen 2010)
36
4.3.3. Fuzzy logical rules
Any hydrologic event has a generating mechanism including a set of relationships between input and output variables and can be expressed by different methodologies such as mathematic, statistic and stochastic processes in which all of them have rational and logical foundations. All these methodologies are based on the Classical Logic (CL) and it is important to have a mathematical formulation for them. Also, it is necessary to have a set of assumptions, simplification statements and parameters in a CL. Expanding a model construction from CL to FL needs detailed logical relationships among input and outputs based on fuzzy sets without limited assumptions and parameters (Sen 2010). To generate a mechanism for a hydrologic event, it is needed to express a set of rules as a fundamental requirement. Therefore, a rule base is a collection of all possible rules in which any of them explains some part of the behaviour of the hydrological event. There are many methods to establish the rule base such as mechanical, personal logic inspirations, and expert views on the event prior to rule base establishment. However, it is important to fuzzify all input and output linguistic variables (Lermontov et al. 2008; Kohonen 2001; Chen & Mynett 2004). The fuzzification establishes a bigger generality and efficient ability to model a real world problem. In other words, FL helps to gain robustness and lower solution cost.
4.3.4. Fuzzification
One of the purposes of modelling is to map input variables to output variables in a way that the output variables show the minimum error. It is not compulsory to have a database for FL modelling in the beginning. The first stage of FL modelling is that of identifying input and output linguistic variables and then breaking them down to the formal fuzzy subsets. Following points are important in fuzzification:
- There may be many input variables whereas there is a single output variable. In fact, it is
Multiple-Input-Single-Output modelling (MISO).
- It has been advised that the number of fuzzy sets should be taken at least three because it
37
- With regards to fuzzy set shapes, they must be determined and it is advised to depend on
triangular and trapezoidal MDs initially to establish the model.
- The most right and left sides of MFs must reach to MDs equal to 1, in any fuzzification
procedure.
For any successful modelling study, it is important to decompose linguistic variables in a qualitative way by considering the above points (Zadeh 1997; Seising 2007; Sen 2010).
4.3.5. “IF…THEN…” Rules
A grammatical sequence of words in any language is a sentence (Sen 2010). Sentences should express a meaning by connecting different conditions to each other. Scientific sentences have two parts which are referred to as premise. The premise also, has two parts: the antecedent and the consequent. The input conditions are explained in the antecedent part and the input condition are implied in consequent portion. In most of the cases the premises has “IF…THEN…” format. In our case, an example can be expressed as below:
“IF the number of disabled people are in the low range (fuzzy set), THEN the vulnerability is low.”
The above sentence defines the relationships among the inputs, outputs and fuzzy sets. In general, IF…THEN rules can be written in the following way:
IF A is a THEN C is c.
IF B is b THEN C is c.
where a, b, and c are the linguistic terms for the subsets expressed for sets A, B, and C, respectively.
38
different groups, and the Fuzzy Inference Systems (FISs) and rules were created for each group. Then, outputs of grouped FISs were re-grouped, and final FIS were created for each component.
4.4. Fuzzy inference system
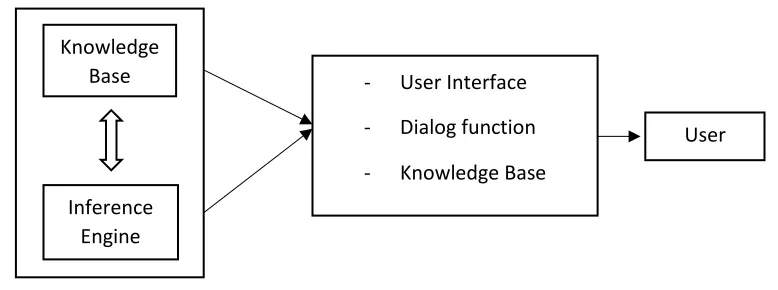
Structure of a fuzzy system is based on numerical estimation. The FIS of a fuzzy expert system, uses a collection of MDs and rules, instead of mathematical statement, and provide approximate reasoning about data. Each expert system has 2 main functions. One is problem solving by using different domain-specific knowledge and the second one is the user interaction function (Adriaenssens et al. 2004). In general, an expert system which is a user-interactive set up, as shown in Figure 4.2, has three major parts:
1) Knowledge base: this section includes the specific knowledge and facts about the application
domain plus the rules that describe relations.
2) Inference engine: this part uses the available knowledge to perform reasoning to gain answers
for user’s questions.
3) User Interface: this section enable the user to communicate with the system and give an insight
into the user in terms of problem solving process through the inference.
Figure 4.2. Structure of a user-interactive fuzzy expert system (Sen 2010)
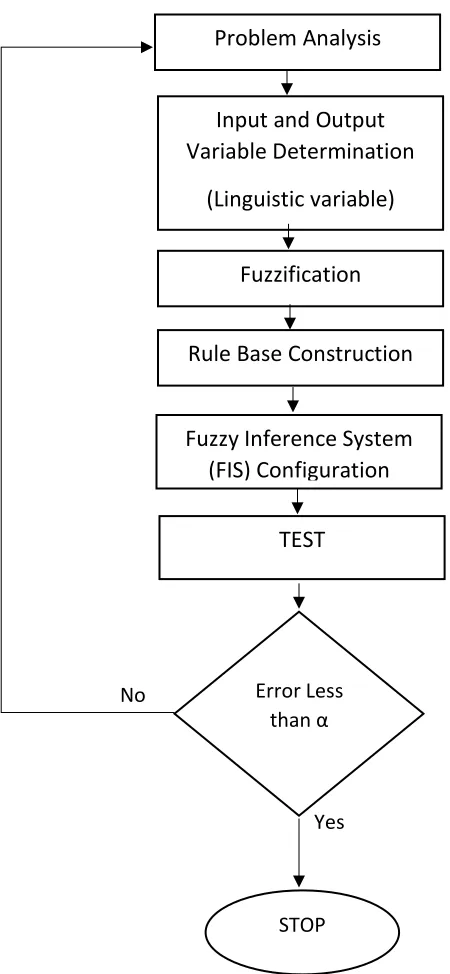
The general steps of any FIS application in practice are also shown in Figure 4.3.
Knowledge Base
Inference Engine
- User Interface - Dialog function - Knowledge Base
39
In summary, the first step is to take inputs in and express the degree to which theybelong to each
of the fuzzy sets through the membership functions. Then and after fuzzifying inputs, the membership degrees for the premise is computed for each rule and is applied to the concluding part of each rule. The results are assigned to each output variable for each rule in one fuzzy subset. In next step, all the fuzzy subsets will be aggregated to form a single fuzzy subset for each output.
Problem Analysis
Input and Output Variable Determination
(Linguistic variable)
Fuzzification
Rule Base Construction
Fuzzy Inference System (FIS) Configuration
TEST
Error Less than α
STOP Yes No
40
Finally, in defuzzification step, the fuzzy output set will be converted to a crisp number by using the different defuzzification methods (Gharibie et al. 2011; Raju et al. 2011). There are two common fuzzy inference methods. The first one is Mamadani, which is presented by Mamadani (1975) to control a steam engine and boiler combination. The other fuzzy inference system is the Sugeno, which was proposed by Sugeno (1985) also known as Takagi-Sugeno type (Sen 2010; Raju et al. 2011).
4.4.1. Mamadani FIS
Mamadani FIS was presented by Mamadani (1975) to control a steam engine and boiler combination. This FIS is completely fuzzy in input, output and rule base and so, the estimations are fuzzy sets which are not formal but in various shapes without any MD equal to 1. This FIS system helps the user to include unavoidable imprecision in the available data. Mamadani FIS is the genuine process of mapping based on the given set of input variables to an output using a set of fuzzy rules with fuzzy inputs and outputs. The general steps below are necessary for the successful application of a Mamadani (Jang et al. 1997; Sen 2010).
1) Fuzzification of inputs: The first step is to take inputs in and express the degree to which they
belong to each of the fuzzy sets through the membership functions.
2) Inference: After fuzzifying inputs, the membership degrees for the premise is computed for
each rule and is applied to the concluding part of each rule. The results are assigned to each output variable for each rule in one fuzzy subset.
3) Composition: At this stage, all the fuzzy subsets will be aggregated to form a single fuzzy
subset for each output.
4) Defuzzification: The fuzzy output set will be converted to a crisp number by using the different
defuzzification methods.
41
Figure 4.4. Mamadani FIS System (Yazdi and Neyshabouri 2012)
4.4.2. Sugeno FIS
The second fuzzy inference system is the Sugeno, which was proposed by Sugeno (1985) also known as Takagi-Sugeno type (Takagi and Sugeno 1985). They presented a systematic method to generate fuzzy rules, based on a given set of input-output data. The Takagi & Sugeno fuzzy inference system contains an inference system that the fuzzy rule conclusion comprises a weighted linear combination of a crisp inputs. This system is good for approximating a large class of non-linear systems. In Sugeno FIS, each rule has a crisp value as an output therefore, the final overall output will be produced as a weighted average and no need to pass a time-consuming defuzzification process as Mamadani FIS requires. In general the difference between these two systems are the definition of the consequent parameters (Rezaei et al. 2013; Sen 2001). Figure 4.5 shows the schematic view of Sugeno FIS system.
Inputs (Crisp values)
Fuzzification
Fuzzy Inference Engine (FIS)
Defuzzification
Fuzzy Rule Base Output
(Crisp value)
42
. .
4.4.3. Defuzzification
The reverse process of fuzzification is defuzzification. In fact, it converts the confidences in fuzzy sets which are expressed in words into real numbers. This step is necessary especially when the output needs to be expressed as a crisp number by the user. In other words, the final step of this approximate reasoning algorithm is choosing a crisp number as the output variable.
4.5. Summary
FL is known as a powerful and flexible tool to model uncertainties and linguistic expressions of human knowledge in the form of mathematical relation (Yazdi and Neyshabouri 2012). This theory was developed to deal with uncertainties that are not statistical in nature (Zadeh 1965) and by using the theory a wide range of real-world problems involving linguistic descriptions may be dealt effectively (Yen and Langari 1998). The fuzzy sets involve the subjective uncertainties and ambiguities of judgments in vulnerability assessment, therefore it is a very helpful approach in flood vulnerability index development. This method has grown in the field of water resources management successfully during last decades. Development of a Fuzzy Logic (FL) based FVI is one of the objectives of the present study by choosing proper fuzzy sets, membership functions and generating suitable IF…THEN rules.
Input
If X is ‘A1’ Then ‘Y’ is f1 If X is ‘A1’ Then ‘Y’ is f1
If X is ‘A1’ Then ‘Y’ is f1
∑
OutputChapter 5
44
5.1. Introduction
The FVI method and FL approach as well as their advantages were discussed in chapters 3 and 4 respectively. A combination of the methods is applied to the study area by selecting 24 indicators of three vulnerability factors in the region. This chapter presents the steps of the methodology which has been applied in the study area and discusses the following sections: data collection and selection of indicators, indicator standardization and weighting, calculation of FVIs through application of FIS, aggregation of FVIs, and interpretation of the FFVIs. Finally, results are provided for each of the social, economic and hydrological components in GIS maps and the most and the least vulnerable suburbs are identified.
5.2. Study area
Moreland City (MC) covers an area of 50.9 km2 and is located in the inner and mid-northern parts
of Melbourne. The area consists of 12 suburbs (355 grids) including Gowanbrae, Glenroy, Fawkner, Hadfield, Oak Park, Pascoe Vale, Pascoe vale South, Coburg North, Coburg, Brunswick West, Brunswick East and Brunswick. MC is mainly bordered by Moonee Pond Creek to the west and Merri Creek to the east. According to the available census data, the residential population of the MC is 155,087 as in June, 2011 (Id community 2016). Figure 5.1 shows the location and suburbs of MC. In general, MC experiences two types of floods:
1) Riverine flooding which happens when the water overtops the bank in the creek or river
2) Overland flooding which happens when the capacity of the local drainage network is not able
to carry the excess stormwater flow
45
5.3. Research Methodology
General steps of the research methodology are consists of five steps as shown below:
1. Data collection and selection of indicators
2. Standardization and weighting of indicators
3. Calculation of FVIs through application of FIS
4. Aggregation of FVIs
5. Interpretation of the FFVIs
5.3.1. Data collection and selection of indicators
The required data for this project can be categorized into three groups (under hydrological, social and economic components) as shown in Table 5.1. Required data are collected from Bureau of
Moreland City Suburbs
Melbourne