Volume 2009, Article ID 134579,12pages doi:10.1155/2009/134579
Research Article
Contiguous Frequency-Time Resource Allocation and
Scheduling for Wireless OFDMA Systems with QoS Support
I. Guti´errez,
1F. Bader,
2R. Aquilu´e,
1and J. L. Pijoan
11Enginyeria i Arquitectura La Salle, Ramon Llull University, Ps. Bonanova, 8. 08022 Barcelona, Spain 2Access Technologies Department, Centre Tecnol`ogic de Telecomunicaci´o de Catalunya (CTTC), PMT,
Avenue Canal Ol´ımpic, s/n 08860 Castelldefels, Spain
Correspondence should be addressed to I. Guti´errez,[email protected]
Received 22 July 2008; Accepted 24 February 2009
Recommended by Thomas Michael Bohnert
The orthogonal frequency division multiple access (OFDMA) scheme has been selected as a potential candidate for many emerging broadband wireless access standards. In this paper, a new joint scheduling and resource allocation scheme is proposed for the OFDMA systems using contiguous subcarrier permutation. The proposed resource allocation algorithm provides contiguous sets of frequency-time resource units following a rectangular shape yielding a reduction on the required burst signalling. The joint scheduling and resource allocation process is divided into two phases: the QoS requirements fulfilment and the input buffers emptying status. For each phase, a specific prioritization function is defined in order to obtain a trade-offbetween the fairness and the spectral efficiency maximization. The new prioritization scheme provides a reduction of 50% of the 99th percentile from the delivered packets delay in case ofnon real-timeservices, and 30% of the packet loss rate in case of real-time services compared to the proportional fair scheduling function. On the other hand, it is also demonstrated that using the rectangular data packing algorithm, the number of required bursts per frame can be reduced up to a few tenths without compromising the performance.
Copyright © 2009 I. Guti´errez et al. This is an open access article distributed under the Creative Commons Attribution License, which permits unrestricted use, distribution, and reproduction in any medium, provided the original work is properly cited.
1. Introduction
The forthcoming 4th generation (4G) wireless networks are
expected to support high data rates (i.e., spectral efficiencies
from 10 to 20 bits/s/Hz are required) and high amounts of simultaneous users, especially in the downlink communi-cation mode [1]. Recently, the major 3G standardization bodies, that is, the 3G Partnership Project (3GPP) and the 3GPP2, have defined the orthogonal frequency division multiple access (OFDMA) scheme as the dominant physical layer (PHY) communication technology. As the early stages of 4G wireless networking unfold, system developers are beginning to consider the OFDMA solution as the best suited for WiMAX (IEEE 802.16e/m) [2] systems and other multicarrier-based equipment (e.g., 3G-LTE, VSF-OFCDM from NTT-DoCoMo, or FLASH-OFDM from Qualcomm)
[3,4].
The OFDMA technique efficiently combines discrete
multicarrier modulation with frequency division multiple access. The advantages of OFDMA include the flexibility in
subcarrier allocation, the absence of multiuser interference due to subcarrier orthogonality, and the simplicity of the receiver among others. In current OFDMA systems like IEEE 802.16e, the subcarriers are grouped into larger units referred to as subchannels [2]. Then, these subchannels are grouped into bursts, where each burst is mapped to one user (in unicast) or a group of users (in broadcast). The burst allocation and the modulation and coding scheme (MCS) applied to each burst are adapted on a frame basis. This allows the base station (BS) to dynamically adjust the bandwidth usage per user according to the users’ requirements, that is, the quality of service and the users’ current channel state.
Scheduling policies based onweighted fair queuing
Table1: Signalling data per burst used in the DL-MAP.
Field Size in bits
Number of CIDs,J 8
CIDs (optional) J·16
MCS 4
OFDMA symbol offset,ti 8
Subchannel offset,ci 6
Number of OFDMA symbols,wi 7
Number of subchannels,hi 6
Boosting 3
proportional to the offered data rate. However, the main
drawback of PFS comes from the fact that it considers
full buffers and constant bit rate (CBR) streams. Clearly,
multimedia networks have to deal with different traffic types,
for example, variable bit rate (VBR) streams with very strict packet delay requirements. Recent trends in packet scheduling consider cross-layer implementations such as those proposed in [9–11]. Liu et al. proposed in [9] a scheduling algorithm where a priority is assigned to each user according to its instantaneous channel and service status. The channel state is obtained directly from the average received signal-to-noise ratio (SNR), and the service status is obtained from the delay of the head-of-line packet. The same principle is extended to the OFDMA system in [10], where the priorities are also assigned as a function of the subchannel index. Furthermore, Jeong et al. in [11] proposed to prioritize the packets according to the so-called “emergency factor” which is the ratio between the packet delay and the maximum delay constraint. Therefore users with higher emergency factor are scheduled first.
However, no one of those proposals has considered the
effects of the resource allocation regarding the required
signalling and its payload neither the need of rectangular shaped bursts. Each burst is signalled at least by its position
in the frame (starting subcarrier and symbol, ci andti in
Figure 1), the number of allocated MRUs in frequency and
time (hi andwi), the MCS, and (optionally) the associated
service flow or connection identifier (SFID/CID) [3].Table 1
resumes the fields that are transmitted for each burst. In this proposal, we define one burst as a set of continuous minimum resource units (MRUs) (logical or physical) in both time and frequency domains following a rectangular shape containing data from one service flow. Each service flow is a unidirectional stream of packets with a particular set of QoS parameters [2]. Ben-Shimol et al. proposed in [12] to allocate the resources following a “raster approach” to fit the resources into a rectangular shaped burst such that the resources are allocated first in frequency direction
and later in time direction (seeFigure 1). Another algorithm
that minimizes the number of bursts given the amount of resources allocated to each user has been proposed
by Erta et al. in [13]. However, the works in [12, 13]
have been conceived considering that the channel within each subchannel is uncorrelated among subcarriers (thus a subcarrier permutation algorithm is assumed); thus the
DLMAP + ULMAP
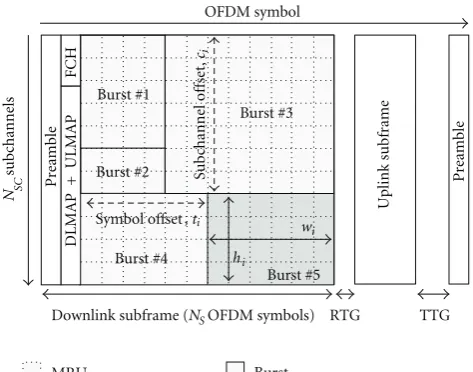
Figure1: IEEE 802.16e OFDMA frame in TDD mode and burst structure.
number of MRUs allocated to each user can be determined a priori according to the average SNR. Though these proposals
may achieve a good tradeoffbetween complexity and spectral
efficiency, the gain from frequency scheduling (and multiuser
diversity) is minimized since the channel effects have been
averaged through all the bandwidth.
In this paper, a new dynamic radio resource management scheme considering the rectangular burst shape required for the IEEE 802.16e frames is presented. The proposed algorithm, which can be used indistinctly in case of cor-related or uncorcor-related channels per subchannel, jointly performs packet scheduling, resource allocation as well as adaptive modulation and coding (AMC) when uniform power allocation is applied. The main contributions from this paper are (i) a new resource allocation algorithm which reduces the number of bursts per frame by allocating continuous MRUs, hence reducing the required signaling per frame, and (ii) a new prioritization function which allocates the resources in a fair fashion as the PFS. In order to assess the performance of the proposed scheduler (which is able to cope with maximum packet delays and
VBR streams) different performance analyses are provided
where the PFS is also studied and compared. The paper focuses on the downlink communication mode based on IEEE 802.16e system parameters. However, it can be also applied to any other OFDMA-based scheme. Furthermore, since the user’s data are in almost all the cases packed together in the time and/or the frequency domain, the mobile stations (MSs) power consumption is also reduced due to the reduced number of active symbols (shorter connection in time) or the reduced number of active subchannels (lower computational cost at the receiver) [14].
The rest of the paper is organized as follows. InSection 2
the system model considered is described. The proposed radio resource management scheme is then studied in
proposal is shown in Section 4 obtained over extensive computer simulations. Finally, some conclusions are drawn
in Section 5, where the benefits and the drawbacks of the
overall approach are stood out and summarized.
2. System Description
We consider in this proposal the downlink mode in the IEEE 802.16e PMP (point-to-multipoint) system with one
single cell with a total of K MSs within its cell area with
no interference sources. We consider only the time division duplexing (TDD) scheme; thus channel reciprocity can be assumed between uplink and downlink. The whole TDD
frame is formed by a total ofNssymbols withTframeduration.
The number of downlink and uplink OFDM symbols usually follows the ratio 2 : 1 or 3 : 1; however, it can be adjusted by the BS according to users’ demand [2].
The whole transmission bandwidthBW is formed by a
total ofNcsubcarriers where onlyNusedare active. The active
subcarriers include both the pilot subcarriers and the data
subcarriers which will be mapped over different subchannels
according to the specific subcarrier permutation scheme [2]. For the full usage of subcarriers (FUSC), pilot subcarriers are allocated first and the remainder subcarriers are grouped into subchannels where the data subcarriers are mapped. On the other hand, the partial usage of subcarriers (PUSC) and the adjacent subcarrier permutation (usually referred as Band AMC) map all the pilots and data subcarriers to the subchannels, and therefore each subchannel contains its own set of pilot subcarriers. For the FUSC and PUSC, the subcarriers assigned to each subchannel are distant in frequency, whereas for the Band AMC the subcarriers from one subchannel are adjacent. Note that the FUSC and PUSC increase the frequency diversity and average the interference, whereas the Band AMC mapping mode is more convenient for loading and beamforming where multiuser diversity is increased [10].
As it is depicted in Figure 1, the MRUs allocated to
any data stream within an OFDMA frame have a two-dimensional shape constructed by at least one subchannel and one OFDM symbol. In the IEEE 802.16e standard the specific size of the MRU varies according to the permutation scheme; concretely for the Band AMC it may take the shapes
9×6, 18×3, or 27×2 (subcarriers×time symbols, resp.),
where 1/9 of the subcarriers are dedicated to pilots. We define
an MRU as a resource unit formed by a set of Nsc×Nst
symbols in frequency and time domains, respectively. Once the size of the MRUs is defined we can obtain the total
number of MRUs per frameQ×T,whereQ=Nc/Nscis the
number of subchannels andT =Ns/Nstdefines the number
of the time slots.
Several MRUs may be grouped into a data region or burst
(seeFigure 1), formed by successive MRUs in frequency and
in time directions. Both the MRU and the data region always follow a rectangular shape structure. We consider the case that the transmitted data in each burst belongs to only one service flow (i.e., to a single MS), and the MCS applied to each burst might be adapted. Since the MS receiver needs
to know how the downlink frame is organized in order to properly decode the data, the downlink control channel includes the number of bursts transmitted as well as the signalling for each burst. In the IEEE 802.16e each burst is
signalled by the parameters indicated in Table 1. Multicast
transmission is addressed by mapping different connection
identifiers (CIDs) to each burst, where the BS is responsible for issuing the service flow identifiers (SFIDs) and mapping
it to single CIDs. As it is shown inFigure 1, the signalling
bits described in Table 1 are those used into the DL-MAP
structure and transmitted at the beginning of each frame after the synchronization preamble and the frame control header (FCH) [2].
3. Radio Resource Management
One of the main goals of the radio resource management
function is to maximize the spectral efficiency. This is
performed at the BS by the radio resource agent and by the radio resource controller which can be implemented apart from the BS. The tasks performed include the channel estimation, the channel quality indicators management, and the control of the radio resources assigned to the BS. Since most of the tasks related to resource allocation and scheduling are not defined in the 802.16.a/e standards, each operator or system developer can tune and optimize its network according to collected performances and metrics [15].
In Figure 2, the protocol stack according to the IEEE
802.16e standard is depicted. As it was previously mentioned, only the medium access controller (MAC) layer and the physical (PHY) layer are defined within the standard [2]. This work will focus at the MAC layer blocks which perform the resource allocation and scheduling procedures and those
implied blocks (i.e., the input queuing buffers), the packet
data unit (PDU) management and fragmentation, and the burst mapping. Therefore, all blocks within the dotted line
shaded shape are affected by the current proposal. On the
other hand, the air link control (ALC) is in charge of recollecting the MS’s channel state information which is later used by the scheduling and resource allocation processes as well as other procedures such as the power control or the ranging among others.
Following the block diagram in Figure 2, each data
stream is classified according to its class of service and mapped to a single service flow (SF). Without loss of generality, in this work it is considered that each MS has only one active SF. The packets from each SF are then
independently buffered and each incoming packet is time
stamped. The packets are asynchronously received at the
input buffers following a rate that depends on the specific
SF properties. Five service classes are defined in the IEEE 802.16e [2] as follows:
PHY
Randomizer
Channel coder
Bit interleaver
Modulation
Pilot insertion
Signalling
IFFT + guard interval insertion
Frame format
Data flow Control
Packet
classifier (QoS)
Queuing
management Authent.
Secu
Figure2: Protocol stack at the BS and layers interaction.
(ii)real-time polling service (rtPS)class:fitted to support real-time SFs that generate variable data packets size on a periodic basis (e.g, video conference, MPEG, etc.);
(iii)extended real-time polling service (ertPS) class:similar
to the UGS class, but some of the periodic packets might be missing due to silence periods (e.g., VoIP with silence suppression);
(iv)nonreal-time polling (nrtPS)class: in this case the SFs are variable packet size data packets, delay tolerant, where only minimum data rate is specified;
(v)best effort (BE) class: designed to support a data
transmission when no minimum service level is required.
As it is depicted inFigure 2, the data from the input buffers
is monitored by thescheduling and resource allocationblock.
During each frame all the input packets are evaluated for
transmission, and according to the channel state from each user and the scheduling policy some of the packets are scheduled (and may be fragmented) for transmission in the subsequent frame. The scheduling process is strictly connected to the resource allocation process since the latter is who determines how many resources are assigned to each SF in every frame. Once the resources per SF have been resolved, the packet data unit (PDU) block prepares the data that will be mapped into each burst at the PHY layer. Thus, the PDU block and its counterpart at the MS side are responsible of the fragmentation and the reconstruction of the network layer
packets. Finally, theburst mappingblock breaks the packet
data units in order to map each fragment into one physical
burst. Each physical burst may apply a different MCS. The
MCS for each burst is obtained according to the effective
SNR (SNReff) of the channel over the MRUs assigned to the
burst. For low mobility scenarios we can consider the channel for each subcarrier nearly constant during the whole frame;
thus, the SNReff is an arbitrary function of the different
postprocessing SNR per subcarrier (SNRi) and the MCS,
SNReff=f(SNR1, SNR2,. . ., SNRn, MCS), (1)
where SNReff would be the SNR that, in case of an additive
white Gaussian noise (AWGN) channel, would give the same bit error rate (BER). Several metrics as the exponentially
effective SNR (EESM) [16], the mean instantaneous capacity
(MIC), or others based on the mutual information per bit
can be applied to obtain the SNReff[15,17]. In our proposal,
the harmonic mean of the channel values has been used as proposed in [18], which gives a tight lower bound of the BER and is independent of the MCS. Next subsections describe the scheduling and resource allocation algorithms presented in this paper.
3.1. Resource Allocation and MCS Selection Problem
For-mulation. The main goal of the resource allocation and
scheduling mechanisms is to maximize the system
through-put (i.e., the spectral efficiency) while guaranteeing the QoS
constraints for each SF. Actually, most of these constraints are defined by the average bit rate, the peak bit rate, the minimum bit rate, the maximum tolerated delay per packet (and jitter), and the average bit error rate (or packet error rate). Nevertheless, one key issue for any resource allocation scheme is to minimize the signalling that is required to inform the receivers how the frame is structured. Following the IEEE 802.16e transmission format, since each burst requires a specific signalling, it is suitable that all the scheduled packets belonging to the same SF are transmitted within the minimum number of bursts hence the signalling is minimized.
Thus the optimum shape and position of each burst (with its respective MCS) are explored while the QoS require-ments are fulfilled for each user. To reduce the algorithm complexity, the optimization problem formulation considers uniform power allocation across subcarriers and that each SF is allocated a single burst per frame. According to these
premises and considering that there are M active SFs, the
guarantees the different QoS requirements while maximizing
the spectral efficiency can be mathematically expressed by
arg max
In (2) the term ICC means the number of the required
signaling bits transmitted within the control channel for each
burst. The minimum required bits per framebifor theith SF
are obtained by (3), whereLi,pis the pth packet size in bits
from theith SF,τi,p is the packet delay (time the packet has
been queued in the buffer),τmax,iis the maximum allowed
delay per packet for theith SF, andPithe total number of
the queued packets.ξiis a binaryQ×Tmatrix which points
out which MRUs are allocated for theith SF (i.e.,ξi(n,k)=1
means the (n,k) MRU has been assigned to theith SF). In
order to force that each burst follows a rectangular shape, the
ones inξi must be placed inside a rectangle. Since eachith
burst must follow a rectangular shape and considering the
burst starts atni andki withhi andwi the number of the
MRUs in frequency and time, respectively,ξiis given by
ξi(n,k)=
Equation (4) guarantees that the different bursts do not
overlap (as seen inFigure 1). Finally, (5) and (6) determine
the actual number of bits transmitted within theith burstRi.
The termηirepresents the upper layer throughput (in bits)
per MRU, and it is obtained as a function of the calculated
SNReff per each burst, the available MCS, and the upper
bound BER.
3.2. Proposed Joint Packet Scheduling and Resource Allocation.
The resolution of (2) to (6) might be obtained using non-linear programming techniques. However, such techniques are not feasible for practical systems due to prohibitive computational complexity. Furthermore, the problem as defined from (2) to (6) is very rigid since it forces the number of bursts to be equal to the number of services flows, and in consequence all service flows are scheduled during each
frame. However, the optimum number of bursts,B, should
be adapted to the different channel conditions (an MS may
experience deep fading during certain frames). In addition, using a unique burst per user may decrease the spectral
efficiency when the burst spans over a large bandwidth due
to the effect of frequency selective fadings.
To overcome these limitations, the authors propose a low complexity iterative algorithm that adapts the number of bursts for user scheduling and resource allocation purposes
(O(KNscNst)). In order to maximize the spectral efficiency
and undertaking the service flows QoS requirements, the resource allocation and the rate adaptation problem is
described in Section 3. A is divided into two stages: the
minimum requirements fulfilment and the spectral efficiency
maximization. For each stage a different prioritization
function is applied.
3.2.1. Service Flows Prioritization. In order to select which resources will be assigned to each SF (and thus to each
MS), each ith service is assigned a priority over each nth
subchannel (we assume that the channel is constant in time during the whole frame, that is, low mobility environment).
For the well-known PFS [7], the priorityϕi(n) assigned to
eachith SF in eachnth subchannel is given by
ϕi(n)|PFS=
MCS that can be applied on the nth subchannel giving
an instantaneous BER lower than a certain upper bound
BERmax, Thus,ηi(n) = 0 denotes a deep fading in the nth
subchannel for theith MS, and clearly in this case the priority
becomes zero.ηmaxis the spectral efficiency achieved by the
highest MCS. Thi(t) is the average throughput obtained by a
moving average window withαas the latency scale and Thi(t)
the instantaneous throughput, thus
Thi(t)=1
On the other hand, fairness might be also achieved by means of ad hoc user satisfaction indicators as proposed in [9–11]. However, most of these algorithms have been designed based on the average bit rate requirements, without considering
the buffers state neither the VBR nature of the traffic. To
overcome these restrictions, the authors propose a time
stamped packets scheduling (TSPS) function based on the
input buffers status, the time stamps from each packet, and
the channel metrics. Then, for the TSPS the users’ priorities
with
term bi in (11) means the minimum number of bits that
should be transmitted in the actual frame in order to achieve
a delay for each packet τi,p ≤ τmax,i − Δτ, where Δτ is
a guard time. bmax is a normalization factor which is the
maximum number of bits that could be transmitted within a frame using the highest MCS. Furthermore, in case any
packet from the ith SF is close to exceed its maximum
delay the term bi/bmax is substituted by an urgency factor
Purgency, which boosts the data transfer from theith SF [11].
Analogously, the packet that is close to achieve the maximum delay is entirely considered for transmission in the current
frame by including the whole packet in bi. The value of
Purgency might be different for each class of service (i.e.,
Purgency =100 for the UGS andrtPStype,Purgency =10 for
thenrtPS, otherwisePurgency = 1). Actually, those classes of
service whose packets are susceptible of being dropped in case of excessive delay should be prioritized. Furthermore, notice that in case an SF has not been allocated the minimum
resourcesbiduring the current allocation process, its priority
in the next frame will be automatically increased. Finally, in
case a buffer is empty the priority given to that SF is zero.
In order to check the performance of the TSPS proposal a
modified version of the PFS called buffer-based PFS (b2PFS)
is also introduced where, instead of balancing the throughput
of the different users, the scheduler levels the number of
buffered bits from each user and in consequence VBR
streams can be managed (improving the performance of the
PFS). Thus for the b2PFS scheduler (8) is substituted by
ϕi(n)|b2
3.2.2. Iterative Resource Allocation and Scheduling Algorithm.
Once the priority for each SF over each subchannel ϕi(n)
and the minimum bits per frame bi have been obtained,
the MRUs are allocated iteratively in order to guarantee the QoS of all SFs (their minimum required bits per frame). The flowchart of the proposed algorithm is shown in Figure 4. Two cases are considered during each iteration: (i)
NS OFDM symbols
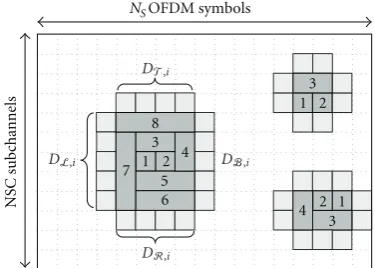
Figure3: Burst increase options and example of bursts increments after 15 iterations.
a new burst might be created and (ii) an already existing burst might be increased by allocating another MRU (or a group of) to the burst. In the second case, when one MRU is allocated to an existing burst no extra signaling is required; however, the enlargement of the burst may lead to a reduction on the MCS level.
As it can be observed in Figure 3, each burst may be
increased towards four directions, that is, top, bottom, left, and right with respect to its position in the frame. In order to determine in which direction the increase is more
advantageous or suitable, an equivalent priority Dx (x ∈
{T, B, L, R}) is assigned to each direction (as indicated
inFigure 3) whereDx is obtained by averaging the priority
valuesϕi(n) of the MRU that are covered by the enlarged
burst. Whether in thexdirection there is any occupied MRU
or the burst is at the frame boundary then Dx is forced
to 0. An example of the increasing principle is shown in
Figure 3 where the numbers inside the rectangles indicate
the order in which the resources have been allocated to each burst. In this example, three bursts have been created after 15 iterations, where the number indicated inside each MRU indicates the order in which the MRUs have been allocated. Note that as the burst increases more MRUs are allocated per iteration and as consequence, the resource allocation process is accelerated.
The algorithm, depicted inFigure 4, starts without any
allocated burst (B = 0). For the first burst, the (n,k)th
MRU is allocated according to theith service flow and the
nth subchannel combination that maximizes the value of
ϕi(n). The position on the time axis of the MRU allocated
to the first burst is forced to k = 0. Once the first burst
is created, the iterative process starts checking the possible increments of the already existing bursts while at the same time it tries to the generate new bursts. Iteratively, the option with the highest priority is allocated a new MRU (in case of creating a new burst) or a group of MRUs (in case of enlarging an existing burst). In case a new burst is created
It has been stated before that Yi(n) is time independent
Next allocated
MRU?
Yes
Yes
Yes
Yes
Yes Yes
Is it a new
burst?
No
Estimate SNReff
Obtain MCS
Update R , L
Requirements
fullfilled?
(R i> b )i
Is there any
unallocated
MRU?
Burst increase
Best burst,
inc. direction and
equivalent priority
Any of its
bursts can be
increased?
No No
No
No
No
The kth SF
has any allocated
burst?
New burst
k<K
k = K + 1
k = 0
i i
Equivalent priority
Best TTI burst
placement?
B = B + 1
ϕeq,k
ϕeq,k×Pburst
Updateξ,θ
arg max
i,n ϕ
Obtainbiandϕi(n)
forminimum requirements allocation
Updatebiandϕi(n)
forspectral efficiency
maximization Start:B=0
Resetξ,θ
Figure4: Resource allocation and scheduling algorithm flowchart.
Table2: Parameters of the simulated classes of service.
Class of service Average bit rate [Kbps] Peak bit rate [Kbps] Max. delay [ms] Packet rate [packets/s]
rtPS(videocall) 380 2000 50 10
nrtPS(streaming) 2000 10000 300 10
UGS 0.015 0.015 75 10
WWW — 2000 ∞ Variable
FTP — 10000 ∞ Variable
to other already allocated MRUs. This in fact assures that the new created burst has higher chances to be increased than whether it is placed near to the other already created bursts. Nevertheless, in order to achieve the lowest number of bursts, the equivalent priorities associated to each burst
increment are multiplied by aPburstfactor (e.g.,Pburst=5) to
push forward the enlargement of the existing bursts instead of generating new ones.
The algorithm is then iterated until all the requirements are fulfilled or when all the resources have been allocated. The number of bursts is not fixed and may change from
frame to frame depending on the buffers state, the QoS
requirements, and the channel state conditions. Moreover, since each SF may have more than one burst, another
auxiliary matrixθwith size (Q×T) is defined. Each value ofθ
indicates to which burst the MRU is allocated. Both matrices
ξandθare updated each time a new MRU is allocated.
Considering the MCS applied in each burst, we can
obtain how many bits from each buffer are going to be
transmitted and thus checking if the minimum requirements are met. If the minimum requirements are satisfied, thus Ri ≥ bi for i = 1,. . .,K, and in case there is still any unassigned MRU, these unallocated resources should be used
to flush the input buffers. Since the minimum requirements
for the SF have been already allocated, the spectral efficiency
can be maximized by transmitting the data from those SFs associated to the best channel conditions. Considering that
the status of the input buffers has been updated according to
Ri, we can apply the same algorithm but with the following
scheduling priorityϕi(n):
ϕi(n)=
⎧ ⎪ ⎨ ⎪ ⎩
ηi(n) ηmax
, if∀Li>0,
0, otherwise.
Now, the number of required bits per frame bi is directly
obtained from the remaining buffered bits after the previous
allocation process, that is,
bi= P
p=1
Li,p. (15)
Finally, the end of thejoint scheduling and resource allocation
process may be achieved due to two main indicators: (i) all
the MRUs have been allocated, or (ii) the input buffers have
been emptied. The number of allocated bits to each SF will be then determined by the number of bursts associated to such SF and the MCS of each burst. Since the packets must
be received in the correct order, the data from the buffers is
extracted from older packets to newer packets (as in a
first-in first-out queue). The delivered packet delay τi,p is then
measured as the time since the packet is queued at the buffer
until the instant where all the bits from the packet have been transmitted.
4. Performance Results
The simulated scenario is focused on a single cell system environment having the main system parameters detailed in Table 3. The simulation environment has been carried out
using a developed simulator using c++ andit++
communi-cation libraries. The simulator includes both the link level and the system level properties where both the MAC and the PHY properties of the WiMAX system are considered
(see Table 1 parameters). During each simulation run, the
users are dropped at different positions following a uniform
distribution within the cell area. The position of the MSs remains fixed during the whole simulation process while the speed of each MS is only employed to determine the
Doppler effect and the channel coherence time [17]. A
simulation time analysis of 50 seconds is considered to be enough to ensure the convergence of the service flows and the performance metrics. The full process is repeated with the MSs dropped at new random locations. The number of simulated drops is 25, which makes the results independent of the users’ position. Without loss of generality but to simplify the results, a single SF is assigned to each user. The channel estimation is assumed ideal at the base station, and packet retransmission is not considered. Five
service classes, summarized inTable 3, have been considered
according to the traffic models in [17, 19]. For the rtPS
and nrtPS the flows are generated as variable size packets
generated periodically (each 100 milliseconds) according to the video conference and multimedia streaming models in [19]. For the UGS packets are of fixed size and periodically generated (e.g., VoIP). Finally the web browsing and file transferring protocols are modelled as asynchronous process that generate variable size packets following the models
described in [17]. The packets from each SF are buffered at
independent queues where each packet is monitorized by its
size in bits and the time it has spent at the buffer. A maximum
BER BERmax < 10−6 after channel coding is required from
all the service classes. In this case, the minimum effective
SNR per MCS with the mandatory punctured convolutional
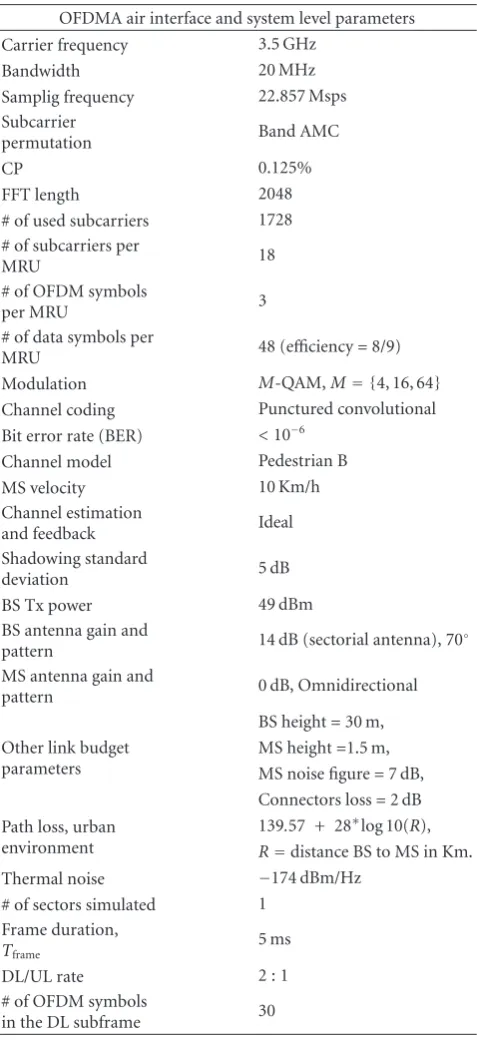
Table3: System parameters.
OFDMA air interface and system level parameters
Carrier frequency 3.5 GHz
Bandwidth 20 MHz
Samplig frequency 22.857 Msps
Subcarrier
permutation Band AMC
CP 0.125%
FFT length 2048
# of used subcarriers 1728
# of subcarriers per
MRU 18
# of OFDM symbols
per MRU 3
# of data symbols per
MRU 48 (efficiency=8/9)
Modulation M-QAM,M= {4, 16, 64}
Channel coding Punctured convolutional
Bit error rate (BER) <10−6
Channel model Pedestrian B
MS velocity 10 Km/h
Channel estimation
and feedback Ideal
Shadowing standard
deviation 5 dB
BS Tx power 49 dBm
BS antenna gain and
pattern 14 dB (sectorial antenna), 70
◦
MS antenna gain and
pattern 0 dB, Omnidirectional
Other link budget parameters
BS height=30 m, MS height=1.5 m, MS noise figure=7 dB, Connectors loss=2 dB Path loss, urban
environment
139.57 + 28∗log 10(R),
R=distance BS to MS in Km.
Thermal noise −174 dBm/Hz
# of sectors simulated 1
Frame duration,
Tframe 5 ms
DL/UL rate 2 : 1
# of OFDM symbols
in the DL subframe 30
coding defined in the IEEE 802.16e standard [2] (constraint length 7 and native code rate 1/2) are the following: [7, 8.7, 9.6, 11.2] for QPSK, [13.9, 15.6, 16.6, 18] for 16QAM, and [20, 21.7, 22.7, 24.3] for 64QAM with coding rates of 1/2,
2/3, 3/4, and 5/6, respectively. To obtain the effective SNR
the channel values inside each subchannel are merged by the harmonic mean which despite of being a very simple mean calculation form independent of the modulation and coding,
First, the performance of the proposed TSPS prioritiza-tion funcprioritiza-tion is evaluated and compared to the PFS and the
b2PFS prioritization functions by means of the cumulative
density function (cdf) of the delay from the delivered packets
(P(τi,p < τ)) (see [17] for more information on the measurement procedure). The allocation algorithm follows
the one proposed inSection 3 withPburst = {10}. For the
PFS and b2PFS scheduling functions, the number of bits per
framebithat should be transmitted is equal to the number of
buffered bits (bi=Li(t)). The latency scale for both the PFS
and the b2PFS is fixed to 10 frames (i.e.,α=10).
Then, the packet delay statistics obtained with the
different scheduling functions in case of nrtPS traffic are
depicted inFigure 5, where the number of MSs within the
cell is K = 15. The traffic from all the users is modelled
according to [19] as VBR streams with an average data rate of 2 Mbps (an average system throughput of 30 Mbps is then required). The maximum allowed delay per packet is 300 milliseconds. The 99th percentile of the delivered packets delay measured using each prioritization function is 275 milliseconds for TSPS, 535 milliseconds for PFS,
and 530 milliseconds for the b2PFS. Nevertheless, for the
TSPS scheduler the improvement due to the urgency factor (Purgency) is clearly appreciated since the slope of thecdf is
changed for delays higher than the value τmax−Δτ, where
the guard time was fixed toΔτ = 0.2×τmax. Furthermore,
we can also observe that the maximum delay of the b2PFS
scheme is much lower than for the PFS. This difference in
performance comes from the fact that the b2PFS considers
the states of the buffers, thus when a large packet is received
the priority for that queue is increased until all the buffers
have similar number of queued bits. On the other hand, the PFS is designed to balance the throughput from all the users during short periods of time. Using the same configuration
withK =15 and the same average bit rate equal to 2 Mbps,
we have observed that for CBR traffic, the 99th percentile
is obtained at 55 milliseconds, 100 milliseconds, and 125
milliseconds for TSPS, PFS, and b2PFS, respectively, giving
the b2PFS scheme better performance than the PFS for VBR
traffic as it was expected.
In case of rtPS traffic, each user stream is modelled
also as a VBR with an average bit rate of 380 Kbps. For
thertPS traffic, in case of having a packet not transmitted
within the maximum delay, the packet is deleted from the queue and discarded. For this case, two parameters have been analyzed: the delivered packets’ delay statistics and the packet loss rate (i.e., number of delivered packets divided by the
number of queued packets). Figure 6shows thecdf of the
packet delay for this scenario having 50 and 100 users. As
it is shown in Figure 5, for K = 50 all the prioritization
schemes achieve a delay lower than the maximum (τmax=50
milliseconds); in fact, the 99th percentile measured overτi,p
is 25 milliseconds for TSPS and PFS, and 15 milliseconds for
the b2PFS. Furthermore, the packet loss rate for each scheme
is 0% for the TSPS, 1.6·10−3% for the PFS, and 1.6·10−4%
for the b2PFS. In case K = 100, it can be observed that
the PFS is the only one that achieves lower packet delays, whereas the TSPS sent most of the packets when the urgency
factor was active (the urgency factor is applied whenτi,p ≥
Non-real time traffic, VBR
0.75 Packet delay,τ(s)
TSPS PFS b2PFS
Figure 5: Cumulative density function of the packet delay for nonreal-time traffic andK=15 users. Packet delay,τ(s)
TSPS,K=50
Figure6: Cumulative density function of the packet delay for real-time traffic andK= {50, 100}users.
τmax−Δτ =0.04 s).ForK =100, the packet loss rate for
each scheduling function is 8.98%, 33.4%, and 16.97% for
the TSPS, the PFS, and the b2PFS, respectively. Note that for
the TSPS although most of the packets are sent when they are nearly to expire, it achieves a lower packet loss rate.
So, despite the TSPS initially implies an increase on the computational complexity since it requires more
infor-mation about the buffers status (i.e., each packet must be
Mixed traffic Packet delay,τ(s)
nrtPS,τmax=300 ms
rtPS,τmax=50 ms
WWW,τmax=60 s
FTP,τmax=90 s
UGS,τmax=75 ms
Figure7: Cumulative density function of the packet delay for mixed traffic obtained with the TSPS scheduling function andK = 50 users.
Moreover, there is no necessity to update the priorities each time an MRU is allocated; thus, the computational complexity is also drastically reduced compared to the PFS
and the b2PFS. Another advantage from the TSPS is that
it can easily manage different traffic types by applying
different maximum delay bounds to each stream. InFigure 7
the performance of the TSPS over heterogeneous traffics is
shown. In this scenario K = 50 where 10 users require
nrtPS, 13 users requirertPS, 10 users are browsing internet
files (World Wide Web (www)service), 5 are downloading
files according with the file transfer protocol (FTP), and 12 users demand UGS connections for applications such as Voice over IP. The total measured downlink throughput is 26.54 Mbps, and the maximum delay for each service is based
on what is indicated inTable 2. For the wwwand the FTP
services, despite there is no delay restriction (i.e.,τmax= ∞),
a maximum delay of τmax = 60 seconds and τmax = 90
seconds has been assumed for both services, respectively; thus, the performance of each can be better appreciated. It
is clearly depicted inFigure 7that each traffic type achieves a
maximum packet delay lower than the maximum tolerated. The 99th percentile for the delay sensitive applications is at 95 milliseconds, 25 milliseconds, and 15 milliseconds for thenrtPS, thertPS,and the UGS, respectively. Note that the
UGS achieves lower delay than that obtained forrtPSdespite
having a higher packet delay value. This is justified by the fact that the packets of the UGS service are much smaller
than those from thertPS; thus, fragmentation is not applied
in most cases.
Having illustrated the advantages of the proposed TSPS prioritization function, the following figures depict the performance of the authors’ proposed resource allocation
algorithm described in Figure 4. In Figure 8, the statistics
Non-real time traffic, VBR
10−4
Number of bursts per frame,B Pburst=0
Pburst=1 Pburst=5
Pburst=10 Pburst=100
Figure8: Probability density function of the number of bursts per frame fornrtPS,K=15 users and different values of thePburstfactor (when the TSPS prioritization function is applied).
(by means of the probability density function (pdf)) related
with the number of bursts per frame following the proposed algorithm are shown. The considered scenario is formed by
K = 15 users, each requiringnrtPSservices. The number
of bursts per frame is here analyzed as a function of the Pburst factor having valuesPburst = {0, 1, 5, 10, 100}. The
prioritization function within the proposed TSPS is here
applied. In case Pburst = 0, the algorithm considers that
each new allocated MRU is a new burst. Thus this is the maximum granularity case, but clearly in this extreme case
the signalling is unaffordable. It can be observed inFigure 8,
how forPburst > 0, the algorithm starts to merge the MRUs
into bursts. For Pburst = 1, during the allocation of each
MRU, half of them are allocated to an existing burst (both new bursts and existing bursts have the same priority). It
is observed that the number of bursts forPburst = 1 is still
unaffordable in terms of required signalling. However, it is
shown that for Pburst ≥ 5 the number of bursts is lower
than 60 for all the simulated frames. Furthermore, in case Pburst = 5, the achieved number of bursts per frame is
lower than 24 in 99% of the transmitted frames, which can be considered as a very encouraging result. Furthermore, a soft limiter can be included to the algorithm to limit the maximum number of bursts per frame up to 20 without too
much affecting the spectral efficiency. Therefore, assuming
that approximately 60 bits are required for signaling each burst [2] and using a QPSK modulation with a code rate 1/3, the downlink signaling zone (i.e., the DL-MAP) would span less than 2 OFDM symbols. Hence, the loss due to the downlink signaling is 6.66% for the downlink mode when having a total of 30 OFDM symbols per subframe.
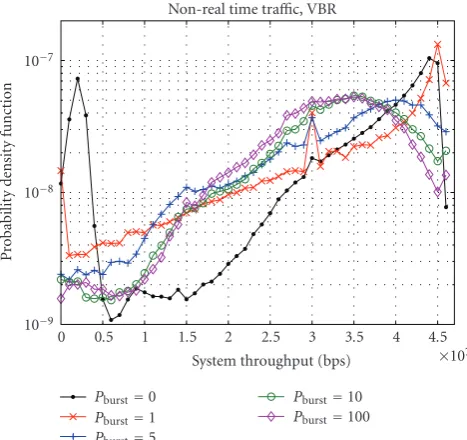
On the other hand, the spectral efficiency obtained by
Non-real time traffic, VBR
10−9
10−8
10−7
P
robabilit
y
d
ensit
y
function
0 0.5 1 1.5 2 2.5 3 3.5 4 4.5
×107
System throughput (bps)
Pburst=0 Pburst=1 Pburst=5
Pburst=10 Pburst=100
Figure9: Probability density function of the system throughput for
nrtPS,K =15 users and different values of thePburstfactor (when the TSPS prioritization function is applied).
Figure 9 as a function of the Pburst factor. The simulated
scenario is exactly the same as in Figure 8. It is clear that
as Pburst increases the spectral efficiency decreases. In case
Pburst = 0, two main behaviors are observed. First, almost
the frames sent with a very high spectral efficiency achieve
the maximum throughput which is approximately 46 Mbps; however, it can be observed that many frames have been sent
quite unfilled due to the lack of buffered bits leading to a
low system throughput (peak on the left side of the figure). Furthermore, when computing the 99th percentile of the
packet delay for eachPburstvalue, the following delay values
have been obtained {160, 185, 250, 275, 725} (millisecond)
forPburst= {0, 1, 5, 10, 100}, respectively. Clearly, joining
these results with those obtained in Figure 8, it can be
concluded that having Pburst = 5 offers the best trade
off between granularity (i.e., spectral efficiency), required
signalling, and the required QoS.
5. Conclusions
In this paper, a new scheduling prioritization function is proposed as well as a continuous frequency and time resource allocation scheme for OFDMA systems (following the data packing standardized in the IEEE 802.16e) which can be applied with both subcarrier permutation schemes (contiguous or distributed). Moreover, the proposed time stamped packet scheduling (TSPS) scheme has shown to
handle sensitive delay applications (i.e., rtPS and nrtPS)
while obtaining high spectral efficiencies (multiuser diversity
and frequency scheduling are exploited). Actually, a 50% reduction of the 99th percentile from the delivered packets delay and 30% of the packet loss rate (compared to
the PFS function) is achieved in case of nrtPS and rtPS
streams, respectively. On the other hand, the proposed resource allocation algorithm, which packs users’ data into rectangles based on iterative bursts increments, gives an important reduction on the number of required bursts per frame. According to the simulations carried out, it is concluded that if the priority associated to increasing an existing burst is five times that of generating new bursts
(i.e., Pburst = 5), a signaling loss lower than 10% can
be achieved without sacrificing spectral efficiency. Finally,
another advantage from the proposed resource allocation algorithm that has been observed during simulations is its lower computational complexity compared to the case where each MRU is independently evaluated. Actually, since in many cases several MRUs might be allocated in a single iteration, the number of required iterations is reduced as the number of bursts per frame is decreased.
Acknowledgment
This work was partially supported by the European ICT-2008-211887 project PHYDYAS.
References
[1] Recommendation ITU-R M.1645, “Framework and overall objectives of the future development of IMT-2000 and systems beyond IMT-2000,” June 2003.
[2] IEEE 802.16e-2005, “IEEE standard for local and metropolitan area networks—part 16: air interface for fixed and mobile broadband wireless access systems, amendment 2: physical and medium access control layers for combined fixed and mobile operation in licensed bands and corrigendum 1,” February 2006.
[3] V. Seba and B. Modlic, “Multiple access techniques for future generation mobile networks,” inProceedings of the 47th International Symposium Electronics in Marine (ELMAR ’05), pp. 339–344, Zadar, Croatia, June 2005.
[4] J. Moon, J.-Y. Ko, and Y.-H. Lee, “A framework design for the next-generation radio access system,”IEEE Journal on Selected Areas in Communications, vol. 24, no. 3, pp. 554–564, 2006. [5] V. Bharghavan, S. Lu, and T. Nandagopal, “Fair queuing
in wireless networks: issues and approaches,”IEEE Personal Communications, vol. 6, no. 1, pp. 44–53, 1999.
[6] H. J. Kushner and P. A. Whiting, “Convergence of proportional-fair sharing algorithms under general conditions,”IEEE Transactions on Wireless Communications, vol. 3, no. 4, pp. 1250–1259, 2004.
[7] H. Kim and Y. Han, “A proportional fair scheduling for multicarrier transmission systems,” IEEE Communications Letters, vol. 9, no. 3, pp. 210–212, 2005.
[8] B. Classon, K. Baum, V. Nangia, et al., “Overview of UMTS air-interface evolution,” inProceedings of the 64th IEEE Vehicular Technology Conference (VTC ’06), pp. 1–5, Montreal, Canada, September 2006.
[9] Q. Liu, X. Wang, and G. B. Giannakis, “A cross-layer scheduling algorithm with QoS support in wireless networks,”
IEEE Transactions on Vehicular Technology, vol. 55, no. 3, pp. 839–847, 2006.
Networking Conference (WCNC ’07), pp. 1865–1870, Hong Kong, March 2007.
[11] S. S. Jeong, D. G. Jeong, and W. S. Jeon, “Cross-layer design of packet scheduling and resource allocation in OFDMA wireless multimedia networks,” inProceedings of the 63rd IEEE Vehicular Technology Conference (VTC ’06), vol. 1, pp. 309– 313, Melbourne, Australia, May 2006.
[12] Y. Ben-Shimol, I. Kitroser, and Y. Dinitz, “Two-dimensional mapping for wireless OFDMA systems,”IEEE Transactions on Broadcasting, vol. 52, no. 3, pp. 388–396, 2006.
[13] A. Erta, C. Cicconetti, and L. Lenzini, “A downlink data region allocation algorithm for IEEE 802.16e OFDMA,” in
Proceedings of the 6th International Conference on Information, Communications and Signal Processing (ICICS ’07), pp. 1–5, Singapore, December 2007.
[14] C. Desset, E. B. de Lima Filho, and G. Lenoir, “WiMAX down-link OFDMA burst placement for optimized receiver duty-cycling,” inProceedings of the IEEE International Conference on Communications (ICC ’07), pp. 5149–5154, Glasgow, Scotland, June 2007.
[15] J. Andrews, A. Ghosh, and R. Muhammed, Fundamentals of WiMAX, Understanding Broadband Wireless Networking, Prentice-Hall, Englewood Cliffs, NJ, USA, 2007.
[16] A. Mourad,On the system level performance of MC-CDMA sys-tems in the downlink, Ph.D. thesis, Ecole Nationale Sup´erieure des T´el´ecommunications de Bretagne, Brest, France, June 2006.
[17] IEEE 802.16m-07/002r4, “TGm System Requirements Docu-ment (SRD),” October 2007.
[18] M. O. Hasna and M.-S. Alouini, “Application of the harmonic mean statistics to the end-to-end performance of transmission systems with relays,” in Proceedings of the IEEE Global Telecommunications Conference (GLOBECOM ’02), vol. 2, pp. 1310–1314, Taipei, Taiwan, November 2002.