University of Twente Faculty of Engineering Technology Department of Mechanical Engineering
Laboratory of Mechanical Automation
INFLUENCE OF AIRFLOW ON WELD DEPTH OBTAINED WITH FIBER LASER
By
Jetro K. Pocorni (s1068210)
Internship report executed from 30 August to 30 November 2011
Company : AWL-Techniek B.V.
1
Preface
In the second year of the master programme in mechanical engineering at the University of Twente, students are given the opportunity to apply their knowledge in a company or at a research institute. The internship should prepare students for their future employment as leaders within an organization. Special thanks goes to dr.ir. Gert-Willem Römer and ir. Wouter Zweers for their cooperation during this internship.
2
Abstract
During fiber Laser welding at power levels between 4-6 kW, a deeper weld was obtained if air was blown above the weld. Previous research showed that air blows away a tall heated zone above the weld. This heated zone has a low refractive index, and defocuses the Laser beam.
In this report the weld depth was measured as a function of different air velocities ranging from 0-35 m/s; the corresponding air consumption was also noted. The measurements were done by positioning a nozzle at various heights. Also, multiple nozzles were stacked above each other to form a tall air profile. Air was blown perpendicular and parallel to (opposite to and in the same direction as) the weld direction.
The weld depths increased up to 2 mm while air was blown above the weld.
The application of air enables deeper welds while maintaining the same Laser power. Thus, for a deeper weld, the weld speed can be increased and productivity improved.
3
Nomenclature
dmax : Maximum weld depth
d0 : Weld depth at zero air velocity
d : Weld depth
Do : Diameter of transport fiber Ffocusing lens : Focus length of focusing lens Fcollimator : Focus length of collimator h : Height of nozzle above test piece
P : Laser power
Vair : Air speed above weld VLaser : Weld speed
qair : Volumetric flow rate (air consumption)
9 If the fan is turned on, the plume height is lower, and the low refractive index zone decreases in size and shifts to the right in the direction of the blowing fan. So, the Laser beam is able to reach the test piece surface with fewer interruptions.
Figure 7 Plume, fringe patterns and weld appearances at different instances of time (fan turned on) [3]. Welding parameters given in Table 1.
This low refractive index zone defocuses and refracts the fiber Laser beam and has been proven to be transmissive: In [2], the brightness of the probe Laser is also investigated; the brightness does not decrease after going through the atmosphere above the weld pool, so the atmosphere consisting of the low refractive index zone and the plume, does not absorb radiation energy. This is an expected result because of the coefficient of inverse Bremsstrahlung absorption. Thus, the fiber Laser radiation is merely defocused and refracted.
Rayleigh scattering is also considered the cause of refraction of the Laser beam [4].
Figure 8 shows the distribution of the refractive index of air along the beam axis. The refractive index is smallest at the center of the beam (Radius= 0 mm), and decreases with height.
If the power density distribution of the Laser beam is Gaussian, the beam will refract most where its intensity is highest.
10
2.2
Concluding remarks and prospect on experiments
The following conclusions and prospects follow from literature research:
- The research done in [2, 3] indicates that the low refractive index zone is the leading cause for attenuation of the Laser power density reaching the test piece surface. This result is somewhat surprising, and has just recently been published. Heating of the air during welding is actually an expected result, but its significant effect on the weld is quite peculiar. Research on the low refractive index zone was first published in 2008.
- The background information provided in this section proves that the atmosphere above the weld pool must be kept fresh in order to obtain deeper welds.
- Since the height of the low reflective index zone can be tall, experiments must be done by placing an air nozzle at different heights.
- Also, a set of nozzles will be aligned above each other to blow air along the whole height between the Laser optical head and test piece surface.
- The low refractive index zone is a localized zone, so it is not required to blow air throughout the whole cell.
- In [2] and [3] experiments are done with an air velocity of 5 m/s, as a guideline the experiments in this report started at low velocities around 1 m/s.
12 A 6 kW Ytterbium fiber Laser (IPG YLS 6000, Appendix 2.5) was used with a 200 µm diameter transport fiber. A Precitec optical focusing head consisting of a collimator with a focus length of 150 mm and a focusing lens with a focus of 485 mm, focused the Laser radiation on the test piece.
Thus, the spot diameter on the test piece equaled:
(3.1)
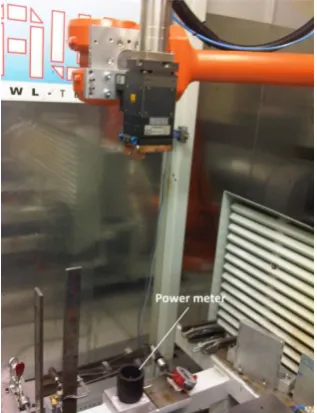
All measurements in this report were done in focus. Figure 10 displays the optical head and the industrial robot.
Figure 10 The optical head and industrial robot.
The optical head was connected to a 6 axis ABB IRB 4600 robot which enabled movement of the optical head.
Before each experiment, the power of the Laser radiation out of the optical head was measured using a Laser power meter (Primes PocketMonitor 70 icu). In Figure 11 the power meter is displayed. The accuracy of the power meter was ± 4% of the measured value (Appendix 2.6).
14
3.2
Setup with an array of nozzles
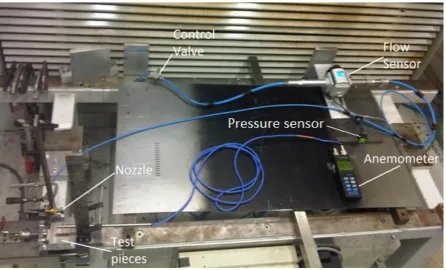
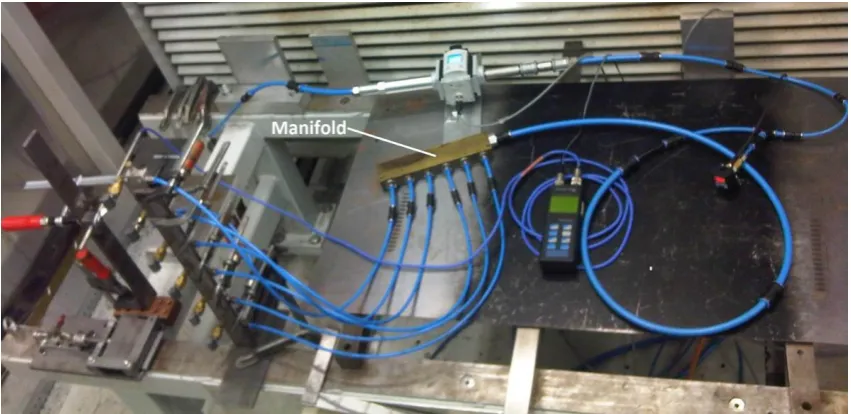
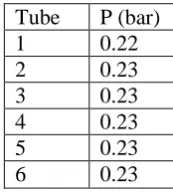
Six nozzles were placed above each other to blow the low refractive index zone away. An amount of six nozzles was chosen because of the availability of stock nozzles within AWL. The same stands, as in the one nozzle case, were used. The nozzles were fastened to the stand with clamp tools, as is displayed in Figure 15. The other stand was used to support the anemometer sensor. The full setup is displayed in Figure 14. Each nozzle received compressed air by using a manifold. An experiment was also done to find out if an equal amount of air was fed to each nozzle by the manifold.
Figure 14 Experimental setup with six nozzles.
Because of the geometry of the clamp table and the height of the stand (Figure 15), the nozzles were placed at 80 mm center to center distance above each other. Each nozzle has a height of 24 mm. The total height that was kept fresh with air, including the height of the nozzles, equaled 424 mm while the focus was 485 mm. Thus, only 61 mm was not kept fresh. The largest portion of this 61 mm consisted of a safety margin that should prevent collision with the optical head.
17 Figure 18 shows that the positioning of the nozzle right above the test pieces (h = 0 mm) gives the worst results regarding the weld depth. This is expected since the blowing air interacts with the melt pool.
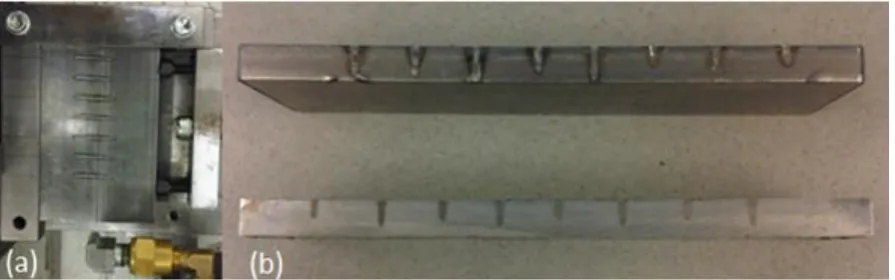
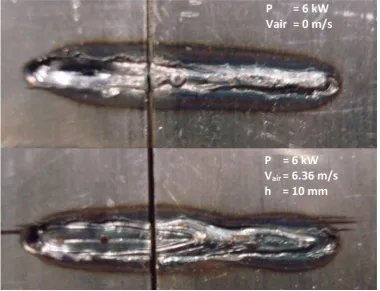
An example of the influence air has on the appearance of the melt pool is given in Figure 19 i.e. the upper weld displays a melt pool obtained at zero air velocity while the lower weld displays a melt pool obtained with blowing air. The upper melt pool has sharp edges while the lower melt pool has ripples, and the edges of the melt pool are rounded off.
Figure 19 Influence of air on weld pool. Both welds were created by welding from right to left; the airflow was also blown form right to left using one nozzle.
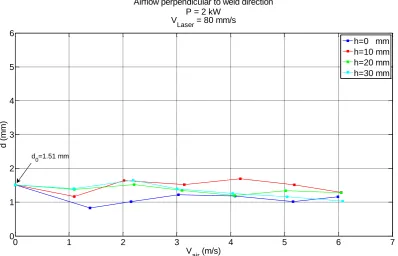
Figure 18 also indicates that the blowing air does not increase the weld depth significantly at low Laser power and low air velocity i.e. the depth seems to have a constant trend. Other experiments at 2 kW, such as varying the air direction, were halted in order to proceed at higher Laser power i.e. 4 kW. The results at 4 kW are displayed in Figure 20, Figure 21 and Figure 22. Each figure depicts a case in which air is blown perpendicular, opposite and in the same direction as the weld direction.
25
4.4
Longitudinal section of welds
The weld depth in this report is continually measured in the cross (transverse) section, but additional insight is gained when viewing the longitudinal section of the weld. Particularly, the scattered weld depths in Figure 23 and Figure 25 (between 0-6 m/s) was investigated by viewing the longitudinal section.
Figure 30 and Figure 31 each display two welds above each other i.e. the upper weld was obtained at zero air velocity and the lower weld was obtained by blowing air at approximately Vair ≈ 31.8 m/s and 190 l/min with one nozzle at a height of 10 mm.
Figure 30 Longitudinal section of welds with length of 20 mm and obtained at 4 kW. Upper weld is obtained at Vair=0 m/s and the lower weld is obtained at Vair ≈ 31.8 m/s and q = 190 l/min with one nozzle. (Both welds are
displayed on the same scale)
Figure 31 Longitudinal section of welds with length of 20 mm and obtained at 6 kW. Upper weld was obtained at Vair=0 m/s and the lower weld was obtained at Vair ≈ 31.8 m/s and q = 190 l/min. (Both welds are displayed on
the same scale)
V
air= 0 m/s
V
air≈ 31.8 m/s
V
air= 0 m/s
26 The fluctuating weld depth in above figures is thought to be the cause of the scattered measurements in Figure 23 and Figure 25.
The welds at zero air velocity are relatively constant at first, and then start to decrease in depth. This is the case for both 4 and 6 kW. Defocusing and refraction of the Laser beam by heated air is assumed to be the cause. At the start of the weld surrounding air is not heated much, so there is little effect from this heated zone. But as the weld progresses to the right, the air above the weld is heated enough to defocus and refract the Laser beam considerably and affect the weld depth.
In each of the below figures the maximal and minimal depth belonging to the longitudinal sections are displayed.
Figure 32 Weld depths at 4 kW belonging to Figure 30.
Figure 33 Weld depths at 6 kW belonging Figure 31.
V
air= 0 m/s
V
air≈ 31.8 m/s
V
air= 0 m/s
27 At 4kW the weld depth decreases a little when air is blown, but the depth increases as the weld progressed to the right.
At 6 kW the weld depth increased over the entire length when air was blown. Especially at the end of the weld, the increase in depth is significant when compared to the zero air velocity case.
This effect was also proven in literature [2, 3], as is displayed in Figure 3 and Figure 4. Future research with longer welds and longitudinal sections should give more insight into the depth increase while blowing air.
The experimental setup, as displayed in Figure 9 and Figure 14, had to be dismantled and constructed again quite frequently because of usage of the test cell by others.
30
References
[1] Mark Faerber, Joe Berkmanns, and Wolfgang Danzer. Welding with air shielding. In
Industrial Laser Solutions for Manufacturing.
[2] Shinpei Oiwa, Yosuke Kawahito, and Seiji Katayama. Plume behavior and refractive index distribution during Laser welding. In Proceedings of LAMP2009 - the 5th International Congress on Laser Advanced Materials Processing.
[3] Shinpei Oiwa, Yosuke Kawahito, and Seiji Katayama. Optical properties of Laser-induced plume during high power Laser welding. In ICALEO 2009, paper #708.
[4] P.Yu. Shcheglov, S.A. Uspenskiy, A.V. Gumenyuk, V.N. Petrovskiy, M. Rethmeier, and V.M. Yermachenko. Plume attenuation of Laser radiation during high power fiber Laser welding. In Laser Physics Letters 8, No. 6, pages 475–480, 2011.
[5] Interferometry. http://en.wikipedia.org/wiki/Interferometry
[6] W.W. Duley. Laser welding. John Wiley & sons, Inc., Canada, 1999.
[7] Scattering. http://en.wikipedia.org/wiki/Scattering
[8] Fringe pattern. http://en.wikipedia.org/wiki/Fringe_shift
32
Appendix 2 Measurement devices
Below table displays the used measurement devices.
Device Type
Control valve Festo GR-Q5-0
Flow Sensor Festo SFAM-62-5000L-TG12-25V-M12
Pressure Sensor Festo SPAB-P10R-G18-2P-M8
Air Nozzle Silvent 961
Fiber Laser IPG YLS 6000
Laser Power Meter Primes PocketMonitor 70icu
Microscope Novex RZT SF 65.560
Anemometer Höntzsch HTA
39 Appendix 2.7 Microscope
Microscope: Novex trinocular zoom sterio microscope RZT SF 65.560 CMEX DC 5000
Colour USB2 Camera Serial# 5219
44
Appendix 3 Cross sections of welds
47 Cross sections at increasing air velocity at 4 kW. Air was blown using six nozzles in same direction as the weld direction. See Figure 27 for the d vs. Vair plot.
Vair= 3.2582 m/s Vair= 3.9700 m/s
Vair= 4.5264 m/s Vair= 5.0000 m/s
48 Cross sections at increasing air velocity at 6 kW. Air was blown using one nozzle in same direction as the weld direction. See Figure 25 for the d vs. Vair plot.
Vair = 1.06 m/s
Vair = 2.27 m/s
49 Vair = 3.85 m/s
Vair = 4.99 m/s
50 Vair = 9.9 m/s
Vair = 19.73 m/s
51 Vair = 32.25 m/s
55
Appendix 5 Matlab code
File 1: depth_at_zero_air_velocity.M
%% Mean depth at zero air velocity
% The first 5 elements of the array are for 'oppossite direction' case, % the following 5 are for the 'same direction' case. And the last 4 elements
% are for 'perpendicular' case.
% For 4 kW the following experiments were used:
% experiment_2011_10_20_and_21_and_26_and_27. Also experiment 2011-11-8-3_5 % experiment 2011-11-8-3_5_7
d=[2.3;2.08;2.1;2.58;1.87;2.82;2.55;1.93;1.98;2.25;2.12;1.86;2.22;1.32]; d_average_4_kW=mean(d)
% For 6 kW the following experiments were used:
% 2011_11_8_3_6, 2011_11_8_3_8, 2011_11_10_2_9 and 2011_11_10_3_8 d=[3.05;3.44;2.76;3.41];
60 % 2011_11_7_1 for 20-30 m/s
d =
[3.165;3.37;2.49;2.61;3.6;4.01;3.05;4.96;4.88;5.22;4.81;5.02];
V_measured = [0;1.06;2.27;3;3.85;4.99;6.36;9.9;19.73;25.67;32.25;35.94];
[c4,gof4] = fit(V_measured(1:8),d(1:8),'poly1')
[c5,gof5] = fit(V_measured(9:12),d(9:12),'poly1')
plot(V_measured,d,'ro','MarkerFaceColor','r');hold on;plot(c4,'r');hold on;
plot(c5,'r');
ylim([0 6])
xlabel('V_{air} (m/s)');ylabel('d (mm)');
legend(' Opposite direction',' Linear fit \newline R^2=0.7681',' Same
direction',' Linear fit Sloping line \newline R^2=0.4868',' Linear fit Flat
line \newline R^2=0.0013');
title({'Airflow parallel to weld direction using 1 nozzle';'P = 6
![Table 1 Experiment specifications [2].](https://thumb-us.123doks.com/thumbv2/123dok_us/1054730.1131810/7.595.300.529.596.676/table-experiment-specifications.webp)
![Figure 6 Plume, fringe patterns and weld appearances at different instances of time ( fan turned off) [3]](https://thumb-us.123doks.com/thumbv2/123dok_us/1054730.1131810/9.595.166.431.562.726/figure-plume-fringe-patterns-appearances-different-instances-turned.webp)
![Figure 7 Plume, fringe patterns and weld appearances at different instances of time (fan turned on) [3]](https://thumb-us.123doks.com/thumbv2/123dok_us/1054730.1131810/10.595.145.454.129.321/figure-plume-fringe-patterns-appearances-different-instances-turned.webp)