Testing scenarios in a Simulation Model of the
Emergency Department
Jan-willem Pezij
Student number: 0045691
Bachelor program in Industrial Engineering & Management
Tutor: J.J. Krabbendam
Tutor: R.W. Rosmulder
Table of contents
Preface………. 2
Abstract………... 3
Introduction………. 4
Methods………... 6
Descrition of the ED………. 6
Acedemic Medical Centre………. 6
Emergency Department……… 6
Description of the simulation model………. 8
Theories………... 10
Lean Thinking………... 10
Factory Physics………. 10
Scenarios………... 13
Scenario 1: A constant arrival of patients………... 13
Scenario 2: A constant radiology time………. 14
Scenario 3: Introducing a triage nurse who wil start with supplementary diagnostics if needed……… 14
Scenario 4: Urgent categories……….. 16
Scenario 5: General practitioner……….. 16
Scenario 6: Combining scenario 3, 4 and 5………. 16
Results………..17
Scenario 1: A constant arrival of patients………... 17
Scenario 2: A constant radiology time……….17
Scenario 3: Introducing a triage nurse who wil start with supplementary diagnostics if needed……… 18
Scenario 4: Urgent categories……….. 19
Scenario 5: General practitioner……….. 19
Scenario 6: Combining scenario 3, 4 and 5………. 20
Discussion……… 21
Preface
This thesis is the conclusion of my bachelor study Industrial Engineering and Management at the University of Twente in Enschede, the Netherlands. It concerns a research at the
Emergency Department of the Academic Medical Centre in Amsterdam. From September I could make use of staff experience by walking along with ED-nurses and participating in staff meetings. These meetings didn’t only help me in my research but also showed me how implementing process changes work in a hospital.
Hereby, I would like to thank all these people and Jan Luitse, Nicole ten Grotenhuis, Eric Schinkel and Rob Kohlinger in particular, for sharing their experiences with me and providing me with useful directions for this research.
I would like to thank Remco Rosmulder for helping and coaching me during my research, he inspired me to make this report to what it is now. Without his advice and support this report would not have been realised. I also want to thank Koos Krabbendam for his help and advice and Jan Luitse for the interesting conversations and his indirect supervision. Additionally, Martijn Mes for sharing his knowledge on EMplant and Jacqueline van Schuppen for allowing me to use her simulation model.
Finally I want to thank my family and Marjolein, who helped me and supported me during this research.
Enschede, 3 April 2007
Abstract
The process at the emergency department is complex. Every patient that arrives at the
emergency department comes unexpectedly and follows a unique and changeable trajectory of care events. It is very difficult to analyze and improve such a complex process. One way of understanding and improving the process of the emergency department without actually changing the real life system is simulation. In this research simulation was used to design scenarios with help of theory and practice. From practice we designed scenarios who support the redesign of the process at the emergency department in Amsterdam. Scenarios designed through meetings with working staff are implemented into an excisting simulation model of the emergency department of Amsterdam. At the emergency department in Amsterdam a new working method will be introduced consisting of a triage-nurse. The purpose of this new method is to improve the patient flow and thus increase patient satisfaction through the reduction of length of stay. Simulation can support the introduction of this new method. Simulating a triage nurse who can initiate direct supplementary diagnostics showed really promising results. There was an reduce in length of stay of 25%. Furthermore with help of the theories ‘Lean Thinking’ and ‘Factory Physics’ scenarios were developed to better understand the process and validate the excisting simulation model. ‘Factory Physics’ states variability is a great cause of waiting times. A researcher investigated if scheduling arrivals in an emergency department would be beneficial [Rosmulder, 2005]. It is interesting to see the influence of the variability of the arrival process and if further research in that area is
worthwhile. Furthermore the model will be validated by looking at the radiology time. Former research of the laboratory times showed it made no difference if a better suited distribution was programmed [te Poele, 2005]. We investigated the radiology time and looked what kind of influence changing the distribution has on the length of stay.
Introduction
The Emergency Department (ED) is a department that provides initial treatment to patients with a broad variety of illnesses and injuries, some of which can be life-threatening and require immediate attention. Many hospital EDs are overcrowded and short-staffed, with a limited capacity to treat patients[Derlet, Richards, & Kravitz, 2001]. It is increasingly hard for EDs and their staff to provide the necessary level of care for medical patients [Stefan, 2006]. Because healthcare demands are increasing there is an enlarged pressure to control expenses, interest grows to find out whether healthcare organisations, including EDs, apply their organisational resources in the most effective way [Spaite et al., 2002].
A research project is carried out at the AMC to reduce the length of stay of patients. It involves a redesign of the process at the ED from the AMC. By work staff meetings a new method was created to make better use of organizational resources. This new method consists of a triage nurse who can initiate direct supplementary diagnostics. A triage-nurse assess a patient upon arrival in the ED and assigning to that patient a level of priority for care based on the seriousnes of their condition. To redesign the process at the ED organizational process changes must be carried out. Organizational process changes in the emergency department are very difficult, you can’t just test a new idea because regular care has to continue [Rosmulder, 2005]. The AMC strives to evidence based management. The choice of a new method must be based on proven effectiveness. Simulation is an effective tool to analyze process changes without actually changing the real life system. Simulation is the process of designing a model of a system and conducting experiments with this model for the purpose either of
understanding the behaviour of the system or of evaluating various strategies for the operation of the system [Shannon, 1986]. A researcher created a simulation model to describe the current process at the emergency department from the AMC [van Schuppen, 2006]. With this simulation model it is possible to estimate the performance of the emergency department. But not only were scenarios designed to support the research project at the AMC, scenarios were also designed with help of theories. ‘Factory Physics’ states variability is a great cause of waiting times. A researcher demonstrated that an ED can succeed in scheduling part of its unpredictable and variable patient demand. [Rosmulder, 2005]. This implicates the variability of the arrivals is a cause of waiting times. It is interesting to see the influence of the
variability of the arrival process and if scheduling can be used as a tool for using resources more efficiently.Furthermore the model will be validated by looking at the radiology time. Former research of the laboratory times showed the formerly used triangular distribution was indeed a misrepresentation of the laboratory times. A gamma distribution appeared to be a much better representation [te Poele, 2005]. However the difference in length of stay(LOS) was lower then expected. This research focused on the laboratory times, it interesting to see what effects can be expected and measured with changing the radiology times.
One objective of this research is to provide evidence based management for redesigning the process at the ED. Scenarios were designed according to the new method. By implementing these scenarios in an existing simulation model, the effect on length of stay can be tested. Furthermore scenarios will be designed with help of a theoretical framework. With the help of a theoretical framework we will test scenarios and compare theory with reality and see if theory is applicable in the emergency department. We use the theories 'Factory Physics' and 'Lean Thinking'. Factory Physics is used to explain the behavior of the system.
This study answers the following research questions:
• What promising scenarios can we formulate with help of theories and real life cases? • What conclusions can be drawn if we compare the simulation outcomes of the
promising scenarios in relation to what we expected?
Methods
Description of the ED
Academic Medical Centre
The Academic Medical Centre(AMC) is an aggregation of the "Binnengasthuis" and the "Wilhelmina Hospital" and the faculty of medicine of the University of Amsterdam. In 1983 the facultative laboratories and research institutes came under one roof with the new formed academic hospital. Five years later "the Emma child hospital" was also welcomed. With the AMC-child department incorporated, it now has become a complete academically pediatric centre. The facultative laboratories and research institutes of the AMC are stationed next to the academic hospital and the faculty of medicine from the University of Amsterdam, this involves the Dutch institute for brain research, the medical department of the royal institute for the tropics and the inter university Eye Care institute. These institutes of expertise make the AMC more then just an academic hospital. As an academic hospital the AMC provides education for future physicians. Students of the faculty of medicine are trained to become a physician. Characteristic for the AMC is the broad offer of specialties. Amongst the specialty departments are: anesthesiology, cardiology, surgery, dermatology, internal medicine, ear nose and throat sicknesses, child surgery, pediatrics, lung sicknesses, mouth sicknesses and jaw surgery, neurology, neurosurgery, ophthalmology, orthopaedics, plastic surgery,
psychiatry, radiotherapy, rehabilitation, rheumathology, urology, obstetrics and gynaecology. [van Schuppen, 2006][website AMC]
Number of beds: Medical Staff:
Number of patients treated at the outpatient clinic: Number of daytreatments: Figure 1 Basic Statistic of the AMC for 2005 [website AMC]
Emergency Department
The Emergency Department(ED) at the Academic Medical Centre(AMC) is open 24 hours a day. Patients arrive at emergency departments in two main ways: by emergency ambulance or walk in arrival. There are two different patient groups; referred and self referred patients. Referred patients are referred to the ED by a general practitioner. Referred patients also consist of people with an illness under treatment of a specialist, who come for an acute situation in the ED. If patients are having acute problems with their disease they contact their general practitioner. The general practitioner contacts the treating specialist and tells the patient to come to the ED. The specialist then will contact the reception of the ED the patient is coming. The referred patients are seen by ED-nurses and residents of ten different
specialties. For referred patients ten big treatment rooms are available.
In 2005 the ED in Amsterdam treated approximately 33000 patients. About 80% of them were self referred patients and 20% referred patients.
Besides referred and self referred patients, there is an important other group of patients: critical care patients. Critical care patients are patients in life threatening situations. Most often these patients are serious accident victims (trauma). Given their situation and need for fast treatment these patients go directly to the ‘trauma room’-department.
If a critical care patient is picked up by an ambulance, ambulance paramedics notify the hospital beforehand that they are transporting a severely-ill patient (on a special ‘trauma phone’). Then the ED will give the necessary specialists a trauma sign and two ED-nurses of the self referred patients will go to special trauma rooms so they will be ready when the patient arrives. When the critical care patient arrives they are rushed to the ‘trauma room’-department, where they are met by a team of specialists and ED-nurses who have the
expertise to deal with the patients conditions. Critical care patients represent about 2% of the number of patients that are seen by the ED during a year. The capacity for the self referred patients will decrease because two nurses have to assist in the special rooms. The capacity for the self referred patients won’t change.
Description of the simulation model
Simulation is an effective tool for the analysis of this kind of complex system. The result can be used to enhance the ED-operations to provide better care. [Lopez Valcarez and Perez, 1994] A researcher already programmed a simulation model of the ED of the AMC described above.[van Schuppen, 2006] This model is a description of the current situation at the ED department of the AMC for self referred patients. She collected data from doctors, nurses and of her own observations to understand and describe the system lay out and operating
procedures. With help of different sources the model parameters and input probability were defined.
The program used for modeling the ED was EM-plant, a discrete event simulation tool. Discrete-event simulation concerns modeling of a system as it evolves over time by a representation in which the state variables change instantaneously at separate points in time. In my research the system is the Emergency Department in the AMC. The state variables are patients, doctors and nurses. State variables change because the tasks and action of patients, nurses and doctors change, for example collecting a patient from the waiting room, perform anamnesis, send a patient to radiology etc. In discrete event simulation, the operation of a system is represented as a chronological sequence of events. Each event occurs at a certain point in time and may change a state in the system. An event is every task or action a patient or doctor/nurse is performing. As the system is dynamic, it is constantly changing, and because it is stochastic, there is an element of randomness in the system.[Law and Kelton, 2000]
Profile patients entrance
requirement of supplementary diagnostics
transferred to after treatment
percentage of occurrence 1 Ambulance Supplementary needed Specialist 2% 2 Ambulance Supplementary needed Departure 2% 3 Ambulance No supplementary needed Departure 2% 4 Ambulance No supplementary needed Specialist 0,1% 5 Walk-in Supplementary needed Specialist 16% 6 Walk-in Supplementary needed Departure 15% 7 Walk-in No supplementary needed Departure 60% 8 Walk-in No supplementary needed Specialist 3% Table 1 explanation of the different patient profiles
In the model one ED-doctor and one ED-nurse are available. The model starts when the patient enters the ED (at the security guard or by ambulance) and ends when the patient leaves the ED (exit the hospital or is transferred to a specialist). The lay out of the model is from the ED in the AMC (figure) and cannot be changed. The model shows the paths that the nurse, doctor and patients follow when they are moving.
Figure 2 Print screen of the simulation model of the Emergency Department of the AMC
The black line shows the different paths of the patients. First the patients arrive at the security guard. Then the patients register themselves at the reception. When the patients have
Figure 3 flow chart of the process at the AMC
If we look at the theory from Pinedo and Shao(1999) the emergency department can be seen as a job shop. In a job shop the jobs (patients) may visit a given machine (doctor or nurse) several times. In the figure 4 you see there is a re-loop from the ED-doctor to the ED-nurse. Scheduling a job shop is very difficult. In the next chapter we will introduce theories which will help to understand the ED.
Figure 4 Relations of four parallel waiting queues with the ED-doctor and ED-nurse
In case an ambulance patient arrives and the four cubicles are occupied the patient will be treated in the hallway. If a patient needs an x-ray the patient leaves the department and goes to the radiology department and the nurse will call the radiology department that a patient is coming. In case a patient needs other supplementary diagnostics, for example laboratory research of blood and urine, the patient will wait in the cubicle. Some patients need
supplementary diagnostics, some patients are referred and the other patients are leaving the ED. Another researcher investigated the laboratory process and validated the model by introducing a gamma distribution in stead of a triangular distribution for the laboratory time. This distribution was a better representation of reality.
To show the difference in outcome of several alternative system configurations performance measures were selected. With help of these performance measures we can analyze the outcome of the several scenarios which we will model.
In my research I will only use these performance measures: - Length of stay at the ED
The time between registration at the reception (walk in arrival) or arrival at the ED
(ambulance arrival) and the time a patient is dismissed from the ED. We want to reduce the length of stay. So we hope that the outcome will be lower then the current situation.
- Average occupation percentage
Theories
To improve the length of stay in the emergency department we will use theories from Factory Physics and Lean Thinking. We have to analyze the emergency department and with help of this analysis improve the length of stay. The theories ‘Lean Thinking’ and ‘Factory Physics’ are instruments to describe the process at the emergency department and show what part of the process can be improved. These theories can provide important assistance in performing a simulation study. They help interpreting results and understanding the behaviour of the system of the emergency department [Standridge, 2004].
Lean Thinking
Lean Thinking started with Toyota and was developed by Womack, Jones and Roos [1990]. It tries to provide what the customer wants, quickly, efficiently and with little waste. The term lean derives from the fact that Japanese business methods use less of everything, from human effort and capital to facilities, inventories and time. Lean Thinking is a manufacturing tool that focuses on adding value from a patients point of view and removing waste from
processes/workflows. Womack and Jones (1996) describe five key principles to achieve Lean Thinking:
- Value, first value must be specified. Value only can be defined by the patient, and it is only meaningful when expressed in terms of the medical service.
- Value stream, the value stream must be identified. The value stream identifies all those steps required to provide medical care to patients. Every step that is necessary to create value for the patient, waste must be eliminated.
- Flow, make the value creating steps flow. When these steps are introduced the length of stay will reduce.
- Pull, the patient must pull the service, offer services the patient wants, in stead of the patient being pushed through the service, often unwanted.
- Perfection, to achieve perfection means constantly considering what is being done and how it is being done and have the expertise and knowledge of all those
involved in the processes to improve and change it. [Womack and Jones, 2003] Industrial lean projects have achieved remarkable results. [Lindgaard Laursen et al., 2003]
And the hope is that applying Lean Thinking on health care may bring reductions in waiting times, free up cubicles and as a result improve patient satisfaction.
[Lindgaard Laursen et al., 2003] If we look at the application of Lean Thinking in health care, it consists of minimizing or eliminating: delay, repeated encounters, errors and inappropriate procedures. [Young et al., 2004] In other words minimizing activities that don’t create value for the patient. Lean Thinking wants to organize the process as a continuous flow. An ideal situation would be if the patient comes to the ED and doesn’t have to wait before he receives treatment but receives treatment immediately and constantly without waiting. Lean Thinking let us show the unnecessary actions that create no value and are avoidable for patients. [Womack & Jones, 2003] [Rosmulder, 2005]
Factory Physics
"Factory Physics is a systematic description of the underlying behavior of manufacturing systems". If you understand the system you can identify opportunities to improve the system. Each manufacturing environment is unique. So not every procedure works well in every condition. In an emergency department the arrival of patients is very variable. You cannot schedule the arrival of self referred patients. Buffering of variability can be done in three ways: inventory, capacity or time. Since inventory is not applicable on the ED we have to look at time (length of stay) and capacity. The length of stay is described by Little's law:
Little’s law: TH= WIP/CT
- Work In Process(WIP): the amount of patients which are present in the process. From the start of the process (when walk-in arrivals arrive at the security guard or ambulance patients arrivals arrive at the department) to the end of the process (when patients are dismissed or transferred to a specialist).
- Cycle Time(CT): Average time from when a job is released into a station or line to when it exits. The patient is released in the process when the patient arrives at the security guard or an ambulance patient is brought in. The patient exits when they are dismissed or transferred to a specialist.
The raw process time(T0) of a line is the sum of process times of each work station. In the emergency department we can define the raw process time as the average time it takes a patient to get registered, receive treatment and leave the department without having to wait behind other patients. In other words there is no waiting time in the raw process time. The bottleneck rate of a line is the rate of the workstation having the highest utilization. For the emergency department the bottleneck rate consist of the utilization of the equipment. An optimal WIP level will be achieved if there are no waiting times and the equipment is utilized as much as possible. If there are no waiting times, cycle time will be minimal; it consists of all the necessary actions that have to be done to complete the job (raw process time T0). Maximum utilization of the equipment occurs if throughput is maximum and equals the bottleneck rate rb. The following relation exist between these parameters: W0= rb * T0. An optimal WIP almost never occurs, often the WIP is above or below W0. Below or at W0 the cycle time is at a constant level (T0). Above W0, the equipment is occupied and preceding jobs have to wait. The cycle time will keep increasing.
Variability
From a system the real process time (te) is only a small part of the total cycle time. Waiting times (CTq) are a big part of the total cycle time.
In formula: CT= CTq+ te
To explain waiting times (CTq) I will use this formula:
Kingman’s (or VUT) equation:
This formula doesn't apply in every process, but this formula offers valuable insight into more complex and real systems. [Hopp & Spearman, 2000] This formula suggests that there are two factors causing queuing time: variability v and utilization u, te is the effective process time. Variability involves the so-called coefficient of variance (CV), which consists of ca² and ce². The Emergency department deals with highly unpredictable and variable patient
Utilization
The second factor that could cause queuing time is utilization. Utilization is the fraction of time a workstation is busy over the long run. Higher utilization leads to longer waiting times. [Hopp & Spearman, 2000] In cubicle occupation at the ED utilisation is an important factor. While a patient is waiting for the results of supplementary diagnostics the patient stays in the cubicle assigned to him. Physicians can’t start treatment because the results aren’t ready yet. The cubicle stays occupied and queuing can occur at the emergency department.
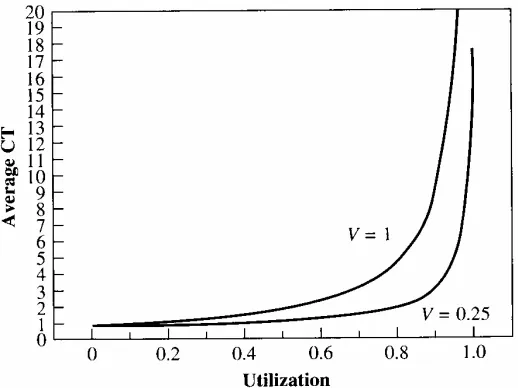
Utilization has the most dramatic effect on waiting times. The reason is that the VUT equation has a 1-u term in the denominator. As utilization approaches one, cycle time approaches infinity. Cycle time is very sensitive to utilization. If variability is higher and utilization approaches one, cycle time will sooner blow up.
Scenarios
The scenarios are defined by using the findings from meetings with working staff from the ED and with help of theories that are related to decreasing the length of stay. At the meetings with working staff the current process of the ED in Amsterdam was analyzed. This involved aspects of the current situation that could be improved. An ED-doctor and an ED-nurse came with several ideas how to improve the process at the ED and improve the cooperation between the working staff. The result is a new working method which will be described below (scenario 3, 4 and 5). Scenarios 1 and 2 are designed with help of theories.
Before we perform a simulation we have to specify the system configurations of interest to analyze the different scenarios. These configurations consist of a warm up period, the length of each run and the number of independent simulation runs. If you perform a simulation the system starts with no patients and no tasks. The first arriving patients will be treated faster than patients that arrive later on. This period is called the warm up period and should be deleted. The warm up period is determined by using a Welch procedure. A warm up period of 5 days was determined. When measuring the several scenarios we simulate ten replications of a period of 60 days at the ED.[van Schuppen, 2006]
Scenario 1: A constant arrival of patients
The variability of the arrival of patients is one of the main reasons of waiting times. Research was conducted to investigate scheduling arrivals in an Emergency Department. Research showed scheduling patients would reduce the variability of the arrivals of patients and as a result reduce the length of stay [Rosmulder et al., 2005]. It is interesting to investigate the effect of a constant arrival of patients on the length of stay. The variability of the arrival of patients will be zero as an effect the length of stay should reduce. As mentioned before the arrival rate (ca²) of patients is a very variable process; this is because you will never know when a patient comes to the ED. As said in the theory of Factory Physics, variability(v) is a cause of queuing/waiting times(CTq).
Kingman’s (or VUT) equation:
where ta² represents the mean of the inter arrival times and σa² represents the
standard deviation of these times. Because there is no variance σa²=0, thus
ca² = 02 a
t = 0.
If we model a constant arrival of patients, there will be no variability in the coefficient of variance of the arrival rate (ca²=0). A constant arrival of patients means patients arriving at a constant time. According to the theory of Factory Physics, the waiting times should reduce because the variability of the arrival process is zero. We can measure the effects by calculating ca² and ce² from the VUT equation. If we calculate ca² and ce² in the current situation, ca²= 1,31 and ce²= 0,48. ca² is calculated by putting al inter arrival times, measured and calculated by a former researcher[van Schuppen, 2005], in SPSS and determine the mean and standard deviation of these times with descriptive statistics. After this procedure the standard deviation was divided by the mean.
ce² is calculated by putting all the length of stays of the different patients in SPSS and
If we fill these figures in the variability(v) part of the VUT equation:
For the current situation ca²= 1,31 and ce²= 0,45 >
According to the theory of Factory Physics the variability for the current situation is 0,90 and the variability for the constant arrival is 0,24. This means an improvement of 73% if we program a constant arrival of patients. In the simulation model we will set the arrival time between two patients by looking at the average amount of patients visiting the ED during a day. By dividing the amount of patients by 24/hours we know the inter arrival time between two patients. In the model on average 68 people arrive each day. This means an inter arrival time of 21 minutes.
• The arrival of patients was programmed with two distributions. I replaced these distributions with a constant time. So the inter arrival time would remain constant.
Scenario 2: A constant radiology time
Former research was done looking at the distribution of the laboratory time. In the original model a triangular distribution was used. After research a gamma distribution was a better representation of reality. The coefficient of variance of the gamma distribution was higher then the coefficient of variance of the triangular distribution used in the original model.[te Poele, 2006] According to the theory of Factory Physics the LOS for patients with
supplementary diagnostics should increase. After changing the simulation model the results showed that it did not make much of a difference. There was a little increase in LOS but not as much as expected.[te Poele, 2006] With this knowledge we will set the radiology time at a constant level. The variability of the effective process time is given by:
ce²= 2
. In this formula te² represents the mean of the process times and σe² represents the
standard deviation of these times. Because there is no variance in process time σe²=0, thus ce²
= 02 e
t = 0.
With a constant time level, the CV of the effective processing of sample time (ce²=0) will be 0 and according to the theory of Factory Physics the LOS should decrease.
• The radiology time was programmed with a gamma distribution. I replaced this gamma distribution with the average radiology time.
Scenario 3: Introducing a triage-nurse who will start directly with supplementary diagnostics if needed.
meetings these points were discussed. The roles of the ED-doctor and ED-nurse were
analyzed. We discussed how the cooperation between the ED-doctor and ED0-nurse could be improved and thought of a better way to provide supplementary diagnostics to patients. This resulted in a new method which consists of introducing a triage nurse. Triage consist of assessing the patient upon arrival in the ED and assigning to that patient a level of priority for care based on the seriousness of their condition[Cheung et al., 2002]. In the new method the triage-nurse doesn’t only assign the patient to a level of priority but also initiates
supplementary diagnostics if needed.
In the new method the patient comes to the ED and subscribes himself. Before the patient is seen by a doctor he will first be examined by the triage-nurse. If the patient needs
supplementary diagnostics, the patient will receive supplementary diagnostics immediately and waits in the waiting room until the results are ready. The patient directly will receive treatment so flow is initiated at the entrance. The patient is more pulled through the system. He doesn’t have to wait until he will be treated. In this scenario the patient will receive immediate treatment by the triage-nurse and if the patient needs supplementary diagnostics he doesn’t have to wait in his cubicle until the results are ready like in the old situation. The patient will only enter a cubicle when the results of the supplementary diagnostics are ready, so unnecessary waiting time is avoided. The process looks more like a continuous flow according to Lean Thinking. According to Lean Thinking the new method will reduce the length of stay and improve patient satisfaction. The ED offers what the patient wants; immediate care without unnecessary waiting.
An advantage of introducing a triage-nurse is patients are seen as soon as they arrive, their needs for treatment are assessed. The new method is dynamic in the way that if the doctor or nurse doesn't have a task they should look for a task to do and they should guide patients through a continuing process. In the new method the roles of the ED-nurse and ED-doctor will change. The responsibility of the ED-nurse will change, because the ED-nurse is working under supervision of the ED-doctor. The responsibility will change and the work load will be more. The ED-nurse has to perform fast track and must help the triage-nurse if necessary. The role of the ED-doctor will change into the role of managing care. The triage-nurse is an extra nurse in comparison to the current situation. There are four characteristics that describe the new method:
- Action, if a patient needs treatment (after registration) it should be started immediately and the patient shouldn't go to the waiting room first. If it is clear a patient needs to be submitted, a room should be arranged for the patient.
- Dynamic, the nursing staff should help each other, especially if they don't have a task. An example is the ED-nurse helping the triage-nurse if it is busy. This will increase flexibility of the ED.
- The ED-doctor and ED-nurse are complementary; they both got their own tasks. With performing these tasks they should help and complement each other. An experiment showed that the ED-nurse and ED-doctor couldn’t work completely parallel.
- Organize the most common cases and build a safety net for unusual cases. There can be an inaccuracy in the decision process. But the safety net is the ED-doctor who will see the patient and correct inaccuracies if necessary. We think that most patients will profit from the presence of a triage-nurse, so it will beneficial for the whole department.
Scenario 4: Urgent categories
After the patient is examined by the triage-nurse the patient will receive an urgent category. There will be three categories: U1, U2 and U3. U1 is the most urgent category and this patient has to be seen in 15 minutes. U2 is less urgent and has to be seen in 30 minutes. U3 is not urgent and has to be seen in 1 hour. This will be the patients who will go home after they saw the ED-doctor. If a patient is really urgent he immediately will go to the cubicle after triage. Ambulance patients who arrive at the ED will be transported to a cubicle after the ambulance forms are delivered. The ED-nurse will perform direct supplementary diagnostics if needed.
Scenario 5: General practitioner
In the future the ED in the AMC will cooperate with general practitioners. Because of the ‘spoed post’ (general practitioners) near the ED, there will be fewer patients at the ED. The general practitioners will stay at the AMC from 17:00 until 23:00. If a patient with a minor injury comes to the ED between 17:00 and 23:00, the patient will be referred to a general practitioner. The patient will first be seen by the triage-nurse. Patient profile 7 is the group of patients who will be referred to the general practitioner. In the model patient profile 7 will leave the system between 17:00 and 23:00 after they are seen by the triage-nurse. We will see what kind of effect this change will have on the length of stay of other patients.
• The reception time was extended with the examination time of the triage-nurse. Between 17:00 and 23:00 patient profile 7 won't go the waiting room, but he will go directly to the exit.
Scenario 6: Combining scenario 3, 4 and 5
Results
Scenario 1: A constant arrival of patients
For the constant arrival we used a constant inter arrival time. We compared the outcome data concerning the length of stay with the outcome data of the current situation. Per profile the length of stay looks as follows:
*Time is presented in minutes
The total scores of all tables are weighted averages. As can be seen a constant arrival of patients has the biggest effect on walk in arrivals. Walk in arrivals have almost the same LOS as ambulance patients. Since there is no variability in the arrival of patients the LOS
decreases as the theory of Factory Physics predicted. The total improvement is close to 50%. A one sided T-test with a 95% confidence interval showed there is a significant difference between the current situation and the constant arrival because the value 0 doesn’t occur in the confidence interval. A constant arrival is between 48 and 51 minutes better then the current situation.
Scenario 2: A constant radiology time
For the constant radiology time we used 15 minutes and 32 seconds. This is the average of the gamma distribution which was used in the original simulation model. We entered a constant radiology time in the simulation model and we compared the output data concerning the length of stay with the output of the model with the gamma radiology distribution. After the simulation runs we get the following data for self referred patients.
There is almost no difference between a constant radiology time and the gamma distribution. This is almost the same result as we saw when setting the laboratory time at a constant level. A two paired T-test with a 95% confidence interval showed there is also no significant difference between the gamma distribution and the constant radiology time because the value 0 occurs in the confidence interval.
Scenario 3: Introducing a triage-nurse who will start directly with supplementary diagnostics if needed.
We will compare the data from the scenario where we ‘introduced a triage-nurse who will start direct with supplementary diagnostics if needed’ with the data from the current situation. When the implementation of the more difficult scenarios (scenario 4, 6 and 7) in the
simulation model were finished the simulation model only would run for about 30 days. A valid measure consists of 600 days. In order to still have a valid measure I runned the
scenarios 20 times and calculated the average outcome which is published in the table below.
*Time is presented in minutes
We also examined the influence of direct supplementary diagnostics on the occupation rate of the cubicles.
Current Situation
Direct supplementary
diagnostics
Improvement
Cubicle 5 Cubicle 6 Cubicle 7 Cubicle 8
66% 54% 49% 60%
51% 35% 26% 43%
23% 35% 47% 28%
The scenario of a triage-nurse consists of a second ED-nurse who performs triage on a patient. In the current situation only one ED-nurse is present in the system. To get a good comparison of the real profit in length of stay we will compare the scenario of 'a triage-nurse who will start directly with supplementary diagnostics if needed' with the scenario of the current situation with two ED-nurses. The results are presented in the table below.
*Time is presented in minutes
A one sided T-test with a 95% confidence interval showed there is a significant difference between the current situation with two nurses and starting direct supplementary diagnostics because the value 0 doesn’t occur in the confidence interval. Direct supplementary
diagnostics is between 11 and 13 minutes better then the current situation with two nurses.
Scenario 4: Urgent categories
It appeared too difficult to program this scenario in the simulation model. It was stated beforehand that large adjustment would be difficult to program and time consuming [van Schuppen, 2006][te Poele, 2006]. The model was made by another researcher which has developed the model in her way. When adjusting the model programming was really difficult, often fixing one error led to another error. Because programming errors were really difficult I asked an expert of the program EMplant to help so I could move on with programming the adjustments. The expert told me he found it difficult to work with this model too. He couldn’t help me finish the scenario. Another problem was to measure the results. It was too difficult to change the output categories. In the current model the output consist of the length of stays of the different patient profiles. If you program urgent categories you are interested in the length of stays of the different urgent categories. This appeared too difficult to program. For building a simulation model with urgent categories you should first program the different urgent categories. After programming the urgent categories, the different patient profiles could be implemented.
Scenario 5: General Practitioner
In my calculations of the total values I didn’t add patient profile 7. This is because in the simulation model between 17:00 and 23:00 profile 7 leaves the system after only been seen by a triage-nurse. In reality the patient then goes to the general practitioner. So the times
presented for profile 7 doesn’t include the time patient profile spends at the general
*Time is presented in minutes
Scenario 6: Scenarios 3 and 5 combined
To examine the effect of implementing a triage-nurse and the general practitioner we combined scenario 4 and 6. The patient also will immediately receive supplementary
diagnostics if needed. Again patient profile 7 only shows the length of stay at the emergency department, it doesn’t show the time at the general practitioner.
*Time is presented in minutes
We also examined the influence of combining scenarios 5 and 6 the occupation rate of the cubicles.
Cubicle Current Situation Scenarios 5 and 6
combined Improvement
Cubicle 5 Cubicle 6 Cubicle 7 Cubicle 8
66% 54% 49% 60%
41% 18% 28% 12%
38% 67% 43% 80%
We see a great improvement in occupation rate if we compare the current situation with the combined scenarios. The average decrease in cubicles is 57%. We can also calculate the expected decrease according to ‘Factory Physics’, in formula WIP= CT*TH. Now the throughput isn’t the same because patient profile 7 will be transferred directly to the ‘spoed post’ without having stayed in a cubicle.
Discussion
This study has produced the following answers to the research questions. What promising
scenarios can we formulate with help of theories and real life cases?
This research created several scenarios implemented in a simulation model of an academic centre in Amsterdam. The scenarios will help to have a better understanding of a complex system and validate the current simulation model. The scenarios where designed with help from theories and real life cases.
The theory of Factory Physics state that variability is a cause of waiting times and queuing. The arrival of patients is highly unpredictable and variable. The first scenario is to investigate the influence of the variability of the arrivals on the length of stay. Factory Physics provides a formula (VUT Equation) to calculate the influence of the arrivals on the length of stay. If we calculate this influence according to the VUT-equation there would be a reduction of 73% in length of stay.
In former research, distributions were investigated to see what kind of effect a better fitted distribution would have on the length of stay. In this research we compared the average radiology time with the gamma distribution of the current model. According the theory of Factory Physics the variability of the radiology time becomes zero. The variability will reduce thus the length of stay will reduce too.
The AMC strives to evidence based management. The choice of a new treatment must be based on proven effectiveness. The following scenarios are designed to support a new treatment. This treatment was designed with help of meetings with working staff. The new treatment consists of a triage nurse who will start direct supplementary diagnostics if necessary. This scenario was tested to measure the effect on the length of stay. In the near future general practitioners will come to the ED in Amsterdam. Patients that don’t need to be examined by the ED-doctor will be referred to the 'spoed post'. The patient first will be examined by the triage-nurse, after triage the patient will go the general practitioner. If the outcomes of these scenarios are positive, the outcomes will support the implementation of this new treatment at the ED in Amsterdam.
What conclusions can be drawn if we compare the simulation outcomes of the promising scenarios in relation to what we expected?
By simulating a constant arrival time, the length of stay almost reduced with 50%. Because the variability of the arrivals is zero, the length of stay is closer to the effective process time. The theory of Factory Physics indicated an improvement of 73%. If we look at the used part
of the VUT equation
to get a 50% reduction in length of stay, ce² should be equal
to ca². This is because the VUT-equation is a general formula for several production processes. It is not proven to be correct for an Emergency Department. The calculated 73% appeared too large, but it was a good indication that simulating a constant arrival time would reduce the length of stay.
The results of the scenario involving a constant radiology time showed that it does not make much of a difference if you simulate a constant radiology time or a gamma distribution. The difference in weighted average for all patient categories was 1 minute and for patients needing supplementary diagnostics also 1 minute. A T-test showed that there was no
patient one has to wait 30 minutes and patient two (who has to wait until patient one is ready) waits 20 minutes. While in real life the waiting time for patient two should be higher then the waiting time of patient one. Because there are so many patients ultimately the radiology time will become the average value of the distribution.
The more difficult scenarios showed promising results. In the simulation model we compared two scenarios which consisted of adding an extra nurse. In the new method this new ED-nurse had a different role. The new ED-ED-nurse will perform triage. The other scenario
consisted of the current situation with one extra ED-nurse. This resulted in an improvement in length of stay of 12%.
The introduction of general practitioners to the ED in the AMC resulted in an improvement of 37%. The length of stay of patient profile 7 only represents the length of stay at the ED, the total length of stay will be higher in reality then calculated by the simulation model. However the length of stay of patient profile 7 will most likely reduce to because of the general
practitioner coming to the ED.
These two scenarios combined resulted in an improvement of 53% on the length of stay of all patients. This is a great result which can have a positive effect on patient satisfaction.
Reducing waiting times is one of the key factors in patient satisfaction. Patient satisfaction is a big issue in emergency departments [Bursch et al., 1993]. Longer waits downgrade care, shorter waits improve the result in better patient response to care. [Bloom and Fenderick, 1987] Another big improvement is the reduction in the cubicle occupation rate. There is a reduction of more then 50%. It can be stated that performing immediate supplementary diagnostics and introducing a ‘spoed post’(general practitioners) at the AMC will reduce the length of stay of the patient. The workload for ED-doctors and nurses will reduce because patients will go to the ‘spoed post’ between 17:00 and 23:00.
Scenarios Improvement in LOS compared
to the current situation
The programming of the urgent categories appeared too difficult. A disadvantage was you couldn’t measure the outcomes of the different urgent categories. If you program such a scenario it is interesting to see how long each urgent category has to wait and if the goals you set (for example U1 can only wait 30 minutes) can be met. To program this scenario a new model must be designed, of course a lot of programming lines of the current simulation model could be used.
To what extend does the simulation model accommodate these new scenarios?
Implementing the scenarios also showed how easy or difficult changing an existing
simulation model in EMplant is. When programming the scenarios several problems occurred. Programming in a model produced by another researcher is very complex and time
lines and can be programmed more efficient. Programming the more difficult scenarios took about three/four weeks.
Someone with programming experience in any programming language can work with the model and implement the easiest scenarios. If you want to change the model to implement new scenarios you should learn to work with the program EMplant.
Scenarios Time to program
Constant radiology
This research supports the implementation of a triage nurse who can initiate direct
supplementary diagnostics. It also showed introducing a ‘spoed post’ at the AMC will reduce length of stay and work load for ED-doctors and ED-nurses. This research provides evidence based management for the new working method and implementation of the ‘spoed post’. This research also showed interesting scenarios can be designed with help of ‘Factory
Physics’ and ‘Lean Thinking’. To understand the variability of the process at the ED ‘Factory Physics’ provides us with several laws who explain variability. With help of these laws we found that variability in the arrivals is a big cause of waiting times. Furthermore these laws helped us to validate the model and showed just an average waiting time for supplementary diagnostics is sufficient to receive a valid outcome.
Recommendations
The scenario of a constant arrival showed a large reduction in length of stay if there is no variability in the arrival rate. The arrival process is one of the main reasons of waiting times. Further research about scheduling patients from the emergency department is thus very important. Scheduling would reduce the variability of the arrivals of patients and as a result reduce the length of stay. [Rosmulder et al., 2005]
Furthermore an average constant laboratory and radiology time appears to give a valid measure, the difference in both the LOS mean appeared smaller than suspected, so a distribution might therefore not be necessary when reproducing ED process times in a simulation model; assumptions of the average laboratory or radiology time seem to be
accurate. Also reducing supplementary diagnostics times don't have a large effect on length of stay in the current situation because the ED-doctor often is busy performing other tasks won't analyze the results.
Programming in an existing simulation model appeared difficult. It would be best if the programmer who developed the simulation model also implements the changes. The programmer understands and knows the model best and knows the boundaries and possibilities.
The results of the new method are promising. A real life experiment will take place in a short amount of time. In this experiment the new method will be tested. The simulation model showed that introducing a triage-nurse will result in improvement in length of stay. This research supports introducing a triage-nurse and the redesign of the process at the emergency department.
This research focused on the self referred patients. It would be interesting to program a simulation model which includes referred patients. Furthermore I would recommend
References
AMC, 2006. Jaarverslag 2005.http://www.amc.nl/upload/teksten/voorlichting/jaarverlagen/JAARVERSLAG%202005%20.pdf Åmo, B.W. 2006, Employee innovation behaviour in health care: The influence from management and colleagues. Int Nurs Rev. Volume 53. Pages 231-237.
Blegen MA, Goode C, Johnson M, Maas M, Chen L & Moorhead S. 1993, Preferences for decision- making autonomy. Image J Nurs Sch. volume 25, Pages 339-44.
Bucknall T & Thomas, S. 1996, Critical care nurse satisfaction with levels of involvement in clinical decisions. Journal of Advanced Nursing. Volume 23, part 3. Pages 571-577.
Bursch B. Beezy J. and Shaw R. 1993. Emergency department satisfaction: what matters most? Annual Emergency Magazine. Volume 22. Pages 586-591
Cheung, W.W.H, Heeney, L. & Pound, J. L. 2002. An advance triage system. Accident and emergency nursing. Volume 10, part 1. Pages 10-16
Derlet, R.W. 2002. Overcrowding in emergency departments: increased demand and decreased capacity. Annals of Emergency Medicine, Volume 39, Issue 4, Pages 430-432
Hannan, E. 1974. Planning an emergency department holding unit. SEPS. Volume 9 number 5. Pages 179-188
Hopp, W. J. & Spearman, M. L. 2000, Factory Physics, 2nd edition, McGraw-Hill, Singapore. Law, A.M. & Kelton W.D.. 2000. Simulation Modelling and Analysis. 3rd edition. McGraw-Hill
International Series.
Law, A.M. & Kelton W.D. 2003. Lean Thinking Banisch waste and create value in your operation. Journal-operational research societ. Volume 48, number 11. Pages 1148
Leaman, A.M. 2003. See and Treat: a management driven method of achieving targets or a tool for better patient care? One size does not fit all. Emergency Medical Journal. Volume 20. Page 118 Lindgaard Laursen M., Gertsen F. & Johansen J. 2003. Applying lean thinking in hospitals exploring
implementation difficulties. Conference paper
Lopez Valcarel B.G & Perez P.B. 1994, Evaluation of alternative functional designs in an emergency department by means of simulation. Simulation, volume 63, number 1. Pages 20-28.
Poele, R. te 2006. Impact of laboratory turnaround time on the patient length of stay at an emergency department – AMC Amsterdam
Relf M. 1995, Increasing job satisfaction and motivation while reducing nursing turnover through the implementation of shared governance. Critical care Nursing Quarterly. Volume 18. Pages 7-13 Rosmulder, R.W. 2005. Emergencies: improvise or organise? – Developing modern operational
methods to tackle the problematic care delivery of emergency departments. Research proposal. Enschede
Rosmulder, R.W. et al., 2005. Scheduling patients at an emergency department. Presented at 4th International Conference on the Management of Healthcare & Medical Technology, Aalborg, Denmark August 2005
Rutschmann, O.T., Kossovsky M., Geissbühler A., Perneger T., Vermeulen B., Simon J. & Sarasin F., 2006, Interactive triage simulator revealed important variability in both process and outcome of emergency triage. Journal of Clinical Epidemiology, Volume 59, Issue 6, Pages 615-621 Saunders, C.E.,Makens P.K. & Leblanc L.J. 1988. Modeling Emergency Department Operations
Using Advanced Computer Simulation Systems. Annals of emergency medicine. Volume 18. Pages 134-140
Schuppen, J.C. van. 2006. A simulation tool for the emergency department. Thesis University of Twente – AMC Amsterdam.
Shannon, D.C. Tsuchiya, M. & Douglas, C. Simulation of distributed processing networks. Computer Networks and ISDN Systems. Volume 11, Issue 1. Pages 15-27
Spaite, D., Bartholomeaux, F., Guisto, J., Lindberg, E., Hull, B., Eyherabide, A., Lanyon, S., Criss, E., Valenzuela & T., Conroy, C. 2002 ‘Rapid process redesign in a university- based emergency department: decreasing waiting time intervals and improving patient satisfaction’, Annals of Emergency Medicine. Volume 39. Pages 168-177.
Standridge, C.R. 2004. How Factory Physics helps simulation. Proceedings of the 36th conference on Winter simulation
Tecnomatix. 2005. Tutorial eM-Plant 7.0
cooperation(fully revised). Edition 2003
Womack, J. P., Jones, D. T, & Roos, D. 1990, The machine that changed the world, Rawson Associates, New York.