A COMPARITIVE STUDY ON SELECTED KINEMATIC VARIABLES OF JUMP SERVE OF NATIONAL LEVEL MALE VOLLEYBALL PLAYERS
Ajesh. C.R, PhD Scholar, School of Physical Education and Sports Sciences, Mahatma Gandhi University, Kottayam
Prof.(Dr.) T.I. Manoj, Director of Student’s Welfare, Kerala Agricultural University, Thrissur Abstract
The purpose of the study was to find out the difference in selected kinematic variables of jump serve among Senior, Youth and Junior national level male volleyball players. The sample size consisted of a total of 31 male subjects were selected randomly from the players who have represented Kerala state at the national-level competitions. The groups again sub divided into Male Senior (N=11), Male Youth (N =10), and Male Junior (N= 10). For Jump serve the variables considered Approach Distance, Approach Velocity, Distance of Jump, Height of CG and Velocity of the Serve. The serve trials of the subjects were captured with camera and analysed with Kinovea Motion analysis software. The data pertaining to the variables of jump serve were tested using Descriptive statistics, and Multivariate Analyses of Variance (MANOVA). Further ANOVA and LSD Post hoc Test was also done to find out the mean difference among the said variables of the three groups of male national level volleyball players. The level of significance was set at .05 for testing the hypotheses. The analysis of the variables of Jump Serve among Senior, Youth and Junior national level male volleyball players revealed that there was significant difference exists in terms of Approach Distance, Distance of Jump, Height of CG and Velocity of Serve. Among national level male volleyball players Senior group have the highest mean score for velocity of Jump Serve ( 23.520 m/s) that that of Youth (20.024 m/s) and Junior (15.801 m/s).
Key Words : Kinematic Analysis, Volleyball, Jump Serve Introduction
serve is a powerful offensive weapon in scoring points directly and in assisting the block and defense to score points (Palo J.M et.,al, 2004). In volleyball the serve techniques and speeds differ according to the performance level. (Hayrinen, M et., al, 2007). Hence an attempt has been made to assess the difference in selected kinematic variables of jump serve among Senior, Youth and Junior national level male volleyball players.
Methodology
The purpose of the study was to find out the difference in selected kinematic variables of jump serve among Senior, Youth and Junior national level male volleyball players. The sample size consisted of a total of 31 male subjects were selected randomly from the players who have represented Kerala state at the national-level competitions. The groups again sub divided into Male Senior (N=11), Male Youth (N =10), and Male Junior (N= 10). The sample of present study includes International and national level male volleyball players from the volleyball teams of BPCL, Kochi, Kerala Police, KSEB, St. Thomas College, Pala, SAI Training Center, Calicut, and Members of different University teams which participated in All India Inter University Volleyball Championship. For Jump serve the variables considered Approach Distance, Approach Velocity, Distance of Jump, Height of CG and Velocity of the Serve.
For the present study the researcher along with a technical team for videographer visited the practice venues of different volleyball teams and recorded different kinds of serves using digital video camera (Canon 60 D, 30 fps). The camera lens was oriented perpendicular to the plane of motion (sagittal) at a distance of 10 m. The camera was mounted on a tripod at a height of 1.40 mts from the ground. An object of known dimension was filmed before the trails of the subjects. A practice session, which lasted approximately half an hour, immediately followed the instruction period to ensure correct and consistent execution of jump serve. The video captured were separated into each serve for a player and saved into a computer in AVI format. The analysis on each serve trail was done using Kinovea Motion Analysis software. The calibration of the captured video was done using the known measurement within the frame of each serve. The Approach Distance was obtained by measuring the displacement from the starting position of the player to serve to the point of takeoff, the Approach Velocity was calculated by diving the displacement during approach with the time taken for it. The Distance of Jump of the server was the displacement from the point of takeoff to the nearest point of landing after serve. The Height of the CG was the vertical displacement of center of gravity at the point of ball contact for the serve. The value for Velocity of Serve was calculated by diving the displacement of the ball from the point of ball contact to the point where it crosses the net with the time taken for it. The parameter time was obtained from the motion analysis software.
Results of the Study
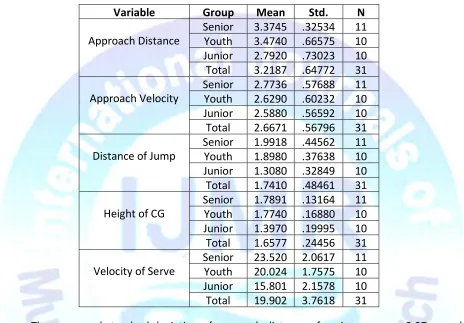
Table 1
Analysis of the factors that influence Jump Serve of National Level Volleyball Players
The mean and standard deviation of approach distance of senior men was 3.37 m and 0.32, that of youth men was 3.47 m and 0.66 and that of junior boys was 2.79 m and 0.73. The mean and standard deviation of total male was 3.21 m and 0.65. The mean and standard deviation of approach velocity of senior men was 2.77m/s and 0.58, that of youth men was 2.63m/s and 0.60 and that of junior boys was 2.59 m/s and 0.56. The mean and standard deviation of total male was 2.67 m/s and 0.57. The mean and standard deviation of distance of jump of senior men was 1.99 m and 0.44, that of youth men was 1.90 m and 0.38 and that of junior boys was 1.31 m and 0.33. The mean and standard deviation of total male was 1.74 m and 0.48. The mean and standard deviation of height of cg of senior men was 1.79 m and 0.13, that of youth men was 1.77 m and 0.17 and that of junior boys was 1.40 m and 0.20. The mean and standard deviation of total male was 1.66 m and 0.24. The mean and standard deviation of velocity of serve of senior men was 23.52 m/s and 2.06, that of youth men was 20.02 m/s and 1.76 and that of junior boys was 15.80 m/s and 2.16. The mean and standard deviation of total male was 19.90 m/s and 3.76.
Variable Group Mean Std.
Deviati on
N
Approach Distance
Senior 3.3745 .32534 11 Youth 3.4740 .66575 10 Junior 2.7920 .73023 10 Total 3.2187 .64772 31 Approach Velocity
Senior 2.7736 .57688 11 Youth 2.6290 .60232 10 Junior 2.5880 .56592 10 Total 2.6671 .56796 31 Distance of Jump
Senior 1.9918 .44562 11 Youth 1.8980 .37638 10 Junior 1.3080 .32849 10 Total 1.7410 .48461 31 Height of CG
Senior 1.7891 .13164 11 Youth 1.7740 .16880 10 Junior 1.3970 .19995 10 Total 1.6577 .24456 31 Velocity of Serve
Senior 23.520 0
2.0617 2
11 Youth 20.024
0
1.7575 1
10 Junior 15.801
0
2.1578 6
10 Total 19.902
3
3.7618 0
Table 2
MANOVA of all Dependent variables of Jump Serve of Male Volleyball Players
b. Exact statistic, c. The statistic is an upper bound on F that yields a lower bound on the significance level., d. Computed using alpha = .05
From table No. 2 it can be seen that, four test statistics are reported for the group effect on Independent Variables, Gender and Group: ‘‘Pillai’s’’, ‘‘Wilks’’’, ‘‘Hotelling’s’’, and ‘‘Roy’s.’’ Huberty (1994, pp. 183-189) offers a detailed discussion of these four statistics, and in the independent variable Group (Senior/Youth/ Junior), all the tests indicate the multivariate effect is statistically significant for the current data (Wilks’ = 0.020, F = 6.500, p <.000). This significant F indicates that, there are significant differences between groups on selected dependent variables.
The ETA squared is currently a frequently reported and important descriptive statistics in communication research. ETA squared is interpreted as the proportion of the total variability in the dependent variable that is accounted for by variation in the independent variable. It is the ratio between groups sum of squares to the total sum of squares. ETA squared has a number of properties that make it a useful estimate of effect size in research. The observed power of partial ETA squared is 0.858, it shows that, this independent variable (Group) accounts for 85.8% of variability in dependent variables.
Table: 3
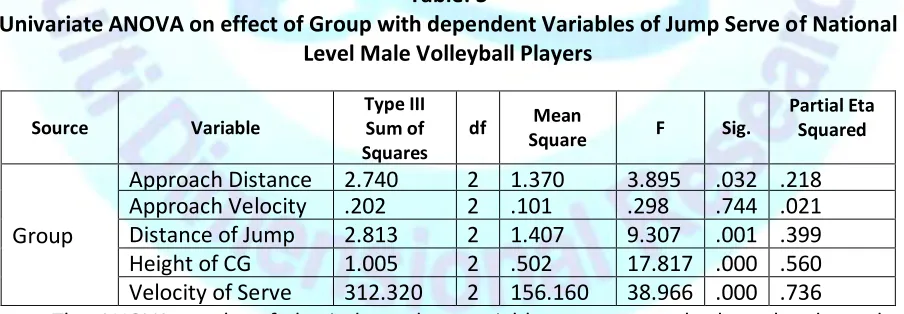
Univariate ANOVA on effect of Group with dependent Variables of Jump Serve of National Level Male Volleyball Players
The ANOVA results of the independent variable groups reveals that, the dependent variables, Approach Distance (F= 3.895, p<.032), Distance of Jump (F=9.307, p<.001), Height of CG (F=17.817, p<.000) and Velocity of serve (F= 38.966, p<.000) differ significantly with independent variable, group (Senior/ Youth/ Junior). All other dependent variables are found not significant.
Effect Value F Hypothesis
df Error df Sig.
Partial Eta Squared
GROUP
Pillai's Trace 1.653 5.450 28.000 32.000 .00 0
.827 Wilks' Lambda 0.020 6.500
b 28.000 30.000 .00
0
.858 Hotelling's Trace 15.314 7.657 28.000 28.000 .00
0
.884 Roy's Largest Root 12.658 14.46
6c
14.000 16.000 .00 0
.927
Source Variable
Type III Sum of Squares
df Mean
Square F Sig.
Partial Eta Squared
Group
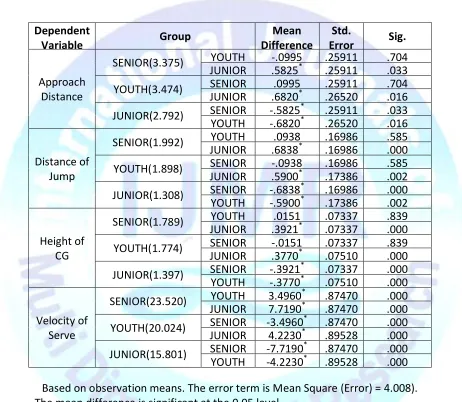
Pair wise comparison and post hoc test (LSD) performed on following dependent variables found significant (Approach Distance, Distance of Jump , Height of CG and Velocity of serve) effect on the independent variable Group (Senior/ Youth/ Junior) presented in Table 4.
Table 4
Pair-wise Comparisons of means of significant dependent Variables on Group (LSD)
Based on observation means. The error term is Mean Square (Error) = 4.008). The mean difference is significant at the 0.05 level.
The results of the variable approach distance shows that Youth group have the highest score of 3.474 and differ significantly with Junior (M = 2.792) with a mean difference of .6820. It also shows that senior (M=3.375) differ significantly with junior (2.792) with a mean difference of .5825. All these differences were found significant at 0.05 levels. The pair-wise comparison of distance of jump results indicate that, senior group have the highest score of 1.992 and differ significantly with Junior (M = 1.308) with a mean difference of .6838. It also shows that youth (M=1.898) differ significantly with junior (1.308) with a mean difference of .5900.All these differences were found significant at 0.05 levels. The results of the variable
Dependent
Variable Group
Mean Difference
(I-J)
Std.
Error Sig.
Approach Distance
SENIOR(3.375) YOUTH -.0995 .25911 .704 JUNIOR .5825* .25911 .033 YOUTH(3.474) SENIOR .0995 .25911 .704 JUNIOR .6820* .26520 .016 JUNIOR(2.792) SENIOR -.5825* .25911 .033 YOUTH -.6820* .26520 .016
Distance of Jump
SENIOR(1.992) YOUTH .0938 .16986 .585 JUNIOR .6838* .16986 .000 YOUTH(1.898) SENIOR -.0938 .16986 .585 JUNIOR .5900* .17386 .002 JUNIOR(1.308) SENIOR -.6838* .16986 .000 YOUTH -.5900* .17386 .002
Height of CG
SENIOR(1.789) YOUTH .0151 .07337 .839 JUNIOR .3921* .07337 .000 YOUTH(1.774) SENIOR -.0151 .07337 .839 JUNIOR .3770* .07510 .000 JUNIOR(1.397) SENIOR -.3921
*
.07337 .000 YOUTH -.3770* .07510 .000
Velocity of Serve
SENIOR(23.520) YOUTH 3.4960* .87470 .000 JUNIOR 7.7190* .87470 .000 YOUTH(20.024) SENIOR -3.4960* .87470 .000 JUNIOR 4.2230* .89528 .000 JUNIOR(15.801) SENIOR -7.7190
*
with Junior (M = 1.397) with a mean difference of 0.3921. The result also shows that Youth (M =1.774) differ significantly with Junior (M = 1.397) with a mean difference of .3770. All these differences were found significant at 0.05 levels. The pair-wise comparison of the variable velocity of serve results indicate that, senior group have the highest score of 23.520 and differ significantly with Youth (M= 20.024) and Junior (M = 15.801) with a mean difference of 3.4960and 7.7190 respectively. It also shows that Youth (M= 20.024) differ significantly with junior (M = 15.801) with a mean difference of 4.2230. All these differences were found significant at 0.05 levels.
Discussion of Findings
Simon Coleman, (2005) said, the 'jump' or attack serve demonstrated same features as the spiking action. This was not surprising given the similarities between the two actions. The main differences were the time difference between the dominant and non-dominant leg extension and the center of mass horizontal velocity at take-off. These factors reflected the greater amount of linear translation required in the serve. Trunk rotations again seemed to be unimportant in generating ball speed, whereas elbow and humerus extension were significant factors in this respect. Here also the analysis variables of Jump Serve among national level male volleyball players shown that there is significant difference in Approach Distance and Distance of Jump among the three groups, which directly influence the linear transition of the server in Jump Serve action. And finally it resulted in greater serve speed for senior male group, as they possess highest mean score for Approach Velocity and Distance of Jump than that of others.
Andrew S Rokito (2005) reported that in volleyball the server technique and speeds differ according to the performance level. Jump serve at the highest levels and jump float serve at youth level were dominating serve techniques. The lower serve speed allows receivers to make perfect receptions enabling a team to score points by reception attack. In the present study also the serve speed of Jump Serve found to be increased as the level of performance was increased. Among national level male volleyball players Senior group have the highest mean score for velocity of Jump Serve ( 23.520 m/s) that that of Youth (20.024 m/s) and Junior (15.801 m/s).
Conclusion
References
Kus, sally.coching(2004)Volleyball Successfully.Champain,Human Kinetic Publisers.
Rai, Ramesh.Biomechanics-Aspects of Human Motion.Punjab,India,Agrim Publication,2003. Chung, C. K. Choi, "Three-dimensional kinematics of the spiking arm during the volleyball
spike." Korean Journal of Sport Science 2: (1990) 124-151.
Coleman.S, Benham, A.S. and Northcott, S.R, “A Three-Dimensional Cinematographical Analysis of the Volleyball Spike,” Journal of Sport Sciences, 11(4), (1993) 295-302.
Ikram, Hussain, Asim, Khan. and Arif, Mohammad. A, “Comparison of Selected Biomechanical Parameters of Spike Serves between Intervarsity and Intercollegiate Volleyball Players,” Journal of Education and Practice, Volume 2, No 2: (2005) 274-277.