IJEDR1602301
International Journal of Engineering Development and Research (www.ijedr.org)1696
Characterisation Of PV- Cell Using Real Data
1Modu M. Ibrahim, 2Jibril D. Jiya, 3Harrison O. Idakwo 1Post graduate Student, 2 Professor, 3Instructor II
1University of Maiduguri,
1Elect/Elect Engineering Dept University of Maiduguri, Maiduguri, Nigeria
________________________________________________________________________________________________________
Abstract - The core of solar energy generation system is the solar cell. Solar photovoltaic depends on weather conditions and properties of semi conductor materials used in its manufacture. The intensity of incident light from the sun is one of the major variables impacting on the output power generated by a solar module, which is described by their current – voltage and power – voltage characteristics curve. This paper focuses on characteristics of solar cell under different levels of real irradiation of Maiduguri weather conditions for a sample year with respect to hot, raining and cold seasons, where months of April, July and December were selected respectively for each season. The data are obtained from Maiduguri weather station in order to simulate and study the behavior of the P-V and I-V characteristics of a solar cell. An equivalent single and double diode models were implemented in MATLAB'S simscape environment. Maximum, average, and minimum radiation levels are considered as inputs for simulation. the output result under different irradiation levels were presented, where the PV cell gives better performance in the simulated area and it was observe that the output of the characteristics curve does not differ much with the results under standard test conditions normally provided by the manufacturer on the solar cell performance characteristics data sheet.
Index Terms – Simscape, Irradiation, Photovoltaic-Cell, Real Data.
________________________________________________________________________________________________________
I.INTRODUCTION
Photovoltaic energy generation seems to be the most popular and reliable source of energy generation among the types of available renewable energies. Much of the electrical characteristics of photovoltaic solar cells depend on the physical properties of semi-conductor materials used in its manufacture, and industrial process applied. There are commercially available several types of PV Cells, currently are emerging continuously new technology in market, but the best known are Monocrystalline Silicon, Polycrystalline Silicon and thin-film solar cells ( Bernal, 2012).The photovoltaic effect is the electrical potential developed between two different materials when their common junction is illuminated by photon irradiation. These cells are combined in series to increase voltage (V) or parallel to increase current (I) without increasing voltage. The current generated is stored in batteries and converted to alternating current (AC) through inverters.
In the wake of PV system installation, a performance of the PV cell is of increasing importance to evaluate important parameters such as irradiance, output voltage, current and temperature (Ahmed et al, 2014). The output of the solar cell is greatly depends on the weather condition and are characterized by their current-voltage (I-V) characteristics curve (Abduljaleel et al, 2012). The I-V characteristic of solar cell describes its electrical performance. These characteristics are determined by parameters such as diode saturation current, diode ideal factor, photo-generated current, series and shunt resistance.
Many literatures as in (Usman et al, 2014), (Salmi et al, 2012), (Ibbini et al, 2014), ( Kumar et al, 2014), (Ibrahim, 2011), e.t.c simulated and validated a single and double diode model of a Photovoltaic system in Simulink/Simscape environment to study I-V and P-V characteristics using standard test conditions and data. In this work, attempt is made to simulate an equivalent single and double diode model of PV cell using simscape environment in order to study the I-V and P-V characteristics under real local environmental weather condition of Maiduguri.
(Usman et al, 2014) studied the behavioural characteristics of photovoltaic cell with different irradiation in Matlab/Simulink/Simscape environment. It was concluded that the higher the solar irradiance, the better the output of the I-V and P-V curves, and vice versal. Thus, the paper does not clearly describe the parameter used in the model and the manufacturers data sheet was not presented either. In this work, we proposed to consider both the single and double diode model and consider real radiation data for the purpose of this paper.
(Kumar et al, 2014) presented a comparative study of model based design of PV cell in Matlab/Simulink/Simscape. The authors investigated three diode based PV cell models of open circuit voltage and short circuit current. However, the author has not paid much attention to the resistance of the cell. PV manufacturers don't provide all the data needed to construct the model. This also includes the internal resistance which play a role in determining the model performance.
IJEDR1602301
International Journal of Engineering Development and Research (www.ijedr.org)1697
(Rekioua and Aissou, 2013) presented three methods of obtaining electrical characteristics of solar panel: Simulation method by using Matlab/Simulink, classical experimental method with variable resistive load and system acquisition (National instrument Card and Labview Software). The obtained results in each case and under different metrological conditions are presented. It was reported that the method using labview software, data acquisition system allows measuring the values of current and voltage, to simultaneously trace electrical characteristics in real time. This method might be highly technical, though is also time consuming and relatively not cost effective considering the need and involvement/requirement of various instruments and subsystems. The work clearly expresses the mathematical model of one diode and two diode of photovoltaic panel modelling. The one diode model chosen in the work fits quite well to reality, and greatly facilitates the process of computing and programming because of its reduced complexity in defining parameters.(El - Tayyan, 2012) proposes an approach to predict I-V characteristics of a photovoltaic PV system using single diode five parameters model. It was based exclusively on data sheet parameters.
(Salmi et al, 2012) developed a Matlab/Simulink model for solar PV cell, modules and array. The model is based on the fundamental circuit equation of a solar PV cell taking into account the effect of physical and environmental parameters such as solar radiation and cell temperature. However, some performance characteristics of I-V curve such as Maximum Power Point, fill factor and efficiency were not discussed. Since for a module or array of a PV cells, the shape of the I-V curve does not change. However, it is scaled based on the number of cells connected in series and in parallel.
(Bernal, 2012) focused on the study and development of a computational tool aim to stimulate the PV modules performance under different test conditions from different levels of temperature and irradiance. The simulator calculates the current-voltage characteristic curve through the constructive details of the panel. Also the application is able to provide useful information such as power, fill factor and efficiency of a module in a given area. It was reported that given the diode quality and the band -gap voltage of the semiconductor materials, the Labview simulator will have no problem to emulate all types of cells in the market. It used a one diode model, and only taken into account the series resistance Rs, with a reason that all shunt resistance 𝑅𝑠ℎ has a very high value, more than 200 Ohms.
( Ibrahim, 2011) forwarded an approach for the analysis of electrical characteristics of photovoltaic single crystal silicon solar cells at outdoor measurement, where an investigation of the performance and device parameter of the solar cell at different condition of irradiance, tilt angle and mirror boosting effect had been studied. The data were recorded over a period of six months. It shows that electrical parameter of the solar cell is been affected by tilt angle and it was found that cold season produces efficient photo-conversion for solar cells. The output power of the single-crystal solar cell reduces as irradiance is reduced and solar cell output varies in open environment, i.e. at the place of installation. However, it was assumed that all the solar cells are the same and operate under identical conditions and the effect of parasitic resistance are neglected.
(Mayer and Powell, 2011) developed a low-cost laboratory experiment that generates I-V characteristics curve of a solar cell. It has been shown that cost can be minimize by using a National instrument USB-6008DQ with a student version of Lab view and by building a current sink from discrete components. The system consisted of a laptop, a data acquisition (DAQ) device, a current sink circuit, and a Solarimeter or solar meter. Irradiance and temperature were used as input parameter to generate the I-V curve. The actual value of current may not be measured using a current sink circuit because the voltage drop across the circuit sensing resistor will not be zero, also using sun as a light source to carry out the experiment, this can put a limit to the time and place for the experiment to be performed. The voltage and current measurements are acquired on the PC by means of an automated measurement System based on IEEE 488.2 instrument using a Labview based user interface. Environmental data are acquired using a Pt 100 and a pyranometer, processed by a MATLAB Script which implements the mathematical model of the panel. To measure the optimized value of series resistance(𝑅𝑠) and shunt resistance(𝑅𝑠ℎ) initial estimate or guess was chosen using newton-Raphson iterative method and the values of I and V were obtained by varying the loads, this makes the process quite repetitive, and the algorithm for the process or the procedures was not presented in the literature.
(Venkateswarlu and Raju, 2013) reported a simscape model of photovoltaic cell. A simulation of a single and double solar cell model has been developed using simelectronics(Matlab/simulink) environment, where effect of two environmental parameters of temperature and radiation was observed from the I-V and P-V curves and the results are compared with the graph on the manufactures data sheet. It was found that in low sun radiation level, the two diode model is more accurate and is close to real situation. Among other measurement parameters, the irradiance data was kept at default value of 1000 W/m2, this only give single curve, limiting output/results for comparison.
II.EQUIVALENTDIODEMODELOFPVCELL
a. Equivalent circuit of a single diode model
IJEDR1602301
International Journal of Engineering Development and Research (www.ijedr.org)1698
resistance Rs as shown in fig 1. 𝑅𝑠ℎ(Shunt resistance) value usually has a very high value, and since the cell efficiency is insensitive to change in 𝑅𝑠ℎ, thus is neglected. The net current is the difference between the photocurrent 𝐼𝑝ℎ and the normal diode current 𝐼𝐷, given by equation (3.1)𝐼 = 𝐼𝑝ℎ− 𝐼𝐷 (1)
I = 𝐼𝑝ℎ−𝐼𝑂[𝑒𝑥𝑝
𝑒(𝑉 +𝐼𝑅𝑆)
𝑚𝐾𝑇𝑎𝑏 ] − 1 (2)
Where: m is the idealizing factor. K is the boltzmans's constant.
𝑇𝑎𝑏 is the absolute temperature of the cell in (Kelvin).
𝑒 is the Electronic charge. V is the cell voltage in (V). I is the saturation current in (A).
𝐼𝑝ℎ Is the Photocurrent in (A).
𝑅𝑠 Is the series resistance in (Ω).
Fig 1: Single-diode equivalent model of a P-V Cell b.) Equivalent circuit of a double diode model
The model consist of a current source whose intensity is directly proportional to radiation in parallel with two diodes, one that simulates the diffusion of minority charge and the other corresponding to the recombination of junction. The parallel resistance
𝑅𝑝 represents the leakage current losses, and the series resistor 𝑅𝑠 represnts the internal losses of the cell. The equivalent circuit of the two diode model is shown in fig. 2
This block models a solar cell as a parallel combination of current source,two exponential diode and a parallel resistor, 𝑅𝑃, That are connected in series with a resistance 𝑅𝑠. The output current is given by:
𝐼 = 𝐼𝑝ℎ−𝐼𝑆1[𝑒 (𝑉+𝐼𝑅𝑆 )
(𝑁1𝑉𝑡 ) − 1] −I𝑠2[𝑒 (𝑉 +𝐼𝑅𝑠 )
(𝑁2𝑉𝑡) − 1] − ( 𝑉 +𝐼 𝑅𝑠 )
𝑅𝑝 (3)
where 𝐼𝑃ℎis the solar induced current, given by:
I𝑝ℎ = 𝐼𝑝ℎ𝑜× 𝐼𝑟
𝐼𝑟𝑜 (4)
where, Ir is the irradiance (light intensity) in W/m2 falling on the cell.
I𝑝ℎ𝑜 is the measured solar generated current for the irradiance Iro.
𝐼𝑆1 is the saturation current of the first diode.
𝐼𝑠2 is the saturation current of the second diode.
𝑉𝑡 is the thermal voltage, 𝐾𝑇 𝑞⁄ , where: K is the boltman's constant.
T is the device simulation temperature value. e is the elementry charge on an electron.
𝑁1 is the quality factor (diode emission coefficient) of the first diode.
𝑁2 is the quality factor (diode emission coefficient of the second diode). V is the voltage across the solar cell electrical ports.
IJEDR1602301
International Journal of Engineering Development and Research (www.ijedr.org)1699
Fig 2: Double-diode equivalent model of a P-V CellIII. CHARACTERIZATIONOFPVCELL
The characterization of the solar cell is based on an equivalent single and double diode model in a MATLAB/simscape environment. The simscape block models a solar cell as a parallel combination of a current source, exponential diode and parallel resistor that are connected in series with a resistance.
DATA COLLECTION
The maximum, average and minimum irradiance levels of the months of April, July and December for the three seasons of a sample year were considered as the major input in addition to default value of other parameters. Fig 3 shows the block diagram representation of the system.
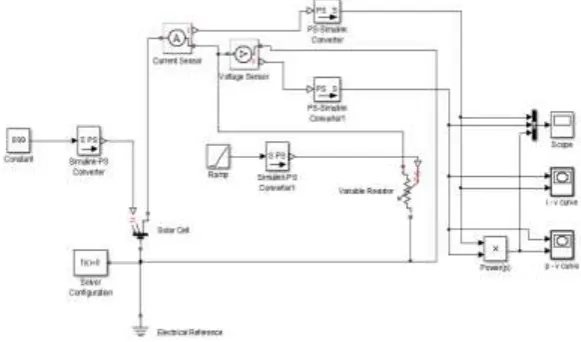
Fig 3: Block Diagram of PV characterization System
PV SIMULINK/SIMSCAPE MODEL
The simscape model of a photovoltaic solar cell is shown in Fig 4. MATLAB'S simscape modelling environment offers the option of ready- made blocks to imitate real physical components. A pv cell block in simscape can be grouped in series and parallel formulation to construct a module.
The terminal characteristics, I-V and P - V curve can be generated by adjusting some parameters (irradiation and resistance), and the radiation levels were taken as the major input to the solar cell block for simulation while maintaining constant temperature of 250C . A circuit is being implemented using the matlab software, consisting of variable resistor connected in series across the PV cell with a ramp signal, simulink - PS converter and PS - simulink converter blocks, current and voltage sensors, and other interfacing blocks connected as a single unit.
IJEDR1602301
International Journal of Engineering Development and Research (www.ijedr.org)1700
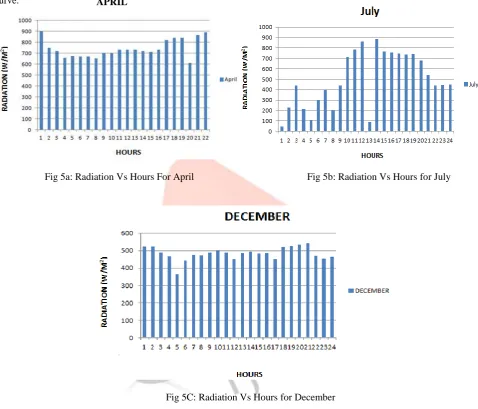
IV. SIMULATIONOFRESULTThe model of PV cell was implemented using Matlab's simscape library which uses physical modeling language. Fig 6 to Fig 8 depicts the results of the I-V and P-V characteristics curve. The data covered three months of April, July and December of the year 2011, with a maximum: (899w/m2, 888w/m2, and 540.06w/m2) Average: (699.5w/m2, 534.66w/m2 and 481.7016w/m2) minimum: (610w/m2, 48w/m2, and 362.32w/m2) values respectively considered as inputs for the simulation. Fig 3a to 3c shows a graphical representation of the hourly solar radiation data, where months of April recorded highest value followed by July and December respectively. The simulated results at fixed temperature (25 0C) revealed that, the higher the radiation the greater the current on the I-V curve. Voltage remains almost constant in each case, maximum power point were attained on the P-V curve.
Fig 5a: Radiation Vs Hours For April Fig 5b: Radiation Vs Hours for July
Fig 5C: Radiation Vs Hours for December
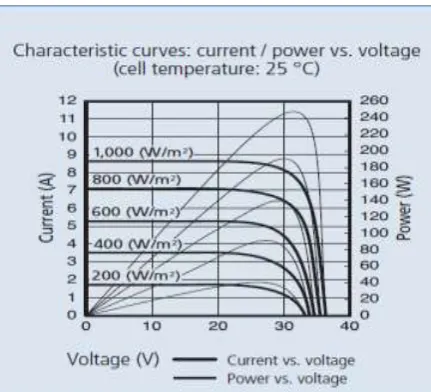
The output results for the single and double diode models shows no significant difference, and are similar to the one on the manufacture's datasheet on Fig 9 which have a value of 1000W/m2 as maximum and 200W/m2 as minimum radiation with cell temperature of 250C.
I-V and P-V characteristic curve for a single and double diode model
IJEDR1602301
International Journal of Engineering Development and Research (www.ijedr.org)1701
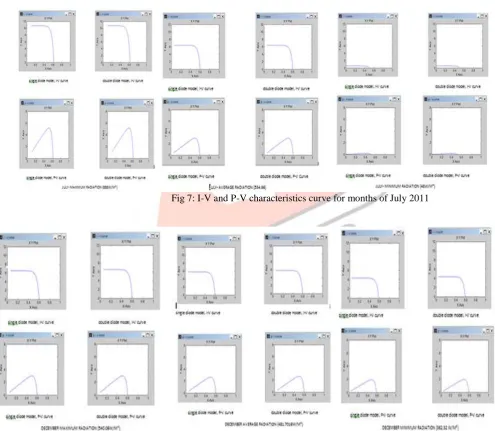
Fig 6: I-V and P-V characteristics curve for months of April 2011Fig 7: I-V and P-V characteristics curve for months of July 2011
IJEDR1602301
International Journal of Engineering Development and Research (www.ijedr.org)1702
Fig 9: Characteristics curve of sharp solar module Nu-E245 from data sheetSource: (www.sharp.eu)
V. DICUSSION OF RESULTS
Fig. 6 to Fig 8 above shows the simulated output characteristics curve of a single and double diode model under three different radiation levels. The current varies with input (radiation) on the I-V curve, and voltage remains almost the same. This shows that irradiation has significant effect on output current than the output voltage of a pv cell. Maximum power point were attained on the P-V curve for the different radiation levels, except for the month of July – minimum (45W/m2) value as represented on Fig. 7. This indicates that power output depend on the amount of solar radiation or light intensity falling on the surface of a pv cell.
The I-V and P-V characteristics of the single and double diode model for the month of April, representing hot season with maximum, average and minimum values of radiation levels as in Fig 6 was compared to the data sheet of Fig. 9. Result shows that, there is a similarity to the characteristic on the manufacturer's data sheet. The simulated performance of the pv cell in month of April has higher output on the graph, this is as a result of higher radiation recorded during hot season.
Also, comparing result obtained for the month of July, representing raining season with different radiation levels as in Fig 7 are nearly similar with the characteristics curve on manufacture's data sheet. But, the minimum radiation level of the same month does not produce similar result. This shows that weather condition affects energy generation using photovoltaic modules.
Similarly, simulation for the month of December representing cold season gives similar result for the three radiation levels as shown in Fig 8.
From the results obtained, it was observed that there is no clear or significant difference between the simulated outputs of the diode based models with the characteristics on manufacturer's data sheet. A Concordance between the results of the single and double diode model was observed. However, the double diode solar photovoltaic model results were satisfactory. Month of April with highest value of maximum, average and minimum radiation levels produces better result compared to July, and December. And this indicates that for a higher radiation, there will be an increase in current and power output of a PV module.
VI. CONCLUSION:
A PV- cell model was implemented using matlab simscape library to determine the characterization of PV-cell using real data. The performance of the model was compared for single and double diode model, with the double diode model outperforming the single diode model. Simulation results obtained shows that there is a significant potential of solar energy radiation in Maiduguri region, with April, having the highest value compared to july and december with little variation.
The simultaneous characteristics curve observed through I-V and P-V graphs with various effect of radiation on pv cell exhibits satisfactory performance and revealed that the higher the solar radiation the better the output and vice versal .
The performance of a model based pv cell under real weather conditions produced similar result with the one based on standard test condition (STC) of the manufacture's data sheet.
VII. ACKNOWLEDGMENT
Special thanks goes to the Nigerian meteorological centre (NIMET) for providing us with weather data (Solar radiation). REFERENCES
[1] Ahmed C. B, Kassas M and Ahmed S. E, (2014). "PV – stand alone monitoring system performance using labview". International journal of smart grid and clean energy Vol. 3, No.1, pp 45 – 50.
IJEDR1602301
International Journal of Engineering Development and Research (www.ijedr.org)1703
[3] Bernal P. G, (2012). “Study and Development of a Photovoltaic Panel Simulator” Master Thesis, Facultade de Engenhariada Universidade do Porto. PP 3-10.
[4] El-Tayya A. A, (2012). "PV System behaviour based on data sheet". Journal of Electron Devices, Vol. 9, No.2, PP. 336-337.
[5] Ibrahim. A, (2011). "Analysis of electrical characteristics of photovoltaic single crystal silicon solar cells at outdoor measurements". Journal of smart grid and renewable energy. vol 2, pp 169 – 175
[6] Ibbini M. S, Mansi S, Masadeh M and Alhajri E, (2013). "Simscape Solar Cells Model Analysis and Design". Journal of Computer Applications in Environmental Sciences and Renewable Energy. Vol.9, No.4, pp 97 – 101
[7] Kumar A. V. P, Parimi A. M and Umarao K, (2014). "A Comparative Study of Model based Design of PV Cell in Matlab/Simulink/Simscape". International Journal of Advance Trends in Computer Science and Engineering, Vol. 3, No.1, PP 37 - 40
[8] Mayer E. A and Powell A. L, (2012). "A Low-cost Laboratory Experiment to Generate the I-V characteristics curves of a Solar Cel". American Society of Engineering Education. Vol.18, No.8, PP .42 - 50
[9] Rekioua D and Aissou S, (2013). "Photovoltaic Panels Characteristics Method". International Conference on Control, Engineering and Information Technology (C.E.I.T) Proceedings Engineering and Technology, Vol.1, No.13, PP. 168 - 169 [10] Salmi T, Bouzguenda M, Gastli A and Masmoudi A, (2012). “Matlab/Simulink Based Modelling of Solar Photovoltaic
Cell”. International Journal of Rennewable Energy Research. Vol. 2, No.3, PP. 214 – 217 [11] Sharp Energy solution Europe, www.sharp.eu
[12] Usman H, Lawal S. M and Shehu R. S, (2014). "Behavioural Characteristics of Photovoltaic Cell with Different Irradiation in Matlab/Simulink/Simscape Environment". Academic Journal of Interdisciplinary Studies, MCSER Publishing, Rome-Italy. Vol.3, No.7 PP. 55-57