Proceedings
A comparative study of three methods for detecting association
of quantitative traits in samples of related subjects
Aude Saint Pierre*, Zulma Vitezica and Maria Martinez
Address: INSERM, U.563, University Paul-Sabatier, CPTP, Toulouse F-31300, France
E-mail: Aude Saint Pierre* - [email protected]; Zulma Vitezica - [email protected]; Maria Martinez - [email protected]
*Corresponding author
fromGenetic Analysis Workshop 16 St Louis, MO, USA 17-20 September 2009
Published: 15 December 2009
BMC Proceedings2009,3(Suppl 7):S122 doi: 10.1186/1753-6561-3-S7-S122
This article is available from: http://www.biomedcentral.com/1753-6561/3/S7/S122 ©2009 Pierre et al; licensee BioMed Central Ltd.
This is an open access article distributed under the terms of the Creative Commons Attribution License (http://creativecommons.org/licenses/by/2.0), which permits unrestricted use, distribution, and reproduction in any medium, provided the original work is properly cited.
Abstract
We used Genetic Analysis Workshop 16 Problem 3 Framingham Heart Study simulated data set to compare methods for association analysis of quantitative traits in related individuals. More specifically, we investigated type I error and relative power of three approaches: the measured genotype, the quantitative transmission-disequilibrium test (QTDT), and the quantitative trait linkage-disequilibrium (QTLD) tests. We studied high-density lipoprotein and triglyceride (TG) lipid variables, as measured at Visit 1. Knowing the answers, we selected three true major genes for high-density lipoprotein and/or TG. Empirical distributions of the three association models were derived from the first 100 replicates. In these data, all three models were similar in error rates. Across the three association models, the power was the lowest for the functional SNP with smallest size effects (i.e.,a2), and for the less heritable trait (i.e., TG). Our results showed that measured genotype outperformed the two orthogonal-based association models (QTLD, QTDT), even after accounting for population stratification. QTDT had the lowest power rates. This is consistent with the amount of marker and trait data used by each association model. While the effective sample sizes varied little across our tested variants, we observed some large power drops and marked differences in performances of the models. We found that the performances contrasted the most for the tightly linked, but not associated, functional variants.
Background
For pedigree-based association analysis, several methods have been developed that utilize information about transmission of alleles, such as the orthogonal test for within-family variation (quantitative
transmission-dis-equilibrium test, or QTDT) [1,2]. The quantitative trait linkage-disequilibrium test (QTLD) is a modification of the QTDT method that assigns the founder genotypes to the within-family component rather than to the between-family component [3]. The measured genotype
(MG) model is a simple fixed-effects regression for which non-independence in the data is accounted for by polygenic effects [4,5]. All three approaches, QTDT, QTLD, and MG, can be applied to the association analysis of quantitative traits in extended pedigrees. They differ in the amount and type of marker information used for testing association. The MG model uses all individuals with available phenotype and genotype data. The family-based models use a subset of this sample. The effective sample size of QTDT is further reduced because founders and spouses are not use to estimate the within-component effect. Thus, QTDT may lack of power compared with QTLD and/or MG but, on the other hand, both MG and QTLD tests may be affected by allelic association due to population stratification. The relative merit of these approaches has been investigated in a few instances [3,6]. Here, we extend these studies to explore type I error and relative power of QTDT, QTLD, and MG tests in a large pedigree-based sample, i.e., Genetic Analysis Workshop 16 Problem 3 Framingham Heart Study (FHS) simulated data set. Our investigation was performed with knowledge of the answers.
Methods
Choice of the quantitative traits studied for association analysis
We studied the two simulated quantitative traits, high-density lipoprotein (HDL) and triglyceride (TG), mea-sured at Visit 1 in FHS simulated data set. All our analyses were conducted using the first 100 replicates. Within each replicate, we adjusted trait values for sex and age using a linear regression. We used the residual values of HDL and TG as the phenotypes of interest for association testing. We then assessed the distributions of each trait using the 100 replicates. We found that HDL, but not TG (kurtosis = 16.21, skewness = 2.49), values were normally distributed. The fit to the normal distribution was obtained using a rank-based transfor-mation of TG values (TG_Rob): kurtosis and skewness were equal to -0.02 and 0.003, respectively.
SNP data preprocessing
Genotype data were obtained from the Affymetrix GeneChip Human Mapping 500 k Array. Individual genotype data were filtered based on BRLMM (Bayesian robust linear model with Mahalanobis distance) con-fidence scores: we used the standard cutoff of 0.5 for call/ no-call. Quality control analyses led to 1) exclusion of SNPs with less than 95% call rates, with unknown map position, or with low minor allele frequency (<1%); 2) zeroing out all genotypes at any DNA sample with <95% call rate; 3) exclusion of SNPs not fitting the Hardy-Weinberg equilibrium (p-value ≤ 10-6) hypothesis;
4) zeroing out genotypes of all individuals in a family at any SNP that showed mendelian errors.
Pedigree sample data
From the total FHS sample of 940 pedigrees, we selected 704 pedigrees having at least two non-founders indivi-duals with available phenotype and genotype data.
Choice of the SNPs tested for association
In brief, the simulation models for HDL and TG included the effects of major genes (five for HDL and three for TG, each explaining 0.1-0.3% of the total variance), and polygenic effects (58% for HDL and 38% for TG). Here, we limited our study to three (LPL,
CYP2B7P1, and CYP2B6) of the HDL major genes. TG
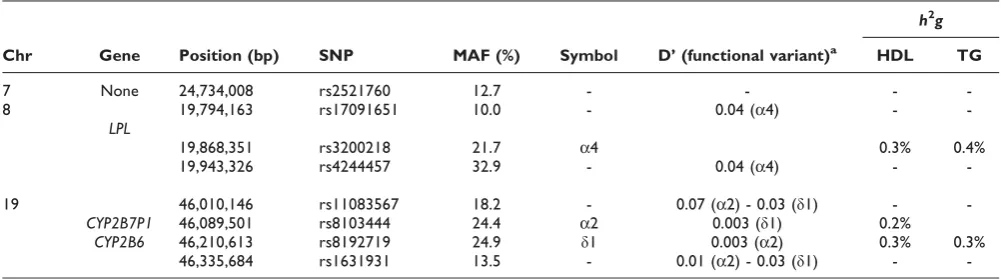
variability was also explained by two (LPLandCYP2B6) of these genes. Table 1 lists the main characteristics of all studied SNPs; within each gene the functional SNP is denoted with its symbol name,h2gis the rate of the trait variance explained by each functional SNP, andD’is the standardized Lewontin’s disequilibrium coefficient between the functional variant and each SNP being tightly linked to it. The total number of subjects with available phenotype and genotype data ranged from 5,826 to 5,995. Note that two functional SNPs (a2 and δ1) are tightly (~120 kb) linked but not associated (D’= 0.003). For each gene, we used the functional SNP and two“non-associated”SNPs, selected from the set of SNPs tightly linked (<100 kb) and not associated (D’< 0.10) to the functional SNP. Finally, we also investigated association tests using SNPs not linked to any of the functional variants. The‘false’gene was randomly drawn on chromosome 7 (position: 24,734,008 bp).
Pedigree-based association tests
allele copies across all three methods. The effective sample sizes of these three association tests differ. MG model uses all subjects (founders, spouses, and relatives) with known phenotype and genotype status. From this sample, the two family-based association models discard data on the relatives not fulfilling either one of the two conditions: 1) their two parents are genotyped and at least one of them is heterozygote or 2) they have at least one sibling with a different genotype. The effective sample size of QTDT is further reduced because founders and spouses are not use to estimate the within-component effect.
Evidence for population stratification (denoted here as STRAT) is assessed through the likelihood ratio of the restricted (bw and bb are held equal) to the unrestricted (bw and bb are estimated freely) model. All three association tests, as well as the STRAT test, are assumed to follow a chi-square distribution with one degree of freedom.
We performed single-SNP association analyses. For each trait and each SNP, we computed the three association tests (and STRAT test) in each replicate, and derived the mean and standard deviation of each chi-square statistic over 100 replicates. We also derived mean and standard deviations of the association parameters (regression coefficients). Power and error rates were defined as the proportion of replicates with a chi-square value exceed-ing a given nominal threshold value. MG and QTLD analyses were also performed accounting for population stratification (denoted as MG_S and QTLD_S tests): MG and QTLD chi-square values were both set to zero in the replicates having a STRAT p-value ≤ 5%. The three association tests were evaluated under varying condi-tions regarding i) inclusion or exclusion of the dietary effect (covariate“diet”affects TG levels and is correlated among family members) and in the association model, ii) trait distribution, i.e., untransformed vs. transformed
trait values. Indeed, these association models assume that trait values are normally distributed, and departures from normality can inflate their type I error or reduce their power.
Results and discussion
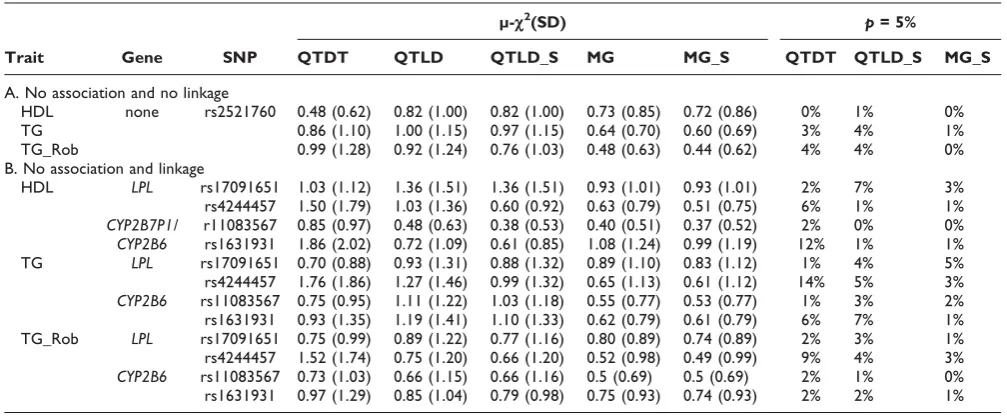
Table 2 shows empirical estimates of the mean chi-square statistics and type I error rates, at a nominal
p-value of 5%, of QTDT, QTLD, and MG tests when the studied SNP is not associated to the trait. The three association tests were roughly similar in empirical estimates, whether or not the studied SNP is linked to a major gene. In general, error rates were lower or close to the nominal values, except for QTDT with two SNPs. As expected, accounting for population stratification decreased the mean chi-square statistics of both QTLD and MG models. Interestingly, in these data, departure from normality did not yield inflated error rates, except with QTDT for TG and rs4244457. Error rates remained unchanged when diet was included into the model (results not shown).
Table 3 shows empirical estimates of the three associa-tion models when the studied SNP is the funcassocia-tional polymorphism. For QTLD and MG models, we chose to report the results obtained after accounting for popula-tion stratificapopula-tion. Across the three associapopula-tion models, the power was the lowest for the functional SNP with smallest size effects (i.e., a2), and for the less heritable trait (i.e., TG). For TG, mean chi-square estimates were slightly increased when diet was included into the model. For QTDT and MG_S models, estimates were also increased when the trait was normal (i.e., using TG_Rob), relative to when the trait was non-normal. Reverse trends were observed for QTLD_S. The direction of the association parameters was consistent across the three association models (results not shown). Overall, for a given trait and SNP, the mean chi-square statistic was always the highest with MG_S and the lowest with
Table 1: Characteristics of the SNPs selected to test association to HDL and TG
h2g
Chr Gene Position (bp) SNP MAF (%) Symbol D’(functional variant)a HDL TG
7 None 24,734,008 rs2521760 12.7 - - -
-8 19,794,163 rs17091651 10.0 - 0.04 (a4) -
-LPL
19,868,351 rs3200218 21.7 a4 0.3% 0.4%
19,943,326 rs4244457 32.9 - 0.04 (a4) -
-19 46,010,146 rs11083567 18.2 - 0.07 (a2) - 0.03 (δ1) -
-CYP2B7P1 46,089,501 rs8103444 24.4 a2 0.003 (δ1) 0.2%
CYP2B6 46,210,613 rs8192719 24.9 δ1 0.003 (a2) 0.3% 0.3%
46,335,684 rs1631931 13.5 - 0.01 (a2) - 0.03 (δ1) -
-a
QTDT. The mean chi-square of QTDT was 1.6 to 6.2 times lower than that of MG_S. For QTLD_S the ratios ranged from 1.0 to 2.4. This is consistent with the amount of marker and trait information used by each association model. For MG, the effective sample sizes (Ne) ranged from 5854 (a4) to 5995 (a2 and δ1) subjects. For QTLD and QTDT, Ne values ranged from 2436 (a4) to 2839 (δ1), and from 1846 (a4) to 2240 (δ1), respectively. It is worth noting that across the three functional variants, the drops in Ne values relative to that of MG varied little: they were the lowest with δ1 (2.11 vs. 2.68 for QTLD vs. QTDT), and the highest with
a4 (2.40 vs. 3.17 for QTLD vs. QTDT). In contrast, and for HDL, differences in the performances of the models were more marked with δ1 than witha4. Indeed, mean chi-square statistic of QTLD_S was 1.73 lower than that of MG_S with δ1, whereas both tests showed same
performances with a4. Similarly, drops of the mean QTDT statistic, relative to MG_S, were much greater with
a2 (6.25) or δ1 (2.37) than with a4 (1.56). It is worth noting thata4 andδ1 explained similar amount of HDL variability. Thus, these results suggest that the relative performance of the association models can not be simply related to differences in the effective sample sizes.
In conclusion, our results showed that MG outperformed the two orthogonal-based association models (QTLD, QTDT), even after accounting for population stratifica-tion. QTDT had the lowest power rates. Similar conclu-sions were reached by two previous simulation studies [3,6]. It is worth noting that our investigation was conducted in a relatively large pedigree-based sample (>5,850 subjects with known phenotype and genotype status; out of these ~10% are founders). Thus, although
Table 3: Meanc2statistics (μ-c2) and power (at a nominalp) of QTDT, QTLD, and MG
μ-c2(SD) p= 5% p= 0.1%
SNP symbol Trait QTDT QTLD_S MG_S QTDT QTLD_S MG_S QTDT QTLD_S MG_S
a4 HDL 17.88 (6.28) 27.18 (11.51) 27.88 (11.55) 100% 91% 91% 89% 91% 91%
HDL_Diet 17.87 (6.28) 27.17 (11.51) 27.88 (11.54) 100% 92% 92% 91% 92% 92%
a2 HDL 1.38 (1.35) 3.56 (2.59) 8.62 (5.05) 7% 46% 83% 0% 1% 34%
HDL_Diet 1.38 (1.35) 3.56 (2.59) 8.62 (5.05) 7% 46% 83% 0% 1% 34%
δ1 HDL 7.13 (3.80) 9.77 (4.48) 16.90 (6.00) 80% 95% 99% 15% 35% 92%
HDL_Diet 7.13 (3.80) 9.76 (4.48) 16.89 (6.00) 80% 95% 99% 15% 35% 91%
a4 TG 2.21 (2.46) 5.88 (4.67) 9.92 (6.31) 16% 59% 83% 2% 11% 43%
TG_Diet 2.21 (2.35) 6.01 (4.6) 10.19 (6.07) 22% 62% 86% 2% 14% 46%
TG_Rob 3.35 (3.16) 4.67 (4.11) 12.67 (6.34) 33% 46% 94% 3% 10% 58%
δ1 TG 3.11 (2.87) 7.97 (5.29) 12.13 (6.16) 28% 78% 92% 2% 26% 52%
TG_Diet 3.11 (2.87) 8.04 (5.42) 12.28 (6.22) 32% 77% 92% 3% 26% 54%
TG_Rob 5.15 (3.58) 7.46 (4.64) 17.46 (7.04) 57% 75% 95% 11% 21% 86%
Table 2: Meanc2statistics (μ-c2) and type 1 error rates (at a nominalp) of QTDT, QTLD, and MG association tests
μ-c2(SD) p= 5%
Trait Gene SNP QTDT QTLD QTLD_S MG MG_S QTDT QTLD_S MG_S
A. No association and no linkage
HDL none rs2521760 0.48 (0.62) 0.82 (1.00) 0.82 (1.00) 0.73 (0.85) 0.72 (0.86) 0% 1% 0%
TG 0.86 (1.10) 1.00 (1.15) 0.97 (1.15) 0.64 (0.70) 0.60 (0.69) 3% 4% 1%
TG_Rob 0.99 (1.28) 0.92 (1.24) 0.76 (1.03) 0.48 (0.63) 0.44 (0.62) 4% 4% 0%
B. No association and linkage
the major gene-specific effects were very modest (<0.4%), the three association models showed good power (>80%, atp= 5%) to detect direct association for HDL and two (a4 and δ1) of the three functional variants. At a lower tabulated threshold (p= 0.1%), the power remained good using the MG model only. For TG, good power was obtained with the MG model with one functional SNP (δ1) and using transformed TG values.
List of abbreviations used
FHS: Framingham Heart Study; HDL: High-density lipoprotein; QTLD: Quantitative trait linkage disequili-brium; QTDT: Quantitative transmission-disequilibrium test; MG: Measured genotype; SNP: Single-nucleotide polymorphism; STRAT: Population stratification; TG: Triglyceride.
Competing interests
The authors declare that they have no competing interests.
Authors
’
contributions
ASP carried out the statistical genetic analyses and drafted the manuscript. ZV contributed in the statistical analysis and helped to draft the manuscript. MM conceived the study, coordinated it, and contributed to the draft the manuscript. All authors read and approved the final manuscript.
Acknowledgements
The Genetic Analysis Workshops are supported by NIH grant R01 GM031575 from the National Institute of General Medical Sciences.
This article has been published as part of BMC Proceedings Volume 3 Supplement 7, 2009: Genetic Analysis Workshop 16. The full contents of the supplement are available online at http://www.biomedcentral.com/ 1753-6561/3?issue=S7.
References
1. Abecasis GR, Cardon LR and Cookson WO: A general test of association for quantitative traits in nuclear families.Am J Hum Genet2000,66:279–292.
2. Fulker DW, Cherny SS, Sham PC and Hewitt JK: Combined linkage and association sib-pair analysis for quantitative traits.Am J Hum Genet1999,64:259–267.
3. Havill LM, Dyer TD, Richardson DK, Mahaney MC and Blangero J: The quantitative trait linkage disequilibrium test: a more powerful alternative to the quantitative transmission dis-equilibrium test for use in the absence of population stratification.BMC Genet2005,6(Suppl 1):S91.
4. Hopper JL and Mathews JD:Extensions to multivariate normal models for pedigree analysis.Ann Hum Genet1982,46:373–383. 5. Boerwinkle E, Chakraborty R and Sing CF:The use of measured genotype information in the analysis of quantitative pheno-types in man. I. Models and analytical methods. Ann Hum Genet1986,50:181–194.
6. Aulchenko YS, de Koning DJ and Haley C: Genomewide rapid association using mixed model and regression: a fast and simple method for genomewide pedigree-based quantitative trait loci association analysis.Genetics2007,177:577–585. 7. Almasy L and Blangero J:Multipoint quantitative-trait linkage
analysis in general pedigrees. Am J Hum Genet 1998, 62:1198–1211.
Publish with BioMed Central and every scientist can read your work free of charge
"BioMed Central will be the most significant development for disseminating the results of biomedical researc h in our lifetime."
Sir Paul Nurse, Cancer Research UK
Your research papers will be:
available free of charge to the entire biomedical community
peer reviewed and published immediately upon acceptance
cited in PubMed and archived on PubMed Central
yours — you keep the copyright