P R O C E E D I N G S
Open Access
Comparative study of statistical methods for
detecting association with rare variants in
exome-resequencing data
Mohamad Saad
1,2*, Aude Saint Pierre
1,2, Nora Bohossian
1,2, Matthias Macé
1, Maria Martinez
1,2From
Genetic Analysis Workshop 17
Boston, MA, USA. 13-16 October 2010
Abstract
Genome-wide association studies for complex traits are based on the common disease/common variant (CDCV) and common disease/rare variant (CDRV) assumptions. Under the CDCV hypothesis, classical genome-wide association studies using single-marker tests are powerful in detecting common susceptibility variants, but under the CDRV hypothesis they are not as powerful. Several methods have been recently proposed to detect association with multiple rare variants collectively in a functional unit such as a gene. In this paper, we compare the relative performance of several of these methods on the Genetic Analysis Workshop 17 data. We evaluate these methods using the unrelated individual and family data sets. Association was tested using 200 replicates for the quantitative trait Q1. Although in these data the power to detect association is often low, our results show that collapsing methods are promising tools. However, we faced the challenge of assessing the proper type I error to validate our power comparisons. We observed that the type I error rate was not well controlled; however, we did not find a general trend specific to each method. Each method can be conservative or nonconservative depending on the studied gene. Our results also suggest that collapsing and the single-locus association approaches may not be affected to the same extent by population stratification. This deserves further investigation.
Background
Classical genome-wide association studies have successfully detected many common genetic variants that are associated with complex traits. It is likely that low-frequency or rare variants are also contributing to genetic risk [1]. The statistical power to detect phenotypic association with such variants is limited because of the small number of observa-tions for any given variant and a more stringent multiple test correction compared to common variants [2]. The simultaneous analysis of rare variants aims to identify accu-mulations of minor alleles within the same functional unit (e.g., gene).
Several new methods have been recently proposed to tackle the rare variant problem [2-6]. The principal dif-ference between them lies in the way the information on the multiple rare variants is used. Some methods use a
subset of variants that satisfy predefined selection criteria, whereas other methods use all variants. The methods also differ in the way in which the cumulative informa-tion on minor alleles within a funcinforma-tional unit is coded. Finally, multivariate collapsing approaches have also been proposed. Most of these recent developments have been applied to association analyses in data from unrelated individuals. A new method has been recently developed [4,6] that can be applied to both unrelated individual and family data.
In this paper, we evaluate and compare the power of dif-ferent collapsing methods for detecting association of mul-tiple rare variants with a quantitative trait. We first focus on the unrelated individuals data and then incorporate some of these approaches within the general framework of the mixed model for association analysis in the family data set of Genetic Analysis Workshop 17 (GAW17). We tried to answer the following questions: Does the use of a subset of rare variants perform better than using all variants? Do * Correspondence: [email protected]
1INSERM UMR1043, CPTP, CHU Purpan, Toulouse, 31024, France Full list of author information is available at the end of the article
the collapsing approaches perform similarly with unrelated individual and family data sets? The analyses were per-formed using the GAW17 data with knowledge of the answers [7].
Methods
We studied the quantitative trait Q1 influenced by 39 variants in nine independent genes.
Statistical association analysis of rare variants
We carry out the association test at the gene level. Assume that a geneGcontainsJGvariants denotedSNPj,
j= 1,…,JG, and thatMAFjis the minor allele frequency
ofSNPj. LetY= (y1, …,yN) be the observations of the
phenotype Q1 inNunrelated individuals, and letXiGbe
the vector of genotypes of the SNPs in geneGfor indivi-duali. The genotypes are coded 0, 1, or 2, depending on the number of minor alleles.
LetTmafbe a selection criterion on minor allele
fre-quency (MAF) values. The association methods we have investigated vary according to a predefinedTmafvalue (i.e.,
less than 1%, less than 5%, or less than 50%) and on the number of collapsing groups. They are all based on a lin-ear regression modeling the relationship between the trait
Yand the SNP data within a gene. We briefly review these methods in this Methods section. More details are given by Dering et al. [8].
Association testing in the unrelated individuals data set: univariate collapsing approaches
The univariate collapsing approaches use only a subset of variants that satisfy the constraint MAF≤Tmaf, where
Tmafis a predefined selection value.
The first univariate collapsing approach is the collapsing and summation test (CAST). LetXiG(maf) be the vector of genotype scores of the SNPs with MAF <Tmaf, and letJG
(maf) be the length of the vectorXiG(maf). The variable
C=CiG(maf) (i= 1,…,N) denotes the two collapsing stra-tegies that we used: collapsing absence/presence (CA) and collapsing proportion (CP). For the CA strategy:
CiG Xij
and for the CP strategy:
C X
Equation (1) is based on the presence or absence of the minor allele at any rare variant in geneGwithin an individual [3]. Equation (2) is based on the proportion
of rare variants with MAF≤Tmaf at which an individual
i carries at least one copy of the minor allele [5]. The model isY =Cb+ ε, where e ~N
(
0,Ise2)
and s2 isthe residual variance.
The effect of b can be tested with a likelihood ratio test that follows a chi-square distribution with 1 degree of freedom (df).
The second univariate collapsing method is the vari-able-threshold (VT) approach [2], which uses the CP
approach to collapse rare SNPs with MAF <Tmaf but
maximizes the statistic according to Tmaf. All Tmaf
values observed in the geneGare considered.For each
Tmaf, a regressionz-score is computed. Let zmaxbe the
maximum z-score across all Tmafvalues. The test of
association is based on zmax, and its statistical
signifi-cance is evaluated empirically by permutation.
The last univariate collapsing method is the weighted-sum (WS) approach [2], which is a generalization of the binary trait weighted-sum approach proposed by Madsen and Browning [4] for quantitative traits. Under this approach,Tmaf = 0.5 (i.e., all variants in a geneGare
used). The collapsing variableCfor subjectiin the WS approach is given by:
For each geneG, a genetic score is calculated as:
ZG CiG
The significance of ZG is assessed empirically by
permutation.
Association testing in the unrelated individuals data set: combined multivariate and collapsing approach
The combined multivariate and collapsing (CMC) method originally proposed by Li and Leal [3] uses a multiple regression model that contains the CA meth-od’s collapsing variable of SNPs with MAF <Tmaf= 1%
and includes allkremaining SNPs,Xj1,…,k, individually.
The multivariate model (denoted here as CMC3) is:
Evidence of association (∃j, bj ≠ 0, j = 0, …, k) is assessed with the likelihood ratio test, which follows a chi-square distribution with (k+ 1) df.
Using only the SNPs with MAF≤5%, we extended this
model in two ways. In both extensions the multivariate model contains the CA collapsing variable of SNPs with MAF < 1%. In the first variation of this model (denoted CMC1), the multivariate model also contains the CA col-lapsing variable of the other SNPs (i.e., 1%≤MAF≤5%). In contrast, in the second extension (denoted CMC2), the other SNPs are included individually in the multivariate model.
The CMC1 model is then written as:
Y =b0CA(0 1− %)+b1CA(1 5− %), (7) and the test of association is a likelihood ratio test with 2 df.
The CMC2 model is the same as Eq. (6), where kis
the number of SNPs and 1% ≤MAF ≤5%. Evidence of
association is assessed with the likelihood ratio test with (k+ 1) df.
Association testing in the unrelated individuals data set: single-marker test
For comparison purposes, we also carried out a single-locus association test. For a geneG, association with each SNP was tested using the likelihood ratio test. For each geneG, we obtainedJGlikelihood ratio test statistics, each with 1 df.
The evidence of association at the gene level was based on the maximum of theJGlikelihood ratio test statistics.
Single-marker (SM) tests were conducted with PLINK, version 1.07 [9]. The R.2.10.1 software was used for all col-lapsing approaches except the VT and WS approaches. For these two approaches we used the R script (http:// genetics.bwh.harvard.edu/vt/dokuwiki/) [2], and we set the number of permutations to 1,000.
Association testing in the family data set
We used the measured genotype (MG) test [10], which is a linear mixed model:
Yi =Xib +ei, (8)
where:
ei~N
(
0 2, Φisc2+Ise2)
, (9)sc2 and se2 are the polygenic and the residual
var-iances, respectively, and Φi is the kinship matrix in
family i. The SNP data in relatives were collapsed as
described under the CA, CP, and WS collapsing approaches. In these three approaches, the test of asso-ciation is a likelihood ratio test with 1 df. In addition, we also carried out the bivariate CMC1 approach using
the likelihood ratio test with 2 df. We could not evaluate the VT approach because it maximizesTmaf. We carried
out the MG test using the QTDT software (http://www. sph.umich.edu/csg/abecasis/QTDT/).
Type I error rate and power estimates
The empirical distribution of each association approach was evaluated in unrelated individuals and in family data. Type I error and power rates were estimated by testing association of Q1 to each of the seven false causal genes and each of the nine true causal genes, respectively, using the 200 replicates. Type I error and power rates were derived at a nominal level ofa= 5%.
In the unrelated individuals data set, we evaluated asso-ciation with Q1 using 10 approaches: CA1 and CA5 with
Tmaf= 1% and 5%, respectively; CP1 and CP5 withTmaf=
1% and 5%, respectively; and VT, WS, CMC1, CMC2, CMC3, and SM. For the WS and VT tests, we used empiricalP-values. For all remaining association tests we used tabulated nominalP-values. In each replicate, we tested for association of Q1 with each of the 16 genes using each of the 10 approaches. For each gene and for each association procedure we computed the proportion of replicates having aP-value≤a. For the SM approach, we applied a Bonferroni correction to account for the mul-tiple tests; we computed the proportion of replicates such that the lowestP-value out of theJGSNPs was less than or equal toa/JG.
In the family data set, we evaluated similarly the
follow-ing five approaches: CA1 and CA5 withTmaf= 1% and
5%, respectively; CP1 and CP5 withTmaf= 1% and 5%,
respectively; and SM. We also evaluated the WS approach but used the tabulatedP-value derived from a chi-square distribution with 1 df.
Results and discussion
The characteristics of the nine causal and seven noncausal genes are shown in Table 1. The total number of SNPs (causal and noncausal) per gene is given along with their distributions by MAF category. The MAF for the causal variants ranges from 0.07% to 16.5% in the 1000 Genomes Project data (for unrelated individuals), and the number of causal variants per gene varies from 1 (VEGFC,VEGFA) to 11 (FLT1). One causal gene (VEGFC) has one single SNP, and thus only one association approach (SM) can be applied. For the noncausal genes, the number of SNPs per gene ranges from 6 (CTSS) to 83 (LY75), and, as for the causal genes, most (>70%) of the SNPs are uncommon (MAF < 5%).
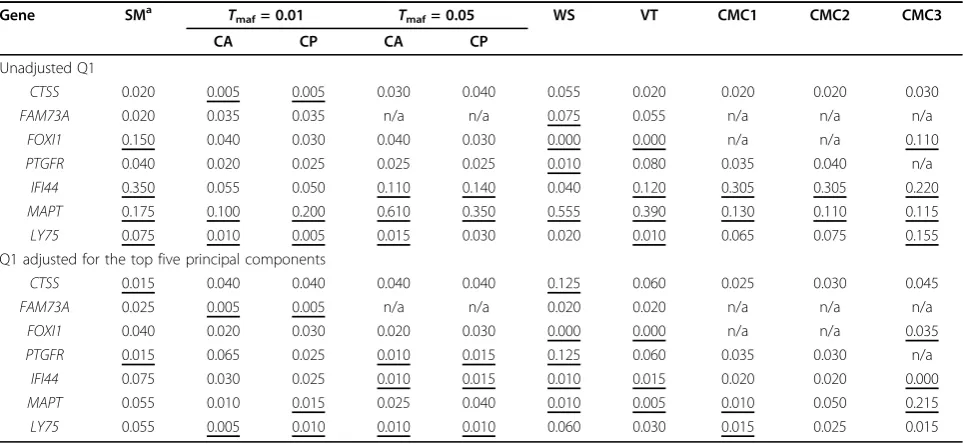
Estimates of Type I error and power rates in the unrelated individuals data set
individuals data set. As can be seen, the type I error rate is not well controlled no matter which association approach is used: The rates can be higher or lower than expected. For some genes, almost all association approaches show inflated type I error rates (e.g., MAPT,
IFI44). Conversely, for some other genes (FOXI1,LY75), the type I error rates of some approaches are inflated, whereas the other approaches tend to be conservative.
Overall, the SM and CMC3 approaches appear to have inflated type I errors more frequently. Interestingly, these two approaches are the only ones that used the common SNPs individually. Clearly, several SNPs in these sequence data, including those in our noncausal genes, have population-specific allele frequencies. Given that the genotype data were not simulated, we hypothesize that the inflated rates could be explained by the observed
Table 1 Characteristics of the studied genes
Chromosome Gene K MAF (%) V K(V) > 5% 5% >K(V) > 1% K(V) < 1%
Causal genes
1 ARNT 18 0.07; 43.11 5 1 (0) 2 (1) 15 (4)
1 ELAVL4 10 0.07; 43.11 2 2 (0) 1 (0) 7 (2)
13 FLT1 35 0.07; 29.05 1 3 (1) 7 (2) 25 (8)
5 FLT4 10 0.07; 2.08 2 0 (0) 2 (0) 8 (2)
14 HIF1A 8 0.07; 1.2 4 0 (0) 1 (1) 7 (3)
19 HIF3A 21 0.07; 38.52 3 4 (0) 2 (0) 15 (3)
4 KDR 16 0.07; 16.5 10 1 (1) 1 (1) 14 (8)
6 VEGFA 6 0.07; 2.37 1 0 (0) 1 (0) 5 (1)
4 VEGFC 1 0.07; 0.07 1 0 (0) 0 (0) 1 (1)
Noncausal genes
1 PTGFR 16 0.07; 1.69 0 0 3 13
1 IFI44 22 0.07; 11.33 0 1 1 20
1 FAM73A 10 0.07; 0.5 0 0 0 10
17 MAPT 27 0.07; 35.58 0 5 7 15
1 CTSS 6 0.07; 33.28 0 1 1 4
5 FOXI1 15 0.07; 37.30 0 2 0 12
2 LY75 83 0.07; 45.91 0 11 12 60
K, number of variants in gene;V, number of true causal variants in gene.
Table 2 Type I error rates ata= 5% by gene in the unrelated individuals data set
Gene SMa Tmaf= 0.01 Tmaf= 0.05 WS VT CMC1 CMC2 CMC3
CA CP CA CP
Unadjusted Q1
CTSS 0.020 0.005 0.005 0.030 0.040 0.055 0.020 0.020 0.020 0.030
FAM73A 0.020 0.035 0.035 n/a n/a 0.075 0.055 n/a n/a n/a
FOXI1 0.150 0.040 0.030 0.040 0.030 0.000 0.000 n/a n/a 0.110
PTGFR 0.040 0.020 0.025 0.025 0.025 0.010 0.080 0.035 0.040 n/a
IFI44 0.350 0.055 0.050 0.110 0.140 0.040 0.120 0.305 0.305 0.220
MAPT 0.175 0.100 0.200 0.610 0.350 0.555 0.390 0.130 0.110 0.115
LY75 0.075 0.010 0.005 0.015 0.030 0.020 0.010 0.065 0.075 0.155
Q1 adjusted for the top five principal components
CTSS 0.015 0.040 0.040 0.040 0.040 0.125 0.060 0.025 0.030 0.045
FAM73A 0.025 0.005 0.005 n/a n/a 0.020 0.020 n/a n/a n/a
FOXI1 0.040 0.020 0.030 0.020 0.030 0.000 0.000 n/a n/a 0.035
PTGFR 0.015 0.065 0.025 0.010 0.015 0.125 0.060 0.035 0.030 n/a
IFI44 0.075 0.030 0.025 0.010 0.015 0.010 0.015 0.020 0.020 0.000
MAPT 0.055 0.010 0.015 0.025 0.040 0.010 0.005 0.010 0.050 0.215
LY75 0.055 0.005 0.010 0.010 0.010 0.060 0.030 0.015 0.025 0.015
Estimates outside the 95% confidence interval are underlined. n/a, not applicable.
a
differences in the mean of Q1 between the four popula-tions (−0.059,−0.002, 0.021, and 0.072 in Africans, Chi-nese, JapaChi-nese, and Europeans, respectively.
We recomputed the type I error accounting for possible clusters. First, we ran a principal components (PC) analysis with Eigenstrat [11] using the full mini-exome SNP data excluding SNPs with MAF < 5%. In each replicate, we computed the residual of Q1 obtained by regression of Q1 on the first five PCs. We reestimated the type I error levels using the residual of Q1 as the phenotype. The last 10 col-umns of Table 2 show the results. As can be seen, after adjusting for the five PCs, only a few of the type I error estimates remained higher than expected. In fact, most of the estimates were lower than expected.
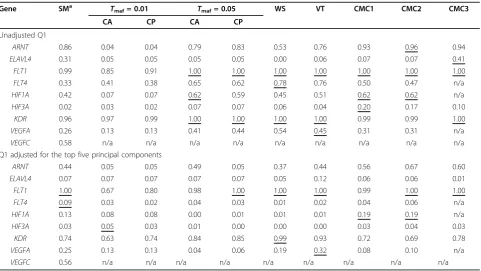
In conclusion, to estimate the power of these approaches in the data sets, we used two strategies (Table 3): Power was first computed at a theoretical level of 5%, although the different approaches may not have comparable true false-positive rates; second, power was computed account-ing for the five PCs, that is, usaccount-ing the residuals of Q1. All
methods performed well for the KDRandFLT1 genes.
Conversely, all but two methods performed poorly (power < 10%) for two genes: ForELAVL4the power was greater than 30% using the SM and CMC3 approaches, and for
HIF3Athe power was greater than 17% for the CMC2 and CMC3 approaches. For the remaining four genes, one of
the pooling methods outperformed the SM method after a Bonferroni correction. In these data, the CA and CP approaches had roughly similar power, and so, in what fol-lows, the CP method will serve as a reference.
The choice of the thresholdTmafseems to have a large
effect on power, and, in general, the power is higher when the criteria are less stringent (Tmaf= 5% vs. 1%). Although
this is not surprising for genes with causal SNPs having
1% < MAF < 5% (ARNT, HIF1A), we made the same
observation for genes with all causal SNPs having a MAF < 1% (FLT4andVEGFA; see Table 1). This may suggest that allele correlation within these genes exists among cau-sal and noncaucau-sal rare variants. The VT approach, which does not require a predefined choice onTmaf, did not
appear to outperform the CP approach. On the other hand, one of the univariate (WS) or multivariate (CMC3) collapsing methods that uses all SNPs showed better power than the CP method. This again may be explained by allele correlation among SNPs. When adjusting for population stratification, again, all approaches had the
greatest power for theFLT1andKDRgenes and the
low-est power for theELAVL4andHIF3Agenes. Nonetheless,
most power estimates were lower, and the power drop was noticeable, especially for theFLT4andHIF1Agenes. How-ever, it is unclear whether this drop is fully explained by the lower values of the adjusted false-positive rates.
Table 3 Power rates ata= 5% by gene in the unrelated individuals data set
Gene SMa Tmaf= 0.01 Tmaf= 0.05 WS VT CMC1 CMC2 CMC3
CA CP CA CP
Unadjusted Q1
ARNT 0.86 0.04 0.04 0.79 0.83 0.53 0.76 0.93 0.96 0.94
ELAVL4 0.31 0.05 0.05 0.05 0.05 0.00 0.06 0.07 0.07 0.41
FLT1 0.99 0.85 0.91 1.00 1.00 1.00 1.00 1.00 1.00 1.00
FLT4 0.33 0.41 0.38 0.65 0.62 0.78 0.76 0.50 0.47 n/a
HIF1A 0.42 0.07 0.07 0.62 0.59 0.45 0.51 0.62 0.62 n/a
HIF3A 0.02 0.03 0.02 0.07 0.07 0.06 0.04 0.20 0.17 0.10
KDR 0.96 0.97 0.99 1.00 1.00 1.00 1.00 0.99 0.99 1.00
VEGFA 0.26 0.13 0.13 0.41 0.44 0.54 0.45 0.31 0.31 n/a
VEGFC 0.58 n/a n/a n/a n/a n/a n/a n/a n/a n/a
Q1 adjusted for the top five principal components
ARNT 0.44 0.05 0.05 0.49 0.05 0.37 0.44 0.56 0.67 0.60
ELAVL4 0.07 0.07 0.07 0.07 0.07 0.05 0.12 0.06 0.06 0.01
FLT1 1.00 0.67 0.80 0.98 1.00 1.00 1.00 0.99 1.00 1.00
FLT4 0.09 0.03 0.02 0.04 0.03 0.01 0.02 0.04 0.06 n/a
HIF1A 0.13 0.08 0.08 0.00 0.01 0.01 0.01 0.19 0.19 n/a
HIF3A 0.03 0.05 0.03 0.01 0.00 0.00 0.00 0.03 0.04 0.03
KDR 0.74 0.63 0.74 0.84 0.85 0.99 0.93 0.72 0.69 0.78
VEGFA 0.25 0.13 0.13 0.04 0.06 0.19 0.32 0.08 0.10 n/a
VEGFC 0.56 n/a n/a n/a n/a n/a n/a n/a n/a n/a
Estimates outside the 95% confidence interval are underlined. n/a, not applicable.
a
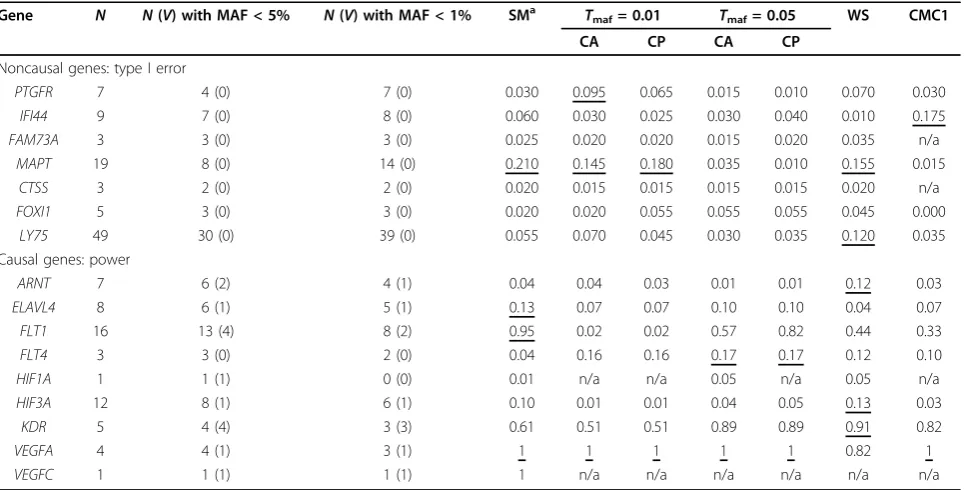
Estimates of type I error and power rates in the family data set
Table 4 shows the type I error and power rates estimated at the gene level of each association approach for the family data set. It also shows the number of SNPs, causal and noncausal, that are polymorphic in the family samples. Type I error rates appeared to be better controlled in the family data than in the unrelated individuals data set with
a few exceptions, especially theMAPTgene, for which
most type I errors were biased upward. This gene is located in a genomic region with a low recombination rate and a long range of linkage disequilibrium. All association approaches show high and similar power rates forVEGFA. High power (>80%) was observed forFLT1using the SM
and CP approaches and forKDRusing the CA(0–5%), CP
(0–5%), VT, and CMC1 approaches. In general, as
observed in the unrelated individuals data set, the CA and CP approaches showed greater power under the less strin-gentTmafcriterion of 5% versus whenTmaf= 1%.
Power of collapsing approaches in unrelated individuals versus family data set
Two causal genes (FLT1, KDR) were consistently
detected with good power (>80%) in the unrelated indivi-dual and family data sets, irrespective of the association approach. One gene (VEGFA) was detected in the family sample but not in the unrelated individuals data set (power < 54%, or power < 32% after adjusting for
population stratification). Conversely, ARNT was
detected in the unrelated individuals data set (power = 96%, or power = 77% after adjusting for population strati-fication) but not in the family data (power = 12%).
Conclusions
We found that for some genes collapsing approaches may be powerful tools to detect multiple rare variants for complex traits. In particular, the choice of the threshold
Tmafseems to have a large effect on power, and, in
gen-eral, we found a higher power when the criterion was less stringent (Tmaf= 5% vs. 1%). In the same vein, including
all SNPs, whether by means of a univariate or a multi-variate collapsing approach, can improve the power. In addition, a few of the causal genes were detected in both the related and the unrelated individuals data, whereas other causal genes were detected only in either the unre-lated individuals or the family data. However, in these data the power of association was often limited. More important, we found that type I error rates may be highly variable between genes and between approaches.
We faced the challenge of assessing the proper type I error to validate our power comparisons. We acknowl-edge that our type I and type II error rates may not be generalized because of the way the GAW17 data were simulated: Phenotype but not genotype data were gener-ated. Further, because the genotypes of founders did not vary between replicates, each family was either always
Table 4 Type I error and power ata= 5% by gene in family data set
Gene N N(V) with MAF < 5% N(V) with MAF < 1% SMa Tmaf= 0.01 Tmaf= 0.05 WS CMC1
CA CP CA CP
Noncausal genes: type I error
PTGFR 7 4 (0) 7 (0) 0.030 0.095 0.065 0.015 0.010 0.070 0.030
IFI44 9 7 (0) 8 (0) 0.060 0.030 0.025 0.030 0.040 0.010 0.175
FAM73A 3 3 (0) 3 (0) 0.025 0.020 0.020 0.015 0.020 0.035 n/a
MAPT 19 8 (0) 14 (0) 0.210 0.145 0.180 0.035 0.010 0.155 0.015
CTSS 3 2 (0) 2 (0) 0.020 0.015 0.015 0.015 0.015 0.020 n/a
FOXI1 5 3 (0) 3 (0) 0.020 0.020 0.055 0.055 0.055 0.045 0.000
LY75 49 30 (0) 39 (0) 0.055 0.070 0.045 0.030 0.035 0.120 0.035
Causal genes: power
ARNT 7 6 (2) 4 (1) 0.04 0.04 0.03 0.01 0.01 0.12 0.03
ELAVL4 8 6 (1) 5 (1) 0.13 0.07 0.07 0.10 0.10 0.04 0.07
FLT1 16 13 (4) 8 (2) 0.95 0.02 0.02 0.57 0.82 0.44 0.33
FLT4 3 3 (0) 2 (0) 0.04 0.16 0.16 0.17 0.17 0.12 0.10
HIF1A 1 1 (1) 0 (0) 0.01 n/a n/a 0.05 n/a 0.05 n/a
HIF3A 12 8 (1) 6 (1) 0.10 0.01 0.01 0.04 0.05 0.13 0.03
KDR 5 4 (4) 3 (3) 0.61 0.51 0.51 0.89 0.89 0.91 0.82
VEGFA 4 4 (1) 3 (1) 1 1 1 1 1 0.82 1
VEGFC 1 1 (1) 1 (1) 1 n/a n/a n/a n/a n/a n/a
N, number of polymorphic SNPs.V, number of polymorphic causal variants.
a
informative (at least one founder carries a causal variant) or never informative (no founder carries a causal variant) for testing association to a given causal variant.
Finally, our results also raise an interesting point that might deserve future investigation, namely, that the collap-sing and the collap-single-locus association approaches may not be affected to the same extent by population stratification. Our results suggest that collapsing approaches may be more robust, especially in the presence of multiple variants.
Acknowledgments
The authors thank the French National Agency of Research (ANR-08-MNP-012). NB was funded by the European Community’s Seventh Framework Programme ([FP7/2007- 2013] under grant agreement n° 212877 (UEPHA*MS)).
This article has been published as part ofBMC ProceedingsVolume 5 Supplement 9, 2011: Genetic Analysis Workshop 17. The full contents of the supplement are available online at http://www.biomedcentral.com/1753-6561/5?issue=S9.
Author details
1INSERM UMR1043, CPTP, CHU Purpan, Toulouse, 31024, France.2Université Paul Sabatier, Toulouse, France.
Authors’contributions
MS, ASP and MMacé performed the statistical analyses. MS, NB, and MMartinez drafted the manuscript. MMartinez conceived the study design and coordinated the study. All authors read and approved the final manuscript.
Competing interests
The authors declare that there are no competing interests.
Published: 29 November 2011
References
1. Altshuler D, Daly MJ, Lander ES:Genetic mapping in human disease. Science2008,322:881-888.
2. Price AL, Kryukov GV, de Bakker PI, Purcell SM, Staples J, Wei LJ, Sunyaev SR: Pooled association tests for rare variants in exon-resequencing studies. Am J Hum Genet2010,86:832-838.
3. Li B, Leal SM:Methods for detecting associations with rare variants for common diseases: application to analysis of sequence data.Am J Hum Genet2008,83:311-321.
4. Madsen BE, Browning SR:A groupwise association test for rare mutations using a weighted sum statistic.PLoS Genet2009,5:e1000384.
5. Morris AP, Zeggini E:An evaluation of statistical approaches to rare variant analysis in genetic association studies.Genet Epidemiol2009, 34:188-193.
6. Zhu X, Feng T, Li Y, Lu Q, Elston RC:Detecting rare variants for complex traits using family and unrelated data.Genet Epidemiol2010,34:171-187. 7. Almasy LA, Dyer TD, Peralta JM, Kent JW Jr, Charlesworth JC, Curran JE,
Blangero J:Genetic Analysis Workshop 17 mini-exome simulation.BMC Proc2011,5(suppl 9):S2.
8. Dering C, Pugh E, Ziegler A:Statistical analysis of rare sequence variants: an overview of collapsing methods.Genet Epidemiol2011,X(suppl X):X-X. 9. Purcell S, Neale B, Todd-Brown K, Thomas L, Ferreira MA, Bender D, Maller J,
Sklar P, de Bakker PI, Daly MJ,et al:PLINK: a tool set for whole-genome association and population-based linkage analyses.Am J Hum Genet 2007,81:559-575.
10. Boerwinkle E, Chakraborty R, Sing C:The use of measured genotype information in the analysis of quantitative phenotypes in man. I. Models and analytical methods.Ann Hum Genet1986,50:181-194.
11. Price AL, Patterson NJ, Plenge RM, Weinblatt ME, Shadick NA, Reich D: Principal components analysis corrects for stratification in genome-wide association studies.Nat Genet2006,38:904-909.
doi:10.1186/1753-6561-5-S9-S33
Cite this article as:Saadet al.:Comparative study of statistical methods for detecting association with rare variants in exome-resequencing data.BMC Proceedings20115(Suppl 9):S33.
Submit your next manuscript to BioMed Central and take full advantage of:
• Convenient online submission
• Thorough peer review
• No space constraints or color figure charges
• Immediate publication on acceptance
• Inclusion in PubMed, CAS, Scopus and Google Scholar
• Research which is freely available for redistribution