F U L L P A P E R
Open Access
Evaluation of waveform data processing in
Wave-Particle Interaction Analyzer
Mitsuru Hikishima
1,2*, Yuto Katoh
1and Hirotsugu Kojima
3Abstract
The Wave-Particle Interaction Analyzer (WPIA) is a software function installed on the Exploration of energization and Radiation in Geospace (ERG) satellite. The WPIA directly measures the quantity of energy transfer between
whistler-mode chorus waves and resonant energetic electrons by using plasma wave vectors and velocity vectors of plasma particles. The phase differences of the WPIA require accurate phase angles of waves and electrons in order to statistically evaluate the significance of the quantity of energy transfer. We propose a technical method for efficient waveform processing in order to conduct the WPIA measurement precisely. In the WPIA measurement, the various waves detected by the onboard instrument appear as noise in the calculation of the quantity of energy transfer for whistler-mode chorus waves. The characteristic frequency variation of the chorus waves makes waveform processing difficult. A chorus waveform is used for the WPIA processing through passband filtering by selecting appropriate data processing length and frequency resolution. We implement overlapping processing of wave data in order to reduce the induced error of the wave phase. The results of waveform processing indicate that the phase errors are
successfully reduced and statistical fluctuations are suppressed. The proposed waveform processing method is a necessary and applicative processing for the calculations of the WPIA in the ERG mission.
Keywords: Whistler-mode chorus; Wave-particle interaction; Waveform processing
Background
The Wave-Particle Interaction Analyzer (WPIA) is an instrument package installed in the Exploration of ener-gization and Radiation in Geospace (ERG) satellite (Miyoshi et al. 2013). The WPIA, which directly mea-sures the energy transfer in the process of wave-particle resonant interactions between plasma waves and charged particles in the space plasma environment, is equipped as a software function. Whistler-mode chorus waves are commonly observed outside the plasmasphere, and the waves can cause resonant interactions with energetic elec-trons in the kinetic energy range from a few keV to a few MeV. The whistler-mode chorus waves are also consid-ered to be a candidate for inducing relativistic electrons of MeV energy during a magnetic storm in the inner magne-tosphere (e.g., Summers et al. 1998; Meredith et al. 2002).
*Correspondence: [email protected]
1Department of Geophysics, Graduate School of Science, Tohoku University, Miyagi 980-8578, Japan
22 Solar-Terrestrial Environment Laboratory, Nagoya University, Nagoya, Aichi 464-8601, Japan
Full list of author information is available at the end of the article
In the ERG mission, the primary goal is to clarify the acceleration process of plasma particles by wave-particle interactions in the inner magnetosphere. The WPIA is the first attempt to directly measure the existence of energy transfer between whistler-mode chorus waves and resonant energetic electrons in space.
The WPIA uses an instantaneous wave field vector and the velocity vector of each electron, which are mea-sured using wave and particle instruments with microsec-ond resolution onboard the ERG satellite. The energy transfer W, which is represented by the inner product of E and v, where E and v are the wave electric field vector and the velocity vector of an electron, respec-tively (Fukuhara et al. 2009). The resonant interactions between whistler-mode chorus waves and electrons are investigated in the WPIA measurement. Whistler-mode chorus waves are generated around the equator out-side the plasmapause during geomagnetic disturbances (Tsurutani and Smith 1974). Whistler-mode chorus waves appear in the frequency range below the electron gyrofre-quencyfce and have distinct upper and lower frequency bands, which are identified by a gap of 0.5fce (Burtis
in a region close to the magnetic equator. The MSW are equatorial electromagnetic waves that have frequen-cies below the lower-hybrid frequency fLHR (e.g., a few hundred hertz atL∼ 4) (Santolík et al. 2002). The inten-sity approximately 200μV/m is comparable to the chorus wave amplitude (Gurnett 1976). The intense ECH waves are electrostatic waves and also appear with the excitation of chorus waves near the magnetic equator. The frequen-cies have harmonic components in (n + 1/2)fce (n = 1, 2,. . .) Kennel et al. (1970) with a magnitude of a few mV/m (Meredith et al. 2009). The WPIA measures res-onant interactions between whistler-mode chorus waves and resonant electrons near the equatorial region. The ECH and MSW are also detected with chorus waves in the region. Such intense waves affect the wave phase of chorus waves because they appear as a superposition of waves.
In the present paper, we propose a waveform processing technique, which is required in the WPIA to accurately measure the energy transfer generated by resonant wave-particle interactions. We evaluate the effectiveness of data processing using a representative model of the chorus observed near the equator. We then present an appropri-ate data processing method using passband filtering and an overlapping method in the WPIA. The effectiveness of the applied waveform processing is evaluated through pseudo-WPIA measurements by the electromagnetic particle simulation.
Methods The WPIA method
The fundamental concept of the WPIA method is described in Fukuhara et al. (2009). The WPIA uses the wave field vector and the velocity vector of plasma par-ticles, which are measured by wave and particle instru-ments with microsecond resolution. In order to evaluate the energy transfer, we consider the time variation of the kinetic energy of particles. The relativistic kinetic energy of a charged particle is given byK =m0c2(γ −1), where
m0andcare the rest mass and the speed of light, respec-tively, andγis the Lorentz factor. The time variation of the kinetic energy is represented by the quantityWas follows:
W= dK
dt =m0v· d(γv)
dt =qE·v, (1)
where vandq are the velocity vector and the charge of the charged particle, respectively, andEis the wave’s elec-tric field vector. The WPIA calculates the inner product using the instantaneous wave electric field vector and the velocity vector of each charged particle. Figure 1 shows a schematic diagram of whistler-mode chorus waves and resonant electrons. We consider the energy transfer
Ew Bw
wave fields of the whistler-mode chorus waves and gyrat-ing electrons with velocityv⊥. We define the relative phase angleθbetween the wave electric fieldEwand the electron velocity v⊥. In the WPIA, the phase angle is important for determining the energy transferW. A positiveW indi-cates the acceleration of electrons by the electric field of the wave, whereas a negativeWindicates the deceleration of electrons and causes wave growth. The WPIA calcu-lates the quantityW for an individual particle using the wave field at the moment the particle is detected. If there exist no resonant particles, the values ofW should fluc-tuate randomly about zero. We statistically evaluate the amount of energy transfer by summing the quantity W of the detected particle over a time interval. The statisti-cal significance of the obtained value is evaluated based on the standard deviationσwrepresented by the following formula (Katoh et al. 2013):
σw=
where N is the total number of particles and vi is the
velocity of thei-th particle detected at timeti.
Results and discussion
Waveform processing for calculation in the WPIA Wave data used in the WPIA processing
The specifications of the wave and particle instruments onboard the ERG satellite are described in Miyoshi et al. (2013). We introduce the measured wave data with respect to the waveform processing. Electric and mag-netic sensors are installed on the ERG satellite in order to observe alternating plasma waves in space. Two wire probe antennas, which receive electric field components of plasma waves are attached in an orthogonal manner to the spin axis of the satellite. The wire antennas are sen-sitive to a wave vector of the electric field, where one electric field component along the spin axis is missing. For detection of the magnetic field components of waves, a three-axis search coil magnetometer, which is located on top of the mast, can detect magnetic components of the plasma wave field.
W > 0
(a)
(b)
W < 0
Figure 1Schematic diagram of whistler-mode chorus waves and resonant electrons.The electric and magnetic componentsEwand
Bwof the transverse wave field of whistler-mode waves and gyrating electrons with respect to the ambient magnetic fieldB0for the cases of(a)W<0 and(b)W>0 (after Katoh et al. 2013).
in order to obtain the amplitude and phase of the wave-form detected by the sensors, the signals require calibra-tion using the transfer funccalibra-tions that were applied to the signals. Since the calibration procedure is implemented in the frequency domain, waves must be transformed using the fast Fourier transform (FFT). After the calibration pro-cedure, the original waveforms are obtained through the inverse FFT (IFFT).
The WPIA calculation uses waveforms in the frequency range of up to 20 kHz for both the electric and magnetic wave fields. The upper frequency limit is determined by the sampling frequency of 65 kHz. Moreover, an electric waveform of up to 120 kHz with a higher sampling fre-quency is prepared as a special mode in order to obtain the amplitude and phase of the waveform with better time resolution. The WPIA calculation uses data of the chorus waves. However, in the frequency range of up to 20 kHz, the MSW in hundreds of hertz and the ECH waves in the kilohertz frequency band are expected to be
Figure 2Process flow of WPIA.The electric and magnetic fields of the waveE1,E2,B1,B2, andB3obtained through calibration and the particle velocityV(t)are used in the WPIA calculation.
included in the waveforms observed by the ERG satel-lite, which passes outside the plasmapause. Such waves are observed by the sensors as superposed waves. Intense waves result in uncertainty fluctuation in the calculation of the WPIA. Therefore, the unnecessary wave compo-nents must be removed from the received waveforms through an appropriate processing.
Evaluation of phase error in waveform processing
Sampling frequency 65 kHz
Electron gyrofrequency at the equator:fce 10 kHz (L∼4) Chorus frequency (including upper
1 to 9 kHz (0.1 to 0.9fce) and lower bands)
Frequency sweep rate: df/dt 40 kHz/s
Duration time of a chorus element 200 ms
Amplitude Constant
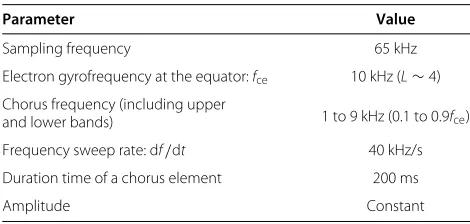
9 kHz with a frequency sweep rate of 40 kHz/s. The dura-tion of the model chorus is 200 ms. The parameters of the model chorus wave are listed in Table 1.
In conducting the FFT processing, we must consider the appropriate data length of one frame used in the FFT. Since the calculation in the WPIA requires only the cho-rus waveform, we remove the wave mode components of the MSW and ECH waves. In order to remove the waves, we implement the passband filter applying a rectangular window with a passband of 0.1 < f < 1.0fce. The MSW waves are observed in a frequency range of a few hun-dred kilohertz atL∼4 (Santolík et al. 2002), and the ECH waves appear in the frequency range off > fce (Kennel et al. 1970). In order to distinguish these waves from cho-rus waves in the frequency domain, a frequency resolution of better than 0.1fceis required. Considering the spectral spreading of the waves, we assume a frequency resolution of a few hundred hertz. In order to satisfy the above con-ditions, we assume a frequency resolution of 127 Hz, cor-responding to 512 data points and a time duration of 7.8 ms in an FFT frame. A longer FFT length provides a more accurate frequency resolution and limits the increase in computation time due to repeated FFT processing, but results in an increased memory requirement.
Figure 3 shows a time-frequency spectrogram of the model chorus wave. The sequence of FFTs is implemented for the waveform without overlapping of the frames. The time and frequency resolutions are 7.8 ms and 127 Hz, respectively. In addition, passband filtering in the fre-quency range of 0.1<f <1.0fceis applied for each frame. The upper and lower cutoff frequencies are indicated by dashed lines. We then allow the power spectral density of chorus waves to become zero outside the frequency range. The spectral bins of rising chorus waves vary with the frequency step of df/dt×7.8 ms. When using a rectangu-lar window, the resulting frequency spectrum spreads in a wide frequency range due to characteristics of the non-periodic waveform. In this wave model, the frequency of the chorus waves is assumed to be from 0.1 to 0.9fceand subsequently increases over time. Since the broadening of the power spectral density occurs through FFT process-ing, the power of the chorus waves is lost by the passband
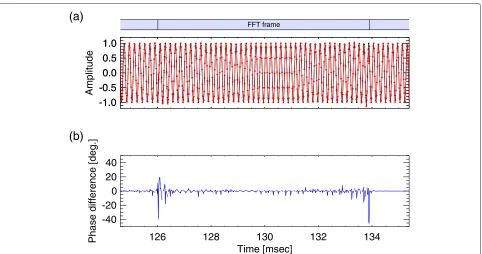
After processing the passband filtering in the frequency domain, we transform the spectra to a waveform in the time domain by applying the IFFT. Figure 4 shows the amplitudes and the phase angle difference between the original waveform and the waveform after passband fil-tering in the time interval oft = 123 to 135 ms, which corresponds to a chorus element of approximatelyf = 5 kHz. The instantaneous phase angle at each sampling time is calculated from the wave amplitude, assuming a sinusoidal time-varying waveform. The dots in Figure 4a indicate the sampling points. In Figure 4a, as a result of passband filtering, the wave amplitudes around the edges of the FFT frame (t=126 and 134 ms), which is shown at the top of Figure 4, are remarkably perturbed. The phase differences are then visible as errors (Figure 4b). Since the time interval shown in Figure 4 (t =125 to 135 ms) cor-responds to the central frequency of the model chorus wave, the removal effect of the power spectrum in the tail part is reduced. However, the phase angle errors below approximately 5° exist over the entire waveform. In par-ticular, the phase errors are maximized at the edges of a frame, whereas the error reaches up to 40°. In the WPIA, the accuracy of the relative phase angle is important for the calculation of the inner product of the wave vector and the particle velocity vector. Since phase angle errors generate perturbations for a quantity of calculated energy transfer, the error should be removed for calculation in the WPIA.
Overlapping processing
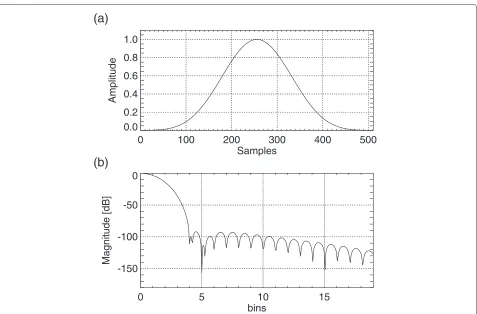
We consider the efficient processing of wave data for the reduction of the errors. The phase error of a waveform after IFFT processing occurs due to the implementation of passband filtering in the frequency domain. The operation of taking a rectangular window in each FFT frame results in a wide spectra. Therefore, an appropriate window func-tion should be used in order to suppress the spreading of the frequency spectra. In the present study, we adopt the four-term Blackman-Harris window function (hereinafter 4BH) (Harris 1978). The characteristics of the 4BH are shown in Figure 5. The amplitude of the window func-tion using 512 data samples is symmetric and has a finite value at both edges (Figure 5a). The spectrum obtained by the discrete Fourier transform (DFT) shows that the main lobe is wider in the frequency domain, whereas the levels of the side lobes are well suppressed near the main lobe (Figure 5b). The small leakage of the spectral power in the side lobes prevents the loss resulting from the passband filtering.
Figure 3Time-frequency spectrograms for the model chorus wave.The dashed lines are the upper and lower cutoff frequencies of the passband filter.
The phase errors that exist over a frame in Figure 4b are removed by taking the window function (Figure 6b). However, the amplitudes of the side lobes do not become completely zero in the frequency domain. Spectral leakage still remains at the tail of the spectra. This leakage is fil-tered through passband filtering, resulting in phase errors at the edges of the frame.
In order to remove the phase errors, we adopt overlap-ping processing of the FFT frame. For simplicity of wave-form processing, we use 50% overlapping of the frame. In
order to perform the overlapping processing, we multiply one FFT frame in the entire waveform by the 4BH window. We then obtain the waveform in the time domain by IFFT after applying passband filtering. Since the amplitudes of the waveform influence the multiplied window function in the time domain, a processing that multiplies the wave-form by an inverse function of the window function is required. Due to the passband filtering, a certain discon-tinuity remains at both edges of the waveform. We then remove one-quarter of the data length at both edges of the
-1.0 -0.5 0.0 0.5 1.0
-1.0 -0.5 0.0 0.5 1.0
Amplitude
126 128 130 132 134
Time [msec] -40
-20 0 20 40
Phase difference [deg.]
(a)
(b)
FFT frame
0 100 200 300 400 500 Samples
0.0 0.2 0.4 0.6 0.8 1.0
Amplitude
0 5 10 15
bins -150
-100 -50 0
Magnitude [dB]
(b)
Figure 5Characteristics of the four-term Blackman-Harris window function.(a)Amplitudes for 512 samples.(b)A portion of frequency responses (positive frequencies) by DFT.
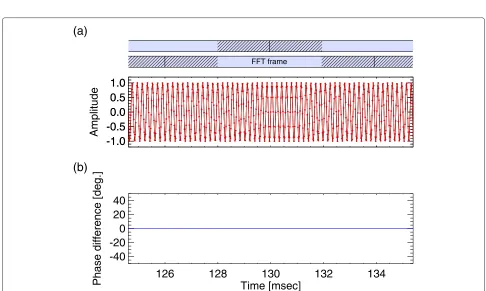
frame where significant discontinuities are present and use the center half-length of the obtained waveform. The overlapped sequence is shown schematically at the top of Figure 7a. The hatched lengths are removed through the processing. Thereafter, the 50% overlapped frame is used as subsequent FFT processing. The waveform obtained through the sequential overlapped processing is shown in Figure 7. Unlike the case of no overlapping shown in Figure 4, no phase errors exist in the time interval. Note that, even using the method with the 4BH window and the overlapping processing, phase errors with a few degrees occur locally. The appearance frequency of the phase error and its magnitude are remarkable at the frequency band of the chorus waves, which is close to the upper or lower frequency cutoff. The 50% overlapping processing of FFT approximately doubles the computation time compared to that without overlapping.
The waveform processing is summarized as follows:
1. Using 512 data points (7.8 ms) in one FFT frame 2. Multiplying the frame by the four-term
Blackman-Harris window
3. Conversion to the frequency domain by FFT 4. Calibration using transfer functions
5. Using a passband filter (f =0.1∼1.0fce) to obtain
the frequency band of the chorus wave 6. Conversion to the time domain by IFFT 7. Using the waveform after removing one-quarter
length from both edges of the frame
Pseudo-measurement of WPIA in simulation
-1.0
-0.5
0.0
0.5
1.0
-1.0
-0.5
0.0
0.5
1.0
Amplitude
126
128
130
132
134
Time [msec]
-40
-20
0
20
40
Phase difference [deg.]
(a)
(b)
FFT frame
Figure 6Wave amplitudes and phase differences.Analogous to Figure 4:(a)Amplitudes of the model chorus wave. Waveform to which passband filtering is applied after taking the window function (red). The original waveform is plotted for comparison (black). The dots indicate the sampling data points. The FFT frames are shown at the top.(b)Instantaneous phase differences of the waveforms in(a).
-1.0
-0.5
0.0
0.5
1.0
-1.0
-0.5
0.0
0.5
1.0
Amplitude
126
128
130
132
134
Time [msec]
-40
-20
0
20
40
Phase difference [deg.]
(a)
(b)
FFT frame
Time step 0.005e0
Grid spacing 0.01c−e01
Number of grids 32,768
Total number of energetic electrons 536,870,912
Total number of cold electrons 134,217,728
Density ratio of energetic electrons to cold electrons 7.40×10⁻³ Thermal velocities of energetic electrons
0.24c, 0.36c at the equator,Vth,Vth⊥
respectively, of thermal velocities. The density ratio of energetic to cold electrons is 7.4×10⁻³. Background ions are assumed to satisfy the charge neutralization. The other simulation parameters are listed in Table 2.
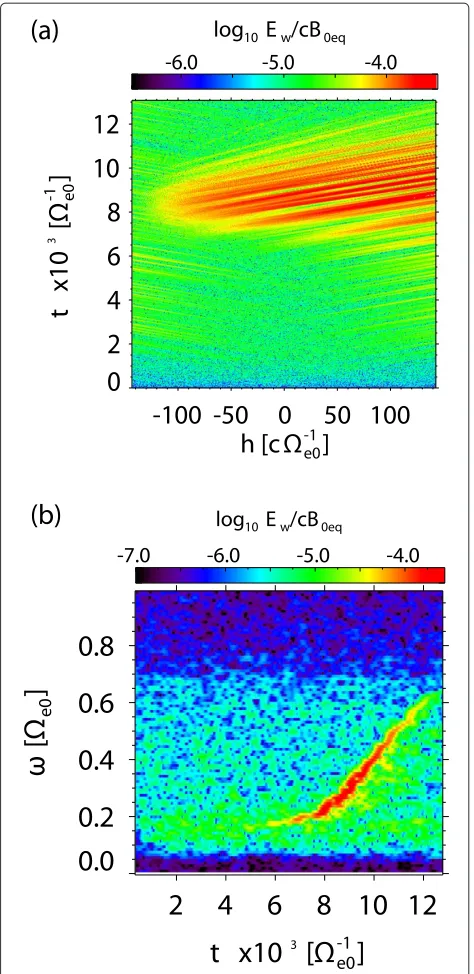
Figure 8 shows the simulation results, which we use in the pseudo-WPIA measurement. In the simula-tion, whistler-mode chorus waves are generated through nonlinear cyclotron resonant interaction between back-ground thermal noise and anisotropic energetic reso-nant electrons. The wave growth starts from thermal fluctuations through a linear wave growth by temper-ature anisotropy of energetic electrons. Then, the gen-erated whistler-mode waves propagate toward higher latitudes from near the magnetic equator (Figure 8a). Figure 8b shows the time-frequency spectrogram of gen-erated rising-tone chorus waves at positionh=40c−e01, where c is the speed of light and e0 is the equato-rial electron gyrofrequency. Coherent rising-tone waves are formed due to the nonlinear wave growth, once the growing wave amplitude exceeds a threshold (Omura et al. 2009).
We then conduct the pseudo-WPIA measurement using the rising chorus element obtained in the simulation. The passband filtering and overlapping method are applied in the WPIA measurement. In order to conduct the WPIA measurement, we calculate the quantity of the energy transferW using the instantaneous waveform at a fixed point, h = 40 c−e01, and the velocity vectors of reso-nant electrons passing through the point. We focus on the component ofW that is perpendicular to the ambi-ent magnetic field. The W component is given by the formula W = eEw ·v⊥ for the transverse component, where e is the electron charge, andEw andv⊥ are per-pendicular components of the wave electric field and the velocity vector of the electron, respectively. In order to statistically evaluate the quantity of energy transfer, we then calculate the integrated Wintduring a certain time interval. In the simulation, the intense generated rising chorus waves propagate toward the positivehregion and resonate with counter-streaming energetic electrons hav-ing negative parallel resonance velocity with respect to the
-7.0
-6.0
-5.0
-4.0
Figure 8Transverse components of wave electric fieldEwof
generated whistler-mode chorus waves in simulation.
(a)Temporal evolution of the propagating waves along the field line. (b)Time-frequency spectrogram of the generated whistler-mode rising chorus waves ath=40c−e01.
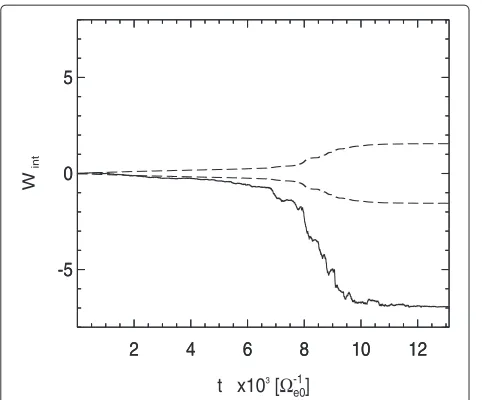
ambient magnetic field direction. Although only electrons near a specific resonance velocity involve cyclotron reso-nance with whistler-mode waves, all electrons are used in the calculation ofWint.
-5
Figure 9Time evolution ofWintcalculated using waveform of
reproduced chorus waves and energetic electrons in simulation. The dashed lines indicate the standard deviation 2σw.
as a function of time. In order to evaluate the statistical significance ofWint, the standard deviations 2σwgiven in Equation 2 are plotted (dashed line). Once coherent rising chorus waves are generated (t>6, 000−e01), the absolute value ofWintincreases significantly above 2σw. The transi-tion ofWinttoward negative values implies that an energy transfer occurs from energetic electrons to chorus waves. In order to examine the waveform processing, the amplitudes of dummy MSW and ECH waves are added. The pseudo-waveforms of the MSW and ECH waves are superposed on chorus waveform reproduced in the simu-lation. We assume the superposed waves in the frequen-cies of 0.6fLHR for MSW and 1.5fce for ECH waves. The wave amplitudes are comparable to that of chorus waves and are added to one component of transverse wave elec-tric fields in the simulation. We note that the MSW and ECH waves do not resonate with electrons in the one-dimensional simulation, namely no phase correlation with electrons. The added waves only give an amplitude modu-lation to chorus waves. We then apply the passband filter-ing and overlappfilter-ing method for the WPIA measurement in the simulation. Figure 10 shows theWintwith passband filtering (blue) and with passband filtering and overlap-ping method with the 4BH window function (red). The dashed lines indicate the standard deviations 2σw. After chorus waves appear, the quantity of bothWint is simi-lar because the chorus wave amplitude is simi-larger compared to fluctuations due to the phase errors. Before chorus waves appear, in case using only the passband filtering, the quantity ofWintis close to the 2σw. In case using the pro-cessing of the passband filtering and the overlapping, the absolute value ofWint is larger than the 2σw, as a result
Figure 10Time evolution ofWintwith passband filtering (blue)
and with passband filtering and overlapping (red).TheWintare calculated using the waveform of reproduced chorus waves and energetic electrons in the simulation. The dashed lines indicate the standard deviation 2σw.
that the absolute value of the standard deviation becomes small. By applying the implementation of the overlapping method, the unnecessary discontinuity of the wave phase is removed. The processing method makes the larger sta-tistical significance, giving a more accurate evaluation of the energy transfer.
Conclusions
The WPIA is a software function installed on the ERG satellite. In the WPIA calculation, we presented a pro-cessing method to reduce the errors of the wave phase in order to accurately evaluate the statistical significance of the energy transfer. The WPIA processing using the FFT and IFFT is costly. Moreover, the proposed overlapping processing of the waveform requires more computation time compared to that without overlapping. The com-putation resources (e.g., CPU clock, memory size, and bus width) are limited for the onboard data process-ing. We next address the evaluation of data processing speed and optimization of the software algorithm of the WPIA.
mation such as the plasma density for the evaluation of the resonance condition, by referring to the linear disper-sion of the whistler wave mode. The influence of ECH and MSW waves on the WPIA measurement should be eval-uated by a self-consistent multi-dimensional simulation and is left for the future study.
In the particle simulation, a coherent rising-tone ele-ment with the enhanced nonlinear wave growth (t > 6, 000−e01) is formed after moderate linear wave growth of incoherent whistler-mode waves. The WPIA measure-ment demonstrated significant energy transfer from an energetic electron to a whistler-mode chorus wave which occurs during the generation of the coherent rising chorus element. During the period oft<6, 000−e01in which the linear wave growth occurs near the frequencyω=0.2e0, the WPIA measurements indicate the gradual increase of the quantityW, exceeding the 2σw(Figure 10).
The main goal of the WPIA is to directly measure the quantity of energy transfer between whistler-mode cho-rus waves and resonating energetic electrons in the space plasma environment. In order to statistically evaluate the quantity of energy transfer, it is important to obtain accu-rate phase angles of the wave vector and the velocity vector of a particle. In addition to chorus waves, various other waves are included in the observed waveform, which affects the accuracy of the calculated quantity of energy transfer. The wave modes are removed through the pass-band filtering. However, the removed spectrum causes undesirable phase angle errors of the waveform. In order to reduce the phase errors, the overlapping processing is applied using an appropriate window function. The pro-cessing shows that the phase angle errors are improved successfully. The proposed waveform processing method is necessary in order to reduce the phase error and is applicable to the calculation of theWPIA.
Competing interests
The authors declare that they have no competing interests.
Authors’ contributions
MH carried out the analyses of the work. YK and HK were involved in the discussion of the results and revised the manuscript. All authors read and approved the final manuscript.
Acknowledgements
This paper is dedicated to Prof. Takayuki Ono, who passed away on 21 December 2013. The computations in the present study were performed on the KDK system of RISH and ACCMS at Kyoto University. This work was supported by grant-in-aid 23224011 of the Ministry of Education, Culture, Sports, Science and Technology in Japan.
Author details
1Department of Geophysics, Graduate School of Science, Tohoku University, Miyagi 980-8578, Japan.22 Solar-Terrestrial Environment Laboratory, Nagoya University, Nagoya, Aichi 464-8601, Japan.3Research Institute for Sustainable Humanosphere, Kyoto University, Kyoto 611-0011, Japan.
References
Burtis WJ, Helliwell RA (1969) Banded chorus–a new type of VLF radiation observed in the magnetosphere by OGO 1 and OGO 3. J Geophys Res 74:3002
Fukuhara H, Kojima H, Ueda Y, Omura Y, Katoh Y, Yamakawa H (2009) A new instrument for the study of wave-particle interactions in space: One-chip Wave-Particle Interaction Analyzer. Earth Planets Space 61:765 Gurnett DA (1976) Plasma wave interactions with energetic ions near the
magnetic equator. J Geophys Res 81(16):2765–2770
Harris FJ (1978) On the use of windows for harmonic analysis with the discrete fourier transform. Proc IEEE 66:51–83
Hikishima M, Yagitani S, Omura Y, Nagano I (2009a) Full particle simulation of whistler-mode rising chorus emissions in the magnetosphere. J. Geophys. Res 114:A01203. 10.1029/2008JA013625
Hikishima M, Yagitani S, Omura Y, Nagano I (2009b) Coherent nonlinear scattering of energetic electrons in the process of whistler mode chorus generation. J Geophys Res 114:A10205. 10.1029/2009JA014371 Hikishima M, Omura Y, Summers D (2010) Microburst precipitation of
energetic electrons associated with chorus wave generation. Geophys Res Lett 37:07103. 10.1029/2010GL042678
Katoh Y, Kitahara M, Kojima H, Omura Y, Kasahara S, Hirahara M, Miyoshi Y, Seki K, Asamura K, Takashima T, Ono T (2013) Significance of Wave-Particle Interaction Analyzer for direct measurements of nonlinear wave-particle interactions. Ann Geophys 31:503–512. 10.5194/angeo-31-503-2013 Kennel CF, Scarf FL, Fredricks RW, McGehee JH, Coroniti FV (1970) VLF electric
field observations in the magnetosphere. J Geophys Res 75:6136–6152 Meredith NP, Horne RB, Iles RH, Thorne RM, Heynderickx D, Anderson RR (2002)
Outer zone relativistic electron acceleration associated with
substorm-enhanced whistler mode chorus. J Geophys Res 107(A7):1144. 10.1029/2001JA900146
Meredith NP, Horne RB, Thorne RM, Anderson RR (2009) Survey of upper band chorus and ECH waves: implications for the diffuse aurora. J Geophys Res 114(A07218). 10.1029/2009JA014230
Miyoshi Y, Ono T, Takashima T, Asamura K, Hirahara M, Kasaba Y, Matsuoka A, Kojima H, Shiokawa K, Seki K, Fujimoto M, Nagatsuma T, Cheng CZ, Kazama Y, Kasahara S, Mitani T, Matsumoto H, Higashio N, Kumamoto A, Yagitani S, Kasahara Y, Ishisaka K, Blomberg L, Fujimoto A, Katoh Y, Ebihara Y, Omura Y, Nose M, Hori T, Miyashita Y, et al. (2013) The energization and radiation in geospace (ERG) project. In: Summers D, Mann IR, Baker DN, Schulz M (eds) Dynamics of the earth’s radiation belts and inner magnetosphere. American Geophysical Union, Washington, D.C
Omura Y, Hikishima M, Katoh Y, Summers D, Yagitani S (2009) Nonlinear mechanisms of lower-band and upper-band VLF chorus emissions in the magnetosphere. J Geophys Res 114(A07217). 10.1029/2009JA014206 Santolík O, Pickett J, Gurnett D, Maksimovic M, Cornilleau-Wehrlin N (2002)
Spatiotemporal variability and propagation of equatorial noise observed by cluster. J Geophys Res 107(A12):1495. 10.1029/2001JA009159 Summers D, Thorne RM, Xiao F (1998) Relativistic theory of wave-particle
resonant diffusion with application to electron acceleration in the magnetosphere. J Geophys Res 103(A9):20487–20500
Tsurutani BT, Smith EJ (1974) Postmidnight chorus: a substorm phenomenon. J Geophys Res 79(1):118–127
doi:10.1186/1880-5981-66-63
Cite this article as:Hikishimaet al.:Evaluation of waveform data processing