P R O C E E D I N G S
Open Access
Effect of population stratification analysis on
false-positive rates for common and rare variants
Hua He
1
, Xue Zhang
1
, Lili Ding
1
, Tesfaye M Baye
2,3
, Brad G Kurowski
3,4
, Lisa J Martin
1,3,5*
From
Genetic Analysis Workshop 17
Boston, MA, USA. 13-16 October 2010
Abstract
Principal components analysis (PCA) has been successfully used to correct for population stratification in
genome-wide association studies of common variants. However, rare variants also have a role in common disease etiology.
Whether PCA successfully controls population stratification for rare variants has not been addressed. Thus we
evaluate the effect of population stratification analysis on false-positive rates for common and rare variants at the
single-nucleotide polymorphism (SNP) and gene level. We use the simulation data from Genetic Analysis Workshop
17 and compare false-positive rates with and without PCA at the SNP and gene level. We found that SNPs
’
minor
allele frequency (MAF) influenced the ability of PCA to effectively control false discovery. Specifically, PCA reduced
false-positive rates more effectively in common SNPs (MAF > 0.05) than in rare SNPs (MAF < 0.01). Furthermore, at
the gene level, although false-positive rates were reduced, power to detect true associations was also reduced
using PCA. Taken together, these results suggest that sequence-level data should be interpreted with caution,
because extremely rare SNPs may exhibit sporadic association that is not controlled using PCA.
Background
Genome-wide association studies (GWAS) have proved to
be successful in identifying common single-nucleotide
polymorphisms (SNPs) associated with complex and
com-mon traits [1,2]. One of the comcom-mon problems in
popula-tion-based GWAS is population stratification. Several
approaches have been used to correct population
stratifi-cation, including genomic control, structured association,
and principal components analysis (PCA) [3,4]. PCA is
used to infer axes of genetic variation that can be
inter-preted as describing continuous ancestral heterogeneity
within a group of individuals [5]. Its effectiveness has been
shown on common variants [3,6,7]. However, recent
stu-dies have demonstrated the importance of multiple rare
variants in the etiology of complex diseases [8-10]. It is
not clear whether PCA works on rare variants. Thus our
purpose in this paper is to evaluate the effect of PCA on
false-positive rates for common and rare variants at the
SNP and gene level.
Methods
We conduct all analyses using the 200 replicates of the
unrelated individuals data simulated for Genetic Analysis
Workshop 17 (GAW17), with the knowledge of the
under-lying simulation model [11]. We focus on the normally
distributed phenotype Q1. Age, Sex, and Smoke status are
included as covariates. Because most causal variants
dis-covered so far are functional, we focus on nonsynonymous
SNPs in the current study. We define variants with minor
allele frequency (MAF) less than 1% as rare, and those
with a MAF larger than 5% as common. To determine the
significance level, we apply a
linkage-disequilibrium-adjusted Bonferroni correction using a mean linkage
dise-quilibrium correlation of 0.138 among common SNPs.
We assess association of Q1 with a gene or SNP using
linear regression. At the SNP level, association is analyzed
with an additive model. At the gene level, we use three
methods to collapse rare variants within a gene: indicator,
proportion, and data-adaptive sum test methods. The
indi-cator and data-adaptive sum test methods are described in
the GAW17 background methods paper [12]. We simplify
the data-adaptive sum test without doing permutation. The
proportion method was previously described by Morris
* Correspondence: [email protected]
1
Division of Biostatistics and Epidemiology, Cincinnati Children
’
s Hospital
Medical Center, Cincinnati, OH 45229, USA
Full list of author information is available at the end of the article
and Zeggini [2]. Briefly, let
n
i
denote the number of rare
variants successfully genotyped for subject
i, and let
r
i
be
the number of these variants at which the variant carries at
least one copy of the minor allele. We define a new variable
S
i
=
r
i
/n
i
, the proportion of loci within a gene at which a
subject carries a minor allele.
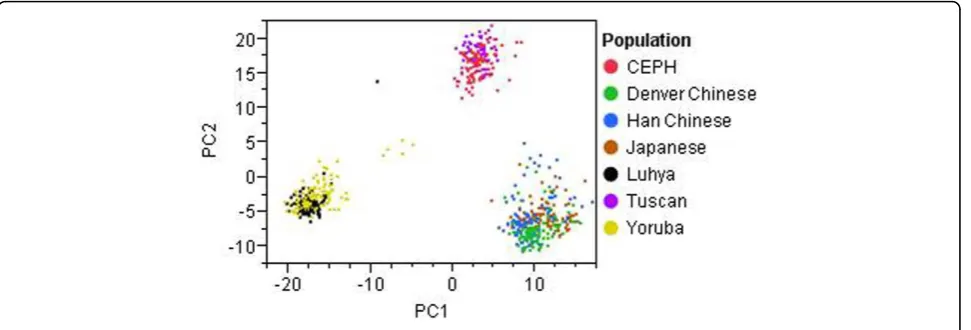
The GAW17 unrelated individuals data are divided into
seven populations (CEPH [European-descended residents
of Utah], Denver Chinese, Han Chinese, Japanese, Luhya,
Tuscan, Yoruba) and thus may be susceptible to a form
of confounding known as population stratification if the
SNP or gene shows marked variation in allele frequency
across subpopulations and if these subgroups also differ
in their baseline risk of the disease [13]. To account for
population stratification, we perform PCA using 1,379
common nonsynonymous SNPs (MAF > 0.05) to infer
continuous axes of genetic variation. The first two
princi-pal components reveal clear distinctions among the three
human ancestral origins (European, Asian, and African),
accounting for 10.4% and 6.6% of the total variation,
respectively (Figure 1). We use the first three principal
components as covariates to adjust for population
strati-fication based on the scree plot.
Results
Figure 2 shows the results of the single-SNP analysis for
1,379 common SNPs with and without PCA. We use the
95% quantile of the 200
p-values to represent the overall
results of the 200 replicates. In the simulation, Q1 is
influ-enced by 39 SNPs in 9 genes, including 2 common SNPs
(MAF > 0.05) and 32 rare SNPs (MAF < 0.01). Our
analy-sis detected the two causal common SNPs before and after
population stratification adjustment. C13S523 has a
rela-tively high MAF (0.165) with mild effect, and C4S1878 has
a lower MAF (0.067) with moderate effect. In the analysis
without PCA, 144 null SNPs were declared significant,
leading to a false-positive rate (type I error) of 144/1,377 =
0.105. The false-positive rate dropped to 0 after adjusting
for population stratification. Figure 3 is the Manhattan
plot of 10,648 rare SNPs before and after PCA. Forty-four
null SNPs were declared significant before PCA and 21
null SNPs were declared significant after PCA, leading to
type I errors of 0.004 and 0.002, respectively.
These results suggest a MAF-dependent effect of PCA.
We next examined the absolute difference in
−
log
10
(
p
-value) before and after PCA for various MAFs (Figure 4).
Our results show that the median difference increases
with MAF. When comparing SNPs with low MAF (<0.01)
with those with high MAF (>0.05), we detected statistical
significance (Wilcox rank sum test,
p
< 2.2 × 10
−
16
). These
results suggest that principal components adjust the
p-value more substantively for higher MAF SNPs.
We also tested association at the gene level. We
com-pared three collapsing methods before and after PCA
(Figure 5). Before adjusting for population stratification,
for all methods, three causal genes (KDR,
FLT1, and
VEGFC
) were declared significant. Twenty-nine, 29, and
35 null genes were falsely detected for the indicator,
pro-portion, and data-adaptive sum test methods, respectively
(type I errors of 0.016, 0.016, and 0.020, respectively).
After adjusting for population stratification, we detected
two causal genes. The number of falsely detected genes
was reduced dramatically to four, four, and seven, leading
to type I errors of 0.0022, 0.0022, and 0.0039 for the
indi-cator, proportion, and data-adaptive sum test methods,
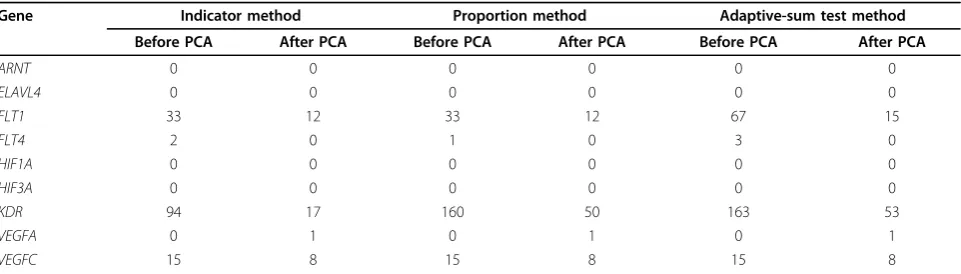
respectively. We then explored the effect of PCA on
power. Table 1 describes the number of times each causal
gene was detected across 200 simulations for the three
methods. Overall, power to detect genes in individual
replicates was low; only
KDR
was identified at greater
than 80% power without PCA adjustment. Furthermore,
with PCA adjustment, power dropped to about 25% for
KDR
. Comparing the three methods, we found that the
indicator method had lower power to detect
KDR
with or
without PCA adjustment. Adjustment for population
stratification greatly reduced the number of false
posi-tives but also reduced the power to detect true genes.
We also investigated the effect of population
stratifi-cation on phenotypes Q2 and Q4 (data not shown).
Q2 showed the same pattern as Q1, supporting our
contention that PCA does not perform well for rare
variants. Q4 is not associated with any SNPs and thus
is used to assess the effect of PCA on false-positive
rates. No significant association was identified before
and after PCA. The effect of population stratification
appeared to diminish.
●
log10(P value)
●●
log10(P value)
●
Figure 2
Manhattan plot of 1,379 common nonsynonymous SNPs (MAF > 0.05).
Top panel: before PCA adjustment. Bottom panel: after
PCA adjustment. Dashed line corresponds to the linkage-disequilibrium-adjusted Bonferroni significance level of 9.8 × 10
−5.
●
log10(P value)
●
power = 0.094
●
log10(P value)
●● ●●●● ●●●
power = 0.094
Figure 3
Manhattan plot of 10,648 rare nonsynonymous SNPs (MAF < 0.01)
. Top panel: before PCA adjustment. Bottom panel: after PCA
Discussion and conclusion
Using the GAW17 mini-exome data set, we have
demonstrated that the MAF of SNPs influences the
abil-ity of PCA to effectively control false discovery.
Specifi-cally, PCA reduced false-positive rates more effectively
in common SNPs than in rare SNPs. At the gene level,
although false-positive rates were reduced, the power to
detect true associations was also reduced using PCA.
Consistent with previous studies, PCA efficiently
cor-rects for population stratification for common variants
●[0,0.001)
[0.001,0.005)
[0.005,0.01)
[0.05,0.1)
[0.1,0.3)
[0.1,0.5]
0.0
0.2
0.4
0.6
0.8
Minor allele frequency
Absolute difference in
í
log10(P value)
Figure 4
Boxplot of the absolute difference in
−
log10(
p
-value) before and after PCA by MAF
●
log10(P value)
● ●
Indicator
type I error = 0.016power = 0.33●
log10(P value)
● ●
Proportion
type I error = 0.016power = 0.33●
log10(P value)
●●
Data
−
Adaptive Sum Test
type I error = 0.020power = 0.33●●
log10(P value)
● ●
Indicator
type I error = 0.0022power = 0.22●●
log10(P value)
● ●
Proportion
type I error = 0.0022power = 0.22●●
log10(P value)
● ●
Data
−
Adaptive Sum Test
type I error = 0.0039power = 0.22Figure 5
Manhattan plot of genes for the three collapsing methods.
Left panels: before PCA adjustment. Right panels: after PCA
[3,6,7]. For rare variants, using principal components
to adjust for population stratification also reduces the
type I error but does not improve the power to detect
causal variants. Importantly, we noticed that two
cau-sal rare SNPs (C4S1877 and C4S1889) were private
SNPs and exhibited the mutant genotype in a single
person (NA07347). For the other 14 nonsynomymous
SNPs that exhibited strong association (C1S3619,
C1S6350, C1S8205, C2S3362, C2S3482, C2S3613,
C3S4002, C4S4650, C6S4373, C7S1247, C10S5614,
C12S2922, C12S4373, and C13S768), the mutant form
was also present only in individual NA07347. The
mutant genotype is not very likely to distinguish the
null SNPs from the two true causal SNPs because of
identical genotype. Thus studies using sequence-level
data should exhibit caution when interpreting the
causality of extremely rare SNPs because these may be
sporadic.
For the gene-level analysis, each method was
under-powered to identify genes harboring rare causal variants,
with none of the methods identifying more than 50% of
the genes at a 50% success rate. All three methods had
deflated type I error and low power. When comparing
performance across the three methods, we found that the
indicator method had the lowest power but that the
data-adaptive sum test method was more susceptible to
false-positive associations. These results suggest that PCA can
be an effective method for reducing false positives in
gene-level analyses, but there will be reduced power.
We applied PCA to genotype data to infer continuous
axes of genetic variation. The principal components
cap-ture the continuous ancestral heterogeneity across
sub-populations, which aligns well with common SNPs. But
for rare SNPs, PCA does not correct for the sparse
nat-ure and sudden heterogeneity exhibited by rare variants.
The linkage disequilibrium between rare variants is not
as stable as the linkage disequilibrium between common
SNPs, making it harder to adjust for population
stratifi-cation. For rare variants as extreme as private SNPs,
with the mutant genotype existing only in a single
per-son, PCA using common variants may not be applicable
to correct population stratification.
Acknowledgments
The Genetic Analysis Workshops are supported by National Institutes of
Health (NIH) grant R01 GM031575 from the National Institute of General
Medical Sciences. We would also like to acknowledge NIH grants R01
NS036695, K24 HL69712, K01 HL103165, K12 HD001097-14, and U19
A1070235.
This article has been published as part of
BMC Proceedings
Volume 5
Supplement 9, 2011: Genetic Analysis Workshop 17. The full contents of the
supplement are available online at
http://www.biomedcentral.com/1753-6561/5?issue=S9.
Author details
1Division of Biostatistics and Epidemiology, Cincinnati Children
’
s Hospital
Medical Center, Cincinnati, OH 45229, USA.
2Division of Asthma Research,
Cincinnati Children
’
s Hospital Medical Center, Cincinnati, OH 45229, USA.
3
Department of Pediatrics, University of Cincinnati School of Medicine,
Cincinnati, OH 45267, USA.
4Physical Medicine and Rehabilitation, Cincinnati
Children
’
s Hospital Medical Center, Cincinnati, OH 45229, USA.
5Division of
Human Genetics, Cincinnati Children
’
s Hospital Medical Center, Cincinnati,
OH 45229, USA.
Authors
’
contributions
HH carried out the design of the study, performed the statistical analysis and
drafted the manuscript. XZ participated in the discussion and helped to
draft the manuscript. LD, TMB and BGK participated in the discussion and
helped to edit the manuscript. LJM conceived of and oversaw the study,
and helped to draft the manuscript. All authors read and approved the final
manuscript.
Competing interests
The authors declare that there are no competing interests.
Published: 29 November 2011
References
1.
Baye TM, Martin LJ, Khurana Hershey GK:
Application of genetic/genomic
approaches to allergic disorders.
J Allergy Clin Immunol
2010,
126:425-436.
2.
Morris AP, Zeggini E:
An evaluation of statistical approaches to rare
variant analysis in genetic association studies.
Genet Epidemiol
2010,
34:188-193.
3.
Price AL, Patterson NJ, Plenge RM, Weinblatt ME, Shadick NA, Reich D:
Principal components analysis corrects for stratification in genome-wide
association studies.
Nat Genet
2006,
38:904-909.
4.
Devlin B, Roeder K:
Genomic control for association studies.
Biometrics
1999,
55:997-1004.
Table 1 Number of replicates with true discovery for the causal genes before and after PCA adjustment
Gene
Indicator method
Proportion method
Adaptive-sum test method
Before PCA
After PCA
Before PCA
After PCA
Before PCA
After PCA
ARNT
0
0
0
0
0
0
ELAVL4
0
0
0
0
0
0
FLT1
33
12
33
12
67
15
FLT4
2
0
1
0
3
0
HIF1A
0
0
0
0
0
0
HIF3A
0
0
0
0
0
0
KDR
94
17
160
50
163
53
VEGFA
0
1
0
1
0
1
5.
Rosenberg NA, Mahajan S, Ramachandran S, Zhao C, Pritchard JK,
Feldman MW:
Clines, clusters, and the effect of study design on the
inference of human population structure.
PLoS Genet
2005,
1:e70.
6.
Hoggart CJ, Parra EJ, Shriver MD, Bonilla C, Kittles RA, Clayton DG,
McKeigue PM:
Control of confounding of genetic associations in
stratified populations.
Am J Hum Genet
2003,
72:1492-1504.
7.
Paschou P, Drineas P, Lewis J, Nievergelt CM, Nickerson DA, Smith JD,
Ridker PM, Chasman DI, Krauss RM, Ziv E:
Tracing substructure in the
European American population with PCA-informative markers.
PLoS
Genet
2008,
4:e1000114.
8.
Dickson SP, Wang K, Krantz I, Hakonarson H, Goldstein DB:
Rare variants
create synthetic genome-wide associations.
PLoS Biol
2010,
8:e1000294.
9.
Cirulli ET, Goldstein DB:
Uncovering the roles of rare variants in common
disease through whole-genome sequencing.
Nat Rev Genet
2010,
11:415-425.
10.
Schork NJ, Murray SS, Frazer KA, Topol EJ:
Common vs. rare allele
hypotheses for complex diseases.
Curr Opin Genet Dev
2009,
19:212-219.
11.
Almasy LA, Dyer TD, Peralta JM, Kent JW Jr., Charlesworth JC, Curran JE,
Blangero J:
Genetic Analysis Workshop 17 mini-exome simulation.
BMC
Proc
2011,
5(suppl 9):S2.
12.
Dering C, Pugh E, Ziegler A:
Statistical analysis of rare sequence variants.
Genet Epidemiol
2011,
X(suppl X):X-X.
13.
Thomas DC, Witte JS:
Point: population stratification
—
a problem for
case-control studies of candidate-gene associations?
Cancer Epidemiol
Biomarkers Prev
2002,
11:505-512.
doi:10.1186/1753-6561-5-S9-S116
Cite this article as:
He
et al
.:
Effect of population stratification analysis
on false-positive rates for common and rare variants.
BMC Proceedings
2011
5
(Suppl 9):S116.
Submit your next manuscript to BioMed Central
and take full advantage of:
•
Convenient online submission
•
Thorough peer review
•
No space constraints or color figure charges
•
Immediate publication on acceptance
•
Inclusion in PubMed, CAS, Scopus and Google Scholar
•