R E S E A R C H
Open Access
A novel segmentation method for uneven
lighting image with noise injection based
on non-local spatial information and
intuitionistic fuzzy entropy
Haiyan Yu
1,2*and Jiulun Fan
2Abstract
Local thresholding methods for uneven lighting image segmentation always have the limitations that they are very sensitive to noise injection and that the performance relies largely upon the choice of the initial window size. This paper proposes a novel algorithm for segmenting uneven lighting images with strong noise injection based on non-local spatial information and intuitionistic fuzzy theory. We regard an image as a gray wave in three-dimensional space, which is composed of many peaks and troughs, and these peaks and troughs can divide the image into many local sub-regions in different directions. Our algorithm computes the relative characteristic of each pixel located in the corresponding sub-region based on fuzzy membership function and uses it to replace its absolute characteristic (its gray level) to reduce the influence of uneven light on image segmentation. At the same time, the non-local adaptive spatial constraints of pixels are introduced to avoid noise interference with the search of local sub-regions and the computation of local characteristics. Moreover, edge information is also taken into account to avoid false peak and trough labeling. Finally, a global method based on intuitionistic fuzzy entropy is employed on the wave transformation image to obtain the segmented result. Experiments on several test images show that the proposed method has excellent capability of decreasing the influence of uneven illumination on images and noise injection and behaves more robustly than several classical global and local thresholding methods.
Keywords:Image segmentation, Local thresholding, Non local spatial constraint, Intuitionistic fuzzy theory
1 Introduction
Image segmentation, which is the extraction of an object from the background in an image, is one of the essential techniques in areas of image processing and computer vision [1, 2]. However, in some cases, some undesired disturbances in the thresholding segmentation process may generate a false segmentation result. Uneven light-ing is one of the leadlight-ing disturbance sources that can affect the segmentation result, which often is produced in the capturing of an image. The primary causes for the disturbance of uneven illumination are (a) the scene cannot be isolated from the shadows of other objects op-tically, (b) the light may be unstable in some cases, and
(c) the object is very large, and thus it creates an uneven light distribution [3].
Thresholding is a direct and effective technique for image segmentation. The thresholding techniques per-formed on gray-level images can be divided into two cat-egories, namely, bilevel and multilevel thresholding. In bilevel thresholding, pixels are classified into two different brightness regions as background and object. Multi-level thresholding is applied to more complex images, which contain several classes with different gray-level ranges.
Moreover, the current bilevel thresholding (binarization) techniques are usually divided into two classes, global and local thresholding. The global algorithms generally com-pute a threshold for an image. Most of the global methods originated in the twentieth century, i.e., the 1970s, which can be classified into several main categories. The first cat-egory is based on the shape of the histogram, such as * Correspondence:[email protected]
1School of Electronic Engineering, Xidian University, Xi’an 710071, China 2
School of Telecommunication and Information Engineering, Xi’an University of Posts & Telecommunications, Xi’an 710121, China
valley-seeking method [4] and histogram approximation method [5]. The second category is based on clustering al-gorithm, such as Otsu’s method and the fuzzy clustering method. The Otsu’s method [6] is one of the most clas-sical clustering methods, which segments an image by maximizing the between-class variance of the thresholded image. The fuzzy clustering [7] method is another classical global method that computes the fuzzy membership be-tween the pixel and the mean value of two classes and finds groups by applying cluster analysis. Entropy-based methods are the third category of global methods, such as the Shannon entropy-based method [8], the Tsallis entropy-based method [9], the Renyi entropy-based method [10, 11], and the fuzzy entropy-based method [12]. To improve the robustness to noise, the spatial infor-mation is taken into account and many modified versions of the Otsu method [13], the fuzzy entropy-based method [14, 15], the fuzzy clustering method [16–18], and the Renyi entropy-based method [19, 20] have emerged.
Meanwhile, a local method usually computes a different threshold for the neighbor of each pixel or for each appointed block in the image. Local thresholding algo-rithms are superior to global ones for segmenting uneven lighting images because they can select adaptive threshold values according to the local area information [21]. Neighbor-based and block-based methods are two major styles of local adaption methods. The neighbor-based methods compute a threshold for each pixel based on the statistics of the arrangement, i.e., the variance of its neigh-borhood region. For example, Bernsen [22] selects the threshold by a function of the highest and lowest grayscale values. In Niblack’s method [23], a pixel-wise threshold is calculated based on the standard deviation and the local mean of all pixels in the moving window over the gray image. Sauvola et al. [24, 25] first classify each window by content into text, picture, and background and then apply different segmentation rules to the various types of win-dow. Kim [26] modifies Sauvola’s algorithm by introducing more than one window size for the type of text. Moreover, in order to improve the above approaches for the deter-mination of the local threshold, several special features that are extracted in the pixel neighborhood are also taken into account, such as character stroke width [27] and gra-dient information [28]. In addition, Bradley and Roth [29] introduce spatial variations in lighting and propose a real-time adaptive thresholding technique which has strong robustness to lighting changes in the image by using the integral image of the input. Kim et al. [30] introduce a water flow model for document image binarization. In this model, an image surface is considered as a three-dimensional terrain which is composed of valleys and mountains. Then, they find the local characteristic of the original terrain by pouring some water onto the terrain and computing the filled water. Lastly, they apply a global
thresholding algorithm to find the text regions. Moreover, M. Valizadeh and E. Kabir in [31] improve the water flow model and propose an adaptive method to segment degraded document images.
Block-based methods are another category of local thresholding algorithms, which divide the image into dif-ferent sub-blocks. The sub-blocks are regarded as separate images and segmented by some principles. For example, Taxt [32] obtains the local threshold for each sub-block based on EM algorithm. Eikvil et al. [33] propose a fast text binarization method by segmenting the sub-blocks based on the Otsu method. Park et al. [34] improve Eik-vil’s method by segmenting the object sub-blocks with the Otsu method and the background sub-blocks based on their mean value. Huang et al. [3] propose a method that adaptively selects the block size. Chou et al. [35] discrim-inate the classification of the sub-blocks based on support vector machine (SVM) and segment the different sub-block types with different strategies.
However, there are still several problems in these local thresholding methods. First, the segmentation accuracies of these window merging methods greatly depend on the reasonable selection of the initial window size. Sec-ond, partitioning the image into several sub-blocks usu-ally leads to incoherent segmentation results between adjacent sub-blocks. Lastly, the existence of high noise level in the image may cause adjacent pixels of a pixel to contain abnormal features, thus leading to unsatisfactory segmentation results.
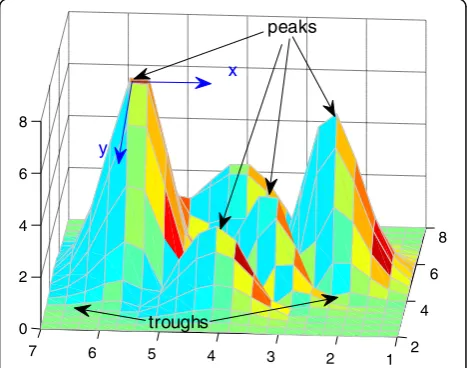
A wave transformation model, which is introduced by Wei et al., is a prospective idea for uneven lighting image segmentation [36]. They consider an image sur-face as a three-dimensional terrain that is composed of mountains and valleys, corresponding to peaks and troughs, respectively, and partition the sub-regions with the local peaks and troughs in multi-directions. Then, a wave transformation is performed on the grayscale waves in the local sub-region, and a matrix of multi-dimensional vectors is obtained. Lastly, the vectors are compressed to one dimension using the principal com-ponent analysis (PCA) method, and an Otsu global method is employed to find an optimal wave threshold for segmenting the matrix. This algorithm does not re-quire image partitioning and can yield good segmenta-tion results for uneven light images. However, there are two serious drawbacks of the method. First, it is very sensitive to noise since it does not take into consider-ation the spatial informconsider-ation in the wave transformconsider-ation. Second, when the variation of light intensity in the back-ground is too large, it may lead to misclassification of some pixels.
King [38] first introduce the fuzzy membership function and apply it in grayscale image processing. Then, many image segmentation algorithms based on the fuzzy the-ory are widely studied and are considered as efficient ways because they can describe the fuzzy uncertainty of images excellently [39]. Atanassov [40] proposes a novel concept of higher order FSs, i.e., intuitionistic fuzzy sets (IFSs), which provides a flexible mathematical frame to address the hesitancy derived from imprecise informa-tion. He describes the IFSs by two characteristic func-tions that express the degree of membership and the degree of non-membership, representing the degree of belongingness and non-belongingness, respectively, of elements to the IFS.
In this paper, we propose a novel local thresholding al-gorithm for segmenting uneven lighting images with noise injection. In particular, we introduce the idea of the wave transformation in Wei’s method and partition the image into sub-regions based on the local peaks and troughs in many straight lines extracted by rows and columns. Then, we perform the transformation of grayscale waves using fuzzy membership so that the relative characteristic (the local membership value) of each pixel substitutes its abso-lute characteristic (its gray level) to reduce the influence of uneven background light. Simultaneously, non-local spatial constraint and edge information obtained by the Sobel operator [41] are taken into account in order to avoid false peak and trough labeling caused by noise injec-tion and large variainjec-tion of light intensity. Lastly, we model the wave transformation image with the intuitionistic fuzzy theory and use a global intuitionistic fuzzy measure to segment the transformed image.
The rest of this paper is organized as follows. Section 2 introduces the wave transformation for images and intuitionistic fuzzy set theory. Section 3 describes our segmentation method. Section 4 presents the experimen-tal results and comparison with several well-known seg-mentation algorithms. Section 5 gives the conclusions.
2 Preliminaries
2.1 Wave transformation for computing the local characteristics of an image
In this section, we give a brief introduction to the wave transformation model proposed by Wei et al. [36], which is used to reduce the influence of uneven light on the segmentation of images.
There are many images where thebackground lighting is noticeablyuneven. For these images, it is unreasonable to classify them into objects and backgrounds only based on the absoluteness of the gray levels. However, the rela-tivity of the gray levels in local sub-regions can reflect the difference between the objects and the background. Therefore, in order to reduce the impact of uneven light on the segmented results, the grayscale wave model is
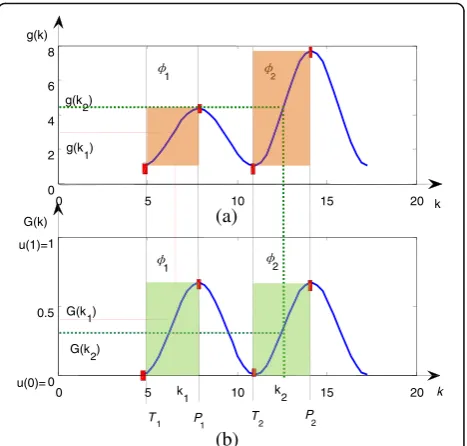
proposed by Wei et al. [36] to obtain the local character-istic of a pixel to replace its original gray level. Figure 1c shows the grayscale wave model. The idea of the wave transformation is as follows. First, the image can be treated as a gray wave in three-dimensional space com-posed of many local sub-regions. These sub-regions are obtained by finding the local peaks and troughs in a set of grayscale wave curves, which are extracted in turn from the image in several given directions. Suppose that in a sub-region, the pixels close by the peak correspond to the object, and the pixels close to the trough corres-pond to the background. The closeness degree of a pixel to the local peak or trough represents its relative charac-teristic and is used to substitute its absolute characteris-tic (its gray level) for segmenting the image. The closeness degree can be reflected by a membership de-gree and obtained by the wave transformation as follows. Given a directionx, a membership degree is assigned to a pixel according to its location in the local sub-region between two neighboring peak and trough. Especially, the membership degree of the pixel located at the peak is 1, while the membership degree of the pixel located at the trough is 0. Moreover, we can extract grayscale wave curves in several directions and perform the same wave transformation on the curves. Therefore, a pixel has n transformation values corresponding tondifferent direc-tions. Lastly, these values are pulled together for each pixel according to a principle, and a multi-direction wave transformation can be obtained for an image.
Intuitively speaking, the image can be viewed as waves of the gray pixels. For an individual pixel, its local char-acteristic is immediately concerned with the location in the corresponding wave. The pixel located at the peak of the wave has a relatively higher level, while the pixel lo-cated at the trough of the wave has a relatively lower
2
level. The location of the pixel in the local wave, namely, the wave transformation value that reflects the relative characteristic of a pixel in the local sub-region, can be used to replace its original gray level for segmenting images [36].
Definition 1.Extract a straight linefdin a given
direc-tiond, which consists ofKpixels. Letg(k) = {0, 1,⋯,L−1} represent the gray level of the linefd, wherek= 1, 2,…,K. Suppose that there aremlocal peaks, which are located at P1,P2,⋯, and m+ 1 local troughs, which are located at is a monotonous increasing function, and (xk,yk
)repre-sents the original coordinate of thekth pixel in the local sub-region ϕm= [Tm,Tm+ 1]. The transformation values of pixels in other local sub-regions are obtained in the same way. Then, we obtain the transformation wave vec-torG¼ wϕ1;wϕ2…;wϕm
of the linefd. The
transform-ation process is called one-dimentional (1D) gray scale
wave transformation.
Definition 2. Suppose the image has M straight lines
in direction d. Let fd,irepresent the i th straight line in direction d, where d=d1,d2,…,dn, and i= 1, 2,⋯,M.
Let Fd,i=ψ(fd,i) denote the 1D grayscale wave trans-formation of the straight linefd,i.wdrepresents the gray-scale wave vector of a pixel Q(x,y) in fd,iin direction d and is described by [36]:
wdðx;yÞ ¼Fd;iðx;yÞ;Qð Þ∈x;y fd;i: ð2Þ
Therefore, there aren wave vectors wd1;wd2;…;wdn for
a pixelQ(x,y). Themulti-direction grayscale wave trans-formationΨ(f) of the imagef in all directionsd1,d2,…,
dnis composed by:
Ψð Þ ¼f ψ fd1 ;ψ fd2 ;⋯;ψ fdn : ð3Þ
Next, we state the reason the grayscale wave trans-formation can reduce the impact of uneven lighting. Suppose there are two sub-regions,ϕ1= [T1,P1] andϕ2
= [T2,P2], i.e., the yellow shadows in Fig. 2, with different
lighting strengths in the wave curveg(k).
According to Eq. (1), the grayscale wave vectors of the two troughs and peaks are:
wT1¼uð Þ0 ; wP1¼uð Þ1 ; wT2 ¼uð Þ0 ; wP2¼uð Þ1 :
ð4Þ
Therefore, the pixels located at the two peaks have the same wave transformation values, namely, wp1¼wp2, no
matter how large their original gray levels are. Likewise, wt1¼wt2 for the pixels at the two troughs. Suppose two
pixels are located atk1,k2withg(k1) <g(k2) in local
sub-regions ϕ1,ϕ2, i.e., the yellow shadows in Fig. 2,
respect-ively. If H(k1;T1,P1) >H(k2;T2,P2), their transformation
values satisfy u(H(k1;T1,P1)) >u(H(k2;T2,P2)) because u
is a monotonous increasing function, which indicates that the wave transformation values, located in the green shadows in Fig. 2, depend on the relative characteristics of the pixels rather than their absolute gray levels, thereby reducing the impact of uneven lighting [36].
2.2 Intuitionistic fuzzy sets and intuitionistic fuzzy entropy
In this section, we present the basic elements of intuitio-nistic fuzzy set theory and two fuzzy membership func-tions, which will be used in the wave transformation model and image segmentation.
Definition 3. A fuzzy set (FS) A~ is defined on a
uni-verseXand can be described as follows [37]:
~
ð Þand represents the degree of elementxbelonging to
~
Fig. 2The illustration of the 1D grayscale wave transformation.aThe original grayscale wave curveg(k).bThe wave transformation value
μA~ð Þx
and ∀x∈X, where c is a complementary function.
Definition 4. An intuitionistic fuzzy set (IFS) A
defined on a universeXis expressed by [40]:
~
A¼f<x;μAð Þx ;vAð Þx >jx∈Xg ð6Þ
whereμA(x)∈[0, 1] and vA(x)∈[0, 1] represent
respect-ively the degree of membership and non-membership
of an element xbelonging toA based on the condition
0≤μA(x) +vA(x)≤[0, 1]. Atanassov and Stoeva [37] have
introduced an intuitionistic index πA(x) of an element x∈X inAfor an intuitionistic fuzzy set (IFS)Ain Xas follows:
πAð Þ ¼x 1−μAð Þx −vAð Þx: ð7Þ
πA(x) is considered as a hesitancy degree ofxtoA.
Moreover, an FSA~ defined onXcan also be represented
using the notation of IFSs as follows: A~ ¼
<x;μAð Þx;1−μAð Þx >jx∈X
f gwithπA(x) = 0 for allx∈X.
In addition, an axiom definition of intuitionistic fuzzy entropy measures is also introduced by Burillo and Bus-tince [41] to measure the fuzziness of an intuitionistic fuzzy set.
Definition 5.Intuitionistic fuzzy entropy is a function
E: F(X)→R+(R+= [0, +∞)) and satisfies the following conditions: IFS1:E(A) = 0 iffAis an FS. IFS2:E(A) = Car-dinal(X) =n iff μA(xi)≥vA(xi) = 0 for all xi∈X. IFS3: E(A)≥E(B) iffA≼B, i.e.,μA(xi)≤μB(xi) andvA(xi)≤vB(xi), for allxi∈X. IFS4:E(A) =E(Ac).
In addition, they also introduce an intuitionistic en-tropy measure based on the above requirements, expressed by [42]:
E Að Þ ¼X
i¼1 n
πAð Þxi : ð8Þ
To obtain good segmentation, one must select the mem-bership function that can best interpret the image. This sec-tion introduces two membership funcsec-tions which will be utilized in this paper. The first one is anS-function [43]:
S lð;a;b;cÞ ¼
wherelis the observed variable and the parametersa,b,c
determine the shape of theS-function. The second one is an exponential function defined by Chaira and Ray [44]:
μFð Þ ¼l;t and minimum grayscale values of the image, respect-ively; andtis a threshold that separates the objects from the background.
3 The proposed method
3.1 Overview of the approach
As mentioned in Section 2.1, the wave transformation in Wei’s method can reduce the bad influence of uneven light on the image segmentation by obtaining the local charac-teristic of each pixel. It is accomplished by dividing the image into a number of local sub-regions and computing the local characteristic value of each pixel based on its lo-cation in its corresponding region. Specially, the sub-regions are obtained by searching for local peaks and troughs based on the grayscale levels of pixels within a straight line extracted from the image in a given direction.
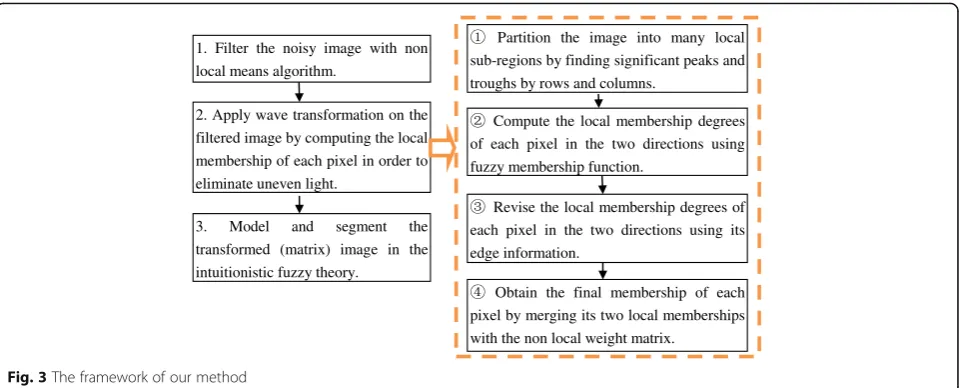
However, when the image is heavily corrupted by noise, the local characteristics including high-frequency signal with large amplitude have a strong influence on the search of peaks and troughs, namely, the establish-ment of the local sub-regions and the calculation of the local characteristics of pixels. Therefore, noise injection is one of the greatest challenges of the wave transform-ation. It is known that the non-local mean-filtered image [45] of the noisy image can retain more information than the median-filtered image and mean-filtered image. In this paper, we propose a novel wave transformation model by introducing fuzzy membership and adding non-local space information and edge information, in order to reduce the influence of uneven light and noise injection on image segmentation. The structure of our algorithm is shown in Fig. 3, which contains mainly the following steps.
Step 1. We first obtain the non-local mean-filtered image of a gray-level image in order to improve the noise resistance ability.
and troughs in each line are searched for, and two neighboring troughs and peaks constitute a local sub-region. (2) Then, the local membership degrees of each pixel located in the two corresponding sub-regions (respectively in the horizontal and vertical directions) are computed by a fuzzy membership function. (3) Moreover, the local membership degree of each pixel is further revised by combining with its edge information, in order to avoid false peak and trough labeling caused by the large variation of light intensity. (4) Lastly, the local membership degrees in the horizontal and vertical directions for each pixel are integrated with its non-local weight matrix, thus obtaining the final local membership values of all pixels and constituting the wave transformation matrix for the image.
Step 3. The final membership matrix is used to replace the grayscale matrix of the image; then, it is modeled and segmented with the intuitionistic fuzzy theory.
3.2 Wave transformation of an image using non-local spatial information and fuzzy membership
3.2.1 Non-local filter of the image
For every pixelQ(xk,yk) in an imagef, where (xk,yk) represents the original coordinate of thekth pixel, the estimated valueQ
xk; ;yk
with its spatial information is computed as [45]:
Q xk;yk
where Vrk represents a search window with radius r,
which is centered at the pixel (xk,yk) in the noisy
Here, h is the filtering degree parameter, Nk is a z×z square neighborhood centered at the pixel Q(xk,yk), a(a> 0) is the standard deviation of the pends on the similarity between the neighborhood configurations of the pixel (xk,yk) and the pixel (xj, will be used for the integration of fuzzy member-ships in the next section.
Theorem 1. Suppose the gray level of a pixel(x,y) in
the uneven lighting image fδ is constituted by fδ(x,y) = f(x,y) +δ(x,y), where f(x,y)is the original intensity of (x, y)in the image with even light andδ(x,y)is the intensity of the uneven light in (x,y). Given that δ(x,y) remains approximately constant in the local region, the estimated value Qδðx;yÞ of each pixel(x,y) in the uneven lighting image fδby the non-local filter is equal to the estimated value Q xð ;yÞof(x,y)in the original image f plus the un-even light intensity of (x,y), namely, Qδðx;yÞ ¼Q xð ;yÞ þδðx;yÞ.
Theorem 1 indicates that the non-local filter does not change the light intensities of an image and removes the noise under the premise that the light intensity δ(x,y) remains approximately unchanged in the local region, which is prepared for the follow-up process, i.e., wave transformation.
1. Filter the noisy image with non local means algorithm.
Compute the local membership degrees of each pixel in the two directions using fuzzy membership function.
3. Model and segment the transformed (matrix) image in the intuitionistic fuzzy theory.
Obtain the final membership of each pixel by merging its two local memberships with the non local weight matrix. 2. Apply wave transformation on the
filtered image by computing the local membership of each pixel in order to eliminate uneven light.
Partition the image into many local sub-regions by finding significant peaks and troughs by rows and columns.
Revise the local membership degrees of each pixel in the two directions using its edge information.
3.2.2 Wave transformation with fuzzy membership theory and non-local spatial information
3.2.2.1 Divide the filtered image into local sub-regions by searching for local peaks and troughs in
straight lines After obtaining the non-local mean-filter
image, the filtered image will be divided into local sub-regions by searching for local peaks and troughs in straight lines which are extracted from the image by rows and columns. Specifically, the straight lines in the image are searched for in two directions, namely, the horizontal directiondHand the vertical directiondV. Let the lines g(k) =fd,i, which are selected in the horizontal directiondH, be the original 1D gray wave curve, where k kð ¼1;⋯;KÞ represents the kth pixel in theith line. The peaks P= {P1,P2,…,Pm} and troughsT= {T1,T2,…,
Tm+ 1} in the curveg(k) withT1<P1<T2<⋯<Pm<Tm + 1are found if they satisfy the following conditions:
g Pð Þi −g Tð i−1Þ>α; g Pð Þi −g Tð Þi >α; ð13Þ
where the parameter α is a preset threshold, which is
used to control the sensitivity to the wave with little
amplitude caused by noise [36]. In addition, how the
value of αis selected is related to the difference of gray levels of pixels in the background and the objects. Ifαis larger than the least difference of gray levels of pixels in the background and the objects, the objects cannot be extracted. Ifαis too small, the noise will be classified to the objects.
3.2.2.2 Compute the wave transformation value (local membership value) of each pixel in the
horizontal and vertical directions using fuzzy
membership After finding all the sub-regions
consti-tuted by peaks {P1,P2,…,PR} and troughs {T1,T2,…,TS}
in the gray wave curveg(k), the wave transformation can be applied on the pixels in g(k). Suppose there are sev-eral local sub-regionsϕ1,ϕ2,⋯,ϕs,⋯ing(k). Let a local sub-region ϕs= [Ts,Ts+ 1] consist of a peak Ps and two
troughs Ts and Ts+ 1, where Ts<Ps<Ts+ 1. Let ϕs1
¼½ts; ;ps be the rising edge interval and ϕs2¼
Ps; ;Tsþ1
½ be the training edge interval. The local mem-bership degree G(k) of each pixel k in the region ϕs1 region ϕs1 be composed of two parts, namely, the back-ground D~ and the foreground (the objects) B~. In the sub-region, the pixels close by the peak correspond to the object and the pixels close by the trough correspond to the background. The closeness degree of a pixel to
the local peak or trough represents its relative character-istic and can be obtained by a membership value as fol-lows. The membership valueμdiðg kð ÞÞ ¼μdið Þq indicates
called thefuzzy region. Likewise, the membership degree of the pixel kin the training region ϕs2¼½Ps;Tsþ1 can be obtained in the same way. Then, the transformed valueG(k) of a pixelkin the local intervalϕs= [Ts,Ts+ 1] in the directiondHis as follows:
GdHð Þ ¼k approximately constant in a local sub-region, the wave transformation matrix by the S-function Ψ(f) of the ori-ginal image f is approximately equal to the wave trans-formation matrixΨ(fδ)of the uneven lighting image fδ.
Theorem 2 indicates that the wave transformation of an image using the fuzzy membership function (S -func-tion) can reduce the light intensity difference between neighborhood sub-regions, thus markedly decreasing the influence of uneven light on the image segmentation.
3.2.2.3 Revise the wave transformation values of
each pixel using its edge information However, when
transformation for computing the local characteristics of an image. Therefore, the pixels in the pure background will be classified into two classes, i.e., the object and the background, by the segmentation of the wave transform-ation matrix, which actually leads to the misclassifictransform-ation of some pixels to object.
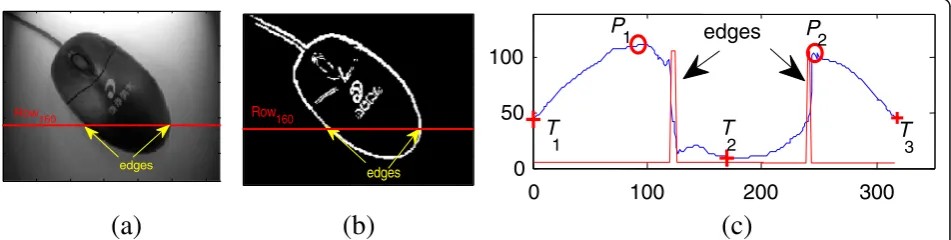
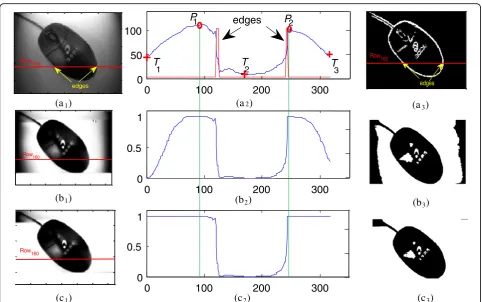
Taking the mouse image, for example, as shown in Fig. 4a, uneven light is very serious in the background regions. When the parameter is set as α = 60, four sub-regions are extracted in the 160th row, namely, (T1,P1), (P1,T2), (T2,P2) and (P2,T3), as shown in
the blue curve in Fig. 4c. The two sub-regions (T1,
P1) and (P2,T3) are extracted due to the large
vari-ation of light intensity in the original wave curve. The pixels in the two sub-regions actually belong to the background. However, part of these pixels will be misclassified to objects. Figure 4b shows the edge in-formation of the mouse image. The red curve in Fig. 4c is the edge information in the 160th row of the mouse image. Let us take a closer look at the two curves in Fig. 4c. We can see that there is an obvious difference between the pure background sub-regions (T1,P1) and (P2,T3) and the mixed sub-regions (P1,
T2) and (T2,P2). There is no edge information in the
pure background sub-region (T1,P1) since the gray
levels of the pixels in the region vary gradually due to the intensity variation of the uneven light. How-ever, there is edge information in the region (P1,T2),
where some gray levels vary dramatically since there are pixels that belong to two different classes. There-fore, in this paper, we take into consideration the edge information to revise the wave transformation value further.
To preserve more global (larger) edges and ignore those locally fluctuated (smaller) edges, we use two
improved 5 × 5 Sobel operators [46],
SdH¼½2;3;0;−3;−2;3;4;0;−4;−3;6;6;0;−6;−6;3;4;0;−4;−3;2;3;0;3;2 and Sdv¼½2;3;6;3;2;3;4;6;4;3;0;0;0;0;0;−3;−4;−6;−4;−3;−2;−3;−6;−3;−2, to convolute the images and check the maximum response of the horizontal and vertical edges. Then, we can obtain
EdH xk;yk
judging whether there is any edge information in ϕs1
¼½Ts; ;Ps. Thus, the transformation value of the pixel
According to Theorem 2, it holds under the premise that the intensity of the uneven lightδ(x,y) remains ap-proximately constant in each local sub-region. For the pixelk∈[Ts,Ps], the condition∃j∈[Ts,Ps],E(xj,yj)≥T in-dicates that there is edge information, and the troughTs and the peak Ps are searched for due to the radical change of the gray level in the sub-region ϕs1 ¼½Ts;Ps.
That is, there are two different classes in the sub-region. Moreover, the intensity of the uneven lightδ(x,y) can be regarded as approximately constant in ϕs1¼½Ts;Ps.
Then, Theorem 2 holds, and the wave transformation value can remain unchanged, namely, G′dHð Þ ¼k GdHð Þ.k
If the pixel k∈[Ts,Ps] does not satisfy the condition ∃j∈[Ts,Ps],E(xj,yj)≥T, this indicates that there is no edge information. That is, there is only one class in the sub-region, and the trough Ts and the peak Ps are searched for due to the gradual change of uneven light intensity in the sub-region ϕs1 ¼½Ts;Ps. Therefore, the
variation of uneven light intensity is too large, and its value cannot be regarded as approximately constant in ϕs1 ¼½Ts;Ps. Then, Theorem 2 does not hold, and the
wave transformation valueG′dHð Þk should be modified to the intensity of the background.
3.2.2.4 Integrate the horizontal and vertical
transformation values of each pixel with its non-local
information Since the wave transformation is applied
on the image in two directions, there are two transform-ation values for each pixel, namely, two transformtransform-ation matrices for the image. In this section, we will integrate the two matrices with non-local space information. Let G′dH;i represent the one-dimensional wave transform-ation value for the pixelkin theith linefdH;i in the dir-ection dH. The horizontal wave transformation matrix ΨdHð Þf of the image is composed by the wave
trans-formation G′dH;1;G′dH;2;G′dH;3;⋯ of all lines in the direc-tion dH. Similarly, the vertical wave transformation matrixΨdVð Þf of the image can be obtained in the same
way. To integrate the two membership matrices, ΨdHð Þf
and ΨdVð Þ, we take consider the non-local space infor-f
mation of each pixel, namely, the weight matrix of pixels as follows. Let ΨdH xk;yk
and ΨdV xk;yk
represent the membership degrees (wave vectors) of the pixelk lo-cated at (xk,yk) in thedH anddVdirections. The weight matrix of the pixelkisfv kð ;jÞg; ðxk;yiÞ∈Vrk
. The wave transformation value of the pixel kin the directions dH anddLwith space information is modified by:
G″dH xk;yk
ships in the two directions as follows:
Ψ′ x
approximately constant in a local sub-region, the integra-tion of the horizontal and vertical transformaintegra-tion values of each pixel in the original image f with its non-local information is approximately equal to that of each pixel in the uneven lighting image fδ, namely, Ψ′δ xk;yk
Theorem 3 indicates that the addition of the non-local space information does not change the uneven light in-tensity, and the integration of the horizontal and vertical wave transformation values with the non-local space in-formation can reduce the influence of the uneven light on the image segmentation.
After calculating all the local membership values of pixels in the image according to the abovementioned method, we obtain the final 2D wave transformation matrix. In the matrix, the characteristic of a pixel is rep-resented by the relative vector (the local membership value) only related to its sub-region in order to reduce the lighting difference between two neighborhood sub-regions. At the same time, the non-local information is incorporated to overcome the influence of the local high-frequency signal on the establishment of the mem-bership matrix. That is, although the memmem-bership de-grees of pixels to the local peaks substitute the gray levels as a new expression of pixels, they do not separate with the original gray level and space information com-pletely. Last, the membership matrixΨ′will be classified using IFS entropy to obtain a final segmented image.
3.3 Segmentation of transformed image using intuitionistic fuzzy set
We apply L level quantization on the membership matrix Ψ′(x,y) of size M×N to obtain a new matrix I ′(x,y), which is also called wave transformation image.
Then, the image is modeled based on intuitionistic fuzzy set [47]. Suppose the image I′(x,y) hasL gray levelsGx = {0, 1,⋯,L−1}, and its histogram isH= {h0,h1,…,hL− 1}. Let the 1D sample spaceX=Gx= {0, 1,⋯,L−1}, and
pis the probability of a gray level, i.e., p({i}) =hi, i= 0, 1,⋯,L−1, whereiis the quantization level.
The image can be considered as an array of fuzzy sin-gletons according to Pal and King [38]. With regard to an image property, each element of the array represents the membership value of the gray level l. Then, the image can be represented as the fuzzy set: A~ ¼
<l;μA~ð Þl >jl∈f0;1;…;L−1g
μAð Þ ¼l;t λμAð Þl;t ; vAð Þ ¼l;t ð1−μAð Þl;t Þ
λ; ð
23Þ
whereλ∈[0, 1], and we set λ= 0.9 in this paper. There-fore, the image is represented in the intuitionistic fuzzy domain as follows: A= {<l,μA(l),vA(l)>|l∈{0,…,L−1}}.
Then, we use the intuitionistic entropy in Eq. (8) defined by Burillo and Bustince [41] by means of the following expression:
EIFSðA;tÞ ¼ 1
MN
XL−1
l¼1
hAð Þl ð1−μAð Þl;t −vAð Þl;t Þ;
ð24Þ
whereM×Nis the image dimensions in pixels. The
po-tential idea of the described approach is that the optimal set has the least value of entropyEIFS(A;t), and its corre-sponding IFS can represent the image more efficiently with the least uncertainty. That is, the minimum entropy corresponds to optimal image segmentation. Therefore,
the optimization criterion can be formulated as topt
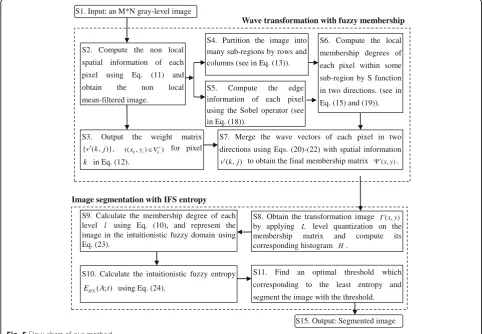
¼Arg mintfEIFSðA;tÞg . The detailed steps of our method are described in the form of a flowchart as shown in Fig.5.
4 Results and discussion
4.1 Performance of wave transformation using the fuzzy membership function
First, we use the uneven lighting rice image to test the process of wave transformation using the fuzzy member-ship function. As shown in Fig. 6a, there is a dark region in the lower part of the rice image, where the overall gray level in the region is lower than that in the upper region of the image. Figure 6b shows the gray levels of the pixels in 45th–50th columns, namely, the pixels in the red rectangle of Fig. 6g. If we want to give consider-ation to both of the regions with different light inten-sities, it is difficult to find a single global threshold, such asT1andT2in Fig. 6g, which can extract all of the“rice”
objects. As shown in Fig. 6c, without wave transform-ation, some “rice” objects in the darkened regions are extracted by the IFS entropy-based method with a thresholdT= 160.
Then, the proposed method is applied on the test image, with α= 60 (see in Eq. (13)) for the search of peaks and troughs in S4. Several peaks and the troughs of the 45th column are searched for in Fig. 6e of the rice image, where the symbol “○” represents the peaks and the symbol “△” represents the troughs. The local
S1. Input: an M*N gray-level image
S2. Compute the non local
spatial information of each
pixel using Eq. (11) and obtain the non local
mean-filtered image.
S15. Output: Segmented image S4. Partition the image into
many sub-regions by rows and columns (see in Eq. (13)).
S3. Output the weight matrix
{ ( , )},v k j (( , ) r)
k i k
x y V for pixel
k in Eq. (12).
S6. Compute the local
membership degrees of each pixel within some
sub-region by S function
in two directions. (see in
Eq. (15) and (19)).
S11. Find an optimal threshold which
corresponding to the least entropy and
segment the image with the threshold. S10. Calculate the intuitionistic fuzzy entropy
( ; ) IFS
E A t using Eq. (24).
S9. Calculate the membership degree of each level l using Eq. (10), and represent the image in the intuitionistic fuzzy domain using Eq. (23).
S7. Merge the wave vectors of each pixel in two directions using Eqs. (20)-(22) with spatial information
( , )
v k j to obtain the final membership matrix ( , )x y.
S8. Obtain the transformation image I x y( , )
by applying L level quantization on the
membership matrix and compute its
corresponding histogram H.
Wave transformation with fuzzy membership
Image segmentation with IFS entropy
S5. Compute the edge information of each pixel using the Sobel operator (see in Eq. (18)).
membership values (wave transformation values) of the 45th column are obtained in Fig. 6f by theS-function. It is obvious that all of the peaks and troughs are respect-ively located in the same horizontal lines. The local char-acteristics of other pixels are represented by their locations in the sub-regions.
Figure 6h shows the wave transformation result of 45th– 50th columns. Figure 6b shows the transformation image of the rice image. It is obvious that the dark region in the lower part of the rice image is appropriately lightened to the same as the upper part of the rice image. Thus, a threshold of 167 can be easily found by the IFS entropy in S, and all of the “rice” objects are extracted by the IFS entropy-based method, as shown in Fig. 6d. Moreover, the threshold of 167 corresponds to a membership degree of 167⋅1
L¼0:6523
be-cause the transformation image is obtained by applyingL= 256 level quantization on the membership matrix.
4.2 Performance of the revision of the wave transformation values using edge information
In this section, we test the process of the revision of the wave transformation value using edge information. Taking the uneven lighting mouse image used in Section 3.2.2 for example, the two pure background sub-regions (T1,P1) and
(P2,T3) in the 160th row are extracted due to its large
variation of light intensity withα= 60. The wave transform-ation values (the membership degrees) of the pixel in these
regions vary from 0 to 1, according to Eq. (14) (see Fig. 7b2).
Consequently, some pixels will be misclassified as objects, as shown in Fig. 7b3, according to the principle that the
pixels close by the peak or the trough correspond to dif-ferent classes.
Figure 7c2 shows the gray wave transformation of the
160th row when the edge information is taken into ac-count by Eq. (19), with T= 800. For the pixels in the pure background sub-regions without edge information, i.e., k∈[T1,P1] or k∈[P2,T3], the transformation values
are set to 1, namely, the value of the background G′Row160thð Þ ¼k background¼1 . For the pixels in the
sub-regionsk∈[P1,T2] ork∈[T2,P2] with edge
informa-tion, the transformation values are unchanged, i.e., G′Row160thð Þ ¼k GRow 160thð Þ. Figure 7bk 1, c1shows the
cor-responding gray wave transformation images of Fig. 7b2,
c2. It is obvious that the transformation image in Fig. 7c1
agrees with the actual requirement more than that in Fig. 7b1. Figure 7b3, c3shows the segmented images
be-fore and after adding edge information. Apparently, when the edge information is taken into account, the proposed method can obtain a better segmented result.
4.3 Performance of segmentation of uneven lighting images with noise injection
To prove the effectiveness of our method for uneven lighting images with strong noise injection, experimental
Collum 45th-50th
tests are implemented on six uneven illumination images corrupted by the Gaussian noise. The intensity value of the pixel in these images varies from 0 to 255, namely, L= 256. In the experiments, several classical local methods, Bernsen’s method [22], Niblack’s method [23], and Sauvola’s method [24]; related works for the local methods, Bradley’s method [29], Chou’ s method [35], and Valizadeh’s method [31]; based on an improved water flow model-based method, Wei’s method [36]; and several related global two-dimensional methods with space information, the two-dimensional Otsu method (2DOtsu) [13] proposed by Liu et al., the fuzzy c-means clustering algorithm with nonlocal spatial information (FCM_NLS) [16] proposed by Zhao et al., and the two-dimensional weak fuzzy partition entropy-based method (2DWFPE) [14] proposed by Yu et al. are implemented on the test images, and their results are compared with our method.
The parameter settings for these methods are as fol-lows. Bernsen’s method uses a 93 × 93 neighborhood. Niblack’s method uses a 50 × 50 neighborhood withk= −0.2. Sauvola’s method uses a 50 × 50 neighborhood
with k= 0.2. Bradley’s method uses a 30 × 30 neighbor-hood. Valizadeh’s method uses the parameter W= 2. Chou’s method uses a mean threshold of 128 and a vari-ance threshold of 10 with a block size 3 × 3. Wei’s method uses the parameter α= 60. FCM_NLS uses the parameter β= 10. Specifically, for the parameters of the non-local filter in our method and FCM_NLS, we set r = 5, a = 2, andh = 15 for the fingerprint image and r= 5,a= 2, andh= 30 for the other images.
Figures 8, 9, 10, 11, 12, and 13 show six test images, their noisy images (corrupted by the Gaussian noise), their corresponding ground-truths (hand-labeled by people), and their binarized results. Taking the rice image for ex-ample, the segmentation results of the local methods are presented in Fig. 8d–h. Although the seven local methods of Bernsen, Niblack, Sauvola, Bradley, Chou, and Valizadeh perform in the foreground areas (objects), they create much of the pepper noise in the background areas. Although Wei’s method uses wave transformation to reduce the uneven light, it still leads to a bad result since it does not take into account the space informa-tion. Simultaneously, the global methods 2DOtsu and
(c2)
0 100 200 300
0 50 100
T
1
T
2P
1P
2+
T
3
0 100 200 300
0 0.5 1
0 100 200 300
0 0.5 1
(b2) edges
(a2)
Row160
edges
Row160
Row160
(a1)
(b1)
(c1)
(a3)
(b3)
(c3) Row
160
edges
FCM_NLS, which have relative good performance in anti-noise interference, cannot extract some “rice” ob-jects in the dark regions. 2DWFPE [14] is our previ-ously proposed method which maximizes weak fuzzy partition entropy on the two-dimensional histogram
to obtain optimum segmentation results. The global method can improve the segmentation effect for noisy images, but it only uses the absolute characteristic (the gray level) of the pixel and thus cannot deal well with uneven lighting images. However, the method
(a)
(b)
(c) (d)
(e) (f)
(g)
(h)
(i)
(j)
(k)
(l)
(m)
(n)
proposed in this paper uses the relative characteristic of the pixel in local sub-regions to reduce the influ-ence of uneven light and non-local spatial information to avoid noise interference. Thus, it can obtain the best results for uneven lighting images with noisy in-jection, as shown in Fig. 8k.
To evaluate the effectiveness of these segmentation methods, we use a supervised evaluation method, i.e., mis-classification error (ME) [48]. ME can be expressed as ME = 1−(|Bo∩BT| + |Fo∩FT| )/(|Bo| + |Fo| ) through a
comparison of a segmented image and a ground-truth image, where∣ ⋅ ∣ is the cardinality of the set,FTand BT represent the foreground and background area pixels of the segmented image, and Fo and Bo represent the foreground and background area pixels of the ground-truth image. The evaluation values ME of these segmenta-tion methods are shown in Table 1. The effect of local thresholding methods is poor since they are very sensitive to noise. Figures 9, 10, 11, 12, and 13 show the results for the rest of the images. The global 2DOtsu, FCM_NLS,
(a)
(b)
(c)
(d)
(e)
(f)
(g)
(h)
(i)
(j)
(k)
(l)
(m)
(n)
and 2DWFPE methods still cannot correctly extract all of the objects. However, our method takes the spatial infor-mation and gradient inforinfor-mation into account in the wave transformation, thus obtaining the best results and the lowest misclassification rate.
4.4 Influence of the parametersαandT
The parameters α and T are very important in our method. The value of α determines the search of local peaks and troughs in Eq. (13) (see Section 3.2.2), namely, the search of local sub-regions. Meanwhile, the value of
(a)
(b)
(c)
(d)
(e)
(f)
(g)
(h)
(i)
(j)
(k)
(l)
(m)
(n)
T determines the extraction of edge information in Eq. (19) (see Section 3.2.2). To study the influence of the pa-rametersα and T, we draw the ME curves with varying parameters α and T on three test images, as shown in Figs. 14 and 15. Moreover, we compare the segmentation
results with ME = 0.05 as the reference value. For the rice image with the Gaussian noise (0,0.010) in Fig. 15a, it can be found that ME under each α value within [22,120] is smaller than 0.05 and presents no apparent changes, which indicates that we can obtain relatively
(a)
(b)
(c)
(d)
(e)
(f)
(g)
(h)
(i)
(j)
(k)
(l)
(m)
(n)
satisfactory segmented results in this case. That is, too small or too big of anαcannot extract the objects from the background correctly. Therefore, a reasonable value of α has an important influence on the wave trans-formation value of each pixel, and thus on the segmen-tation results.
Actually, the value of αseriously depends on the gray difference between the objects and the background in the dark regions. In most cases, the larger the gray level difference of the objects and the background in the dark regions, the larger the reasonable value ofαand the lar-ger the range in which α can take value in, and vice versa. That is, the smaller the degree of uneven lighting, the larger the range in whichαcan take value in. Under the condition of the Gaussian noise (0,0.010), if we want
to obtain a ME value smaller than 0.05,αcan take value in [22, 120] for the rice image as shown in Fig. 14a, and αcan take value in [20, 220] for the license-plate image as shown in Fig. 15b. However, for the mouse image, α only can take value in [40, 80] for the relatively satisfac-tory results in Fig. 15a. Moreover, the ME value also de-pends on many factors, such as the proportion of the dark regions in the whole image and the intensity of local illumination variation.
Noise injection also has an important influence on the segmentation performance especially on the dark region with a small gray difference between the objects and the background. To reduce the influence of noise injection on the search of local peaks and troughs and differenti-ate the objects and the background in the dark regions,
(a)
(b)
(c)
(d)
(e)
(f)
(g)
(h)
(i)
(j)
(k)
(l)
(m)
(n)
the reasonable range of α is narrowed with increasing noise strength. Taking the rice image for example, in order to obtain a ME value smaller than 0.05, the rea-sonable range of the parameterαunder the condition of the Gaussian noise (0,0.020) is [42, 125], which is nar-rower than the range [22, 125] of αunder the condition of the Gaussian noise (0,0.010), as shown in Fig. 14a, b.
The segmentation results of our method also depend on the edge detection with the parameterT in Eq. (19). For the rice image, three curves with the parameter T respectively equal to 600, 800, and 1000 tend to change
similarly with the parameter α. However, a reasonable parameter Tis crucial to the segmentation performance for the mouse image that has relatively more serious un-even light. As shown in Fig. 15a, the ME value withT= 600 is bigger than 0.05, since incomplete edge informa-tion leads to some incorrect computainforma-tion of local mem-berships and consequently bad segmentation results.
In conclusion, the parameter selection of our method is affected by multiple factors, such as the noise strength, the degree of uneven lighting, and the gray dif-ference between objects and the background. However,
(a)
(b)
(c)
(d)
(e)
(f)
(g)
(h)
(i)
(j)
(k)
(l)
(m)
(n)
the above experimental results show that the intervals [60, 80] and [800, 1000] may be two reasonable ranges respectively for α and T to take value in. Moreover, when the light intensity of the sub-regions becomes darker, the value of the two parameters should decrease properly.
5 Conclusions
In this paper, we presented a novel algorithm for the segmentation of uneven background lighting images with strong noise injection. We first treated the image as a gray wave in three-dimensional space and extracted grayscale wave curves in the horizontal and vertical di-rections. Then, we applied wave transformation on the curves using fuzzy membership to obtain the relative characteristic of each pixel in order to reduce the influ-ence of the uneven background lighting. Simultaneously, the non-local spatial weight matrix and edge information were also taken into account in the transformation in order to improve the robustness of the transformation to noise injection and avoid false peak and trough label-ing. Finally, we segmented the wave transformation image using intuitionistic fuzzy theory. In different ex-periments, our algorithm demonstrated superior per-formance against some well-known algorithms on several uneven background lighting images.
Although the proposed algorithm for uneven lighting image segmentation has some advantages, there are still
two problems requiring further study. The first critical problem is the selection of the parameterα. The param-eterαis set manually based on experience in this paper. Therefore, further research on the automatic determin-ation ofαwith consideration of both the uneven lighting background and noise injection is necessary. The second problem is the detection of edge information for a noisy image. The edge information has an important impact on the wave transformation of pixels in an uneven light-ing image. In this paper, we used two 5 × 5 Sobel models for the edge detection. However, when we used a given global thresholdTto extract the edge information, there were still small noise edges being detected in some cases. Therefore, how to effectively detect large edges in the dark regions and ignore locally fluctuated edges caused by noise will also be part of our future research.
6 Appendix
6.1 Proof of Theorem 1
Given a pixel (xk,yk) in an uneven lighting image fδ,
where (xk,yk) represents the original coordinate of the kth pixel, the square neighborhood Nδ,k and Nδ,j cen-tered at two pixels (xk,yk) and (xj,yj) respectively are:
Nδ;k¼Nkþδk; Nδ;j¼Njþδj: ð25Þ Since the intensity of the uneven light δ remains ap-proximately constant in a local region, then,
0 20 40 60 80 100 120 140 160 180 200
Fig. 14ME of our method versusTandαfor the rice image.aWith the Gaussian noise (0, 0.010).bWith the Gaussian noise (0, 0.020)
Table 1Missclassfication rate (ME) obtained by the eight methods on images corrupted by addictive noise
ME Gaussian
Rice 0.010 0.1718 0.3497 0.2225 0.3537 0.3502 0.2064 0.3307 0.0884 0.0462 0.0686 0.0284
Fingerprint 0.002 0.1386 0.1707 0.1758 0.1417 0.1751 0.1394 0.1023 0.2359 0.2091 0.3645 0.0644
Mouse 0.010 0.2897 0.2818 0.2341 0.2421 0.2852 0.2929 0.4277 0.5326 0.5184 0.5982 0.0471
Block 0.015 0.3246 0.5262 0.4734 0.4685 0.5254 0.5007 0.4637 0.1497 0.0815 0.1708 0.0089
License-plate
0.015 0.1348 0.2552 0.2264 0.2817 0.2549 0.2526 0.2042 0.0523 0.0487 0.0414 0.0258
δk≈δj: ð26Þ
Moreover, the weight v(k,j) between the two pixels (xk,yk) and (xj,yj) in the uneven lighting imagefδis:
That is to say that, the weight matrix for the pixel Q(xk,yk) in the uneven lighting imagefδis approximately equal to the weight matrix for the pixel Q(xk,yk) in the original imagef, namely,vδ(k,j)≈v(k,j).
According to Eq. (11), the estimated valueQ xk;yk
of the pixel (xk,yk) in the original even lighting image f is computed as: yk) in the uneven lighting imagefδis computed by:
Qδ xk;yk
Since the weight matrix satisfies the condition: P
j∈V r k
v
k;j
ð Þ ¼1 (see in Section 3.2.1) and the intensity in the local region remains approximately constant, i.e., δ(xk, yk)≈δ(xj,yj), it is obtained that:
Eq.(31) is brought into Eq. (30), and it follows that:
Qδ xk;yk
6.2 Proof of Theorem 2
GivenG(k) is a wave gray curve in an arbitrary direction of the image f, withk= 0, 1,…,K.ϕsis thesth local sub-region of the curve, whereTsandPs are the trough and the peak of the region, respectively. q=g(k) is the gray
The gray level of the trough Ts, the peak Ps, and an arbitrary pixelkin the sub-regionϕsin the uneven light-ing imagefδare respectively:
gδð Þ ¼Ts g Tð Þ þs δð ÞTs ; gδð ÞPs
¼g Pð Þ þs δð ÞPs ; gδð Þ ¼k g kð Þ þδð Þk : ð33Þ
Since the intensity of the uneven light δ(x,y) remains approximately constant in each sub-region, then
δð ÞTs ≈δð ÞPs ≈δð Þk : ð34Þ
Ifg(Ts)≤g(k)≤(g(Ts) +g(Ps))/2, the membership degree (the wave transformation value) of the pixelkin the ori-ginal even lighting image f according to the S-function in Eq. (14) is
μðg kð ÞÞ ¼2 g kð Þ−g Tð Þs
g Pð Þs −g Tð Þs
2
: ð35Þ
The membership degree (the wave transformation value) of the pixelk in the uneven lighting image fδ
ac-cording to theS-function in Eq. (14) is
μδðg kð ÞÞ ¼2 ggδð Þk−gδð ÞTs ship degree of the pixel k in the original even lighting imagefaccording to theS-function in Eq. (14) is
μðg kð ÞÞ ¼1−2 g kð Þ−g Pð Þs
g Pð Þs −g Tð Þs
2
: ð37Þ
The membership degree of the pixel k in the uneven lighting imagefδ according to theS-function in Eq. (14) is (3), it is concluded that two transformation matrices for the hole image satisfy the conditionΨδ(f)≈Ψ(f).
Then the theorem holds.
6.3 Proof of Theorem 3
Given an pixel (xk,yk) in an uneven lighting image fδ,
where (xk,yk) represents the original coordinate of the kth pixel, vδ(k,j) is the weight matrix for the pixel (xk,
yk).
The wave transformation value of the pixel k in the original imagefin the directionsdHwith space informa-tion is modified by:
The wave transformation value of the pixel k in the original image fδ in the directions dH with space infor-mation is modified by:
According to Theorem 1 and Theorem 2, we can get
vδ(k,j)≈v(k,j) and Ψδ;dH xj; ;yj pixels in the vertical directiondL. Then, according to Eq. (22), the integration of two transformation values, G″δ;dH
xk;yk
Science Basic Research Plan in Shaanxi Province of China (No. 2012JQ8045), and Special Research Project of Shaanxi Department of Education (No. 2013JK1131).
Competing interests
The authors declare that they have no competing interests.
Publisher’s Note
Springer Nature remains neutral with regard to jurisdictional claims in published maps and institutional affiliations.
Received: 18 September 2016 Accepted: 12 October 2017
References
1. SB Chaabane, M Sayadi, F Fnaiech, E Brassart, Colour image segmentation using homogeneity method and data fusion techniques. EURASIP J. Adv. Signal. Process.2010(367297), 11 (2010)
2. S Kasaei, M Hasanzadeh, Fuzzy image segmentation using membership connectedness. EURASIP J. Adv. Signal. Process.2008(417293), 13 (2008) 3. Q Huang, W Gao, W Cai, Thresholding technique with adaptive window
selection for uneven lighting image. Pattern Recogn. Lett.26, 801–808 (2005) 4. C Sahasrabudhes, SD Gupta, A valley-seeking threshold selection technique.
Comput. Vis. Image. Underst.56, 55–65 (1992)
5. N Ramesh, H Yoo, IK Sethi, Thresholding based on histogram
approximation. IEEE Proc. Vis. Image. Signal. Process.142(5), 271–279 (1995) 6. N Otsu, A thresholding selection method from gray-scale histogram. IEEE
Trans. Syst. Man. Cybern.9, 62–66 (1979)
7. JC Bezdek,Pattern Recognition with Fuzzy Objective Function Algorithms
(Plenum, NewYork, 1981)
8. TW Ridler, S Calvard, Picture thresholding using an iterative selection method. IEEE Trans. Syst. Man. Cybern.8, 630–632 (1978)
9. G Johannsen, J Bille,A threshold selection method using information measures, Proceedings of the 6th International Conference on Pattern Recognition, Munich (1982), pp. 140–143
10. PK Sahoo, C Wilkins, J Yeage, Threshold selection using Renyi’s entropy. Pattern Recogn.30(1), 71–84 (1997)
11. FY Nie, PF Zhang, JQ Li, DH Ding, A novel generalized entropy and its application in image thresholding. Signal Process.134, 23–34 (2017) 12. AKC Wong, PK Sahoo, A gray-level threshold selection method based on
maximum entropy principle. IEEE Trans. Syst. Man. Cybern.19, 886–871 (1989) 13. JZ Liu, WQ Li, The automatic threshold of gray-level pictures via two-dimensional
Otsu method. Acta Automat. Sin.19(1), 101–105 (1993) (in Chinese) 14. HY Yu, XB Zhi, JL Fan, Image segmentation based on weak fuzzy partition
entropy. Neurocomputing168, 994–1010 (2015)
15. JH Lan, YL Zeng, Multi-threshold image segmentation using maximum fuzzy entropy based on a new 2D histogram. Optik. Int. J. Light. Electron. Opt.124(18), 3756–3760 (2013)
16. F Zhao, LC Jiao, HQ Liu, XB Gao, A novel fuzzy clustering algorithm with non local adaptive spatial constraint for image segmentation. Signal Process.91, 988–999 (2011)
17. F Zhao, HQ Liu, JL Fan, A multiobjective spatial fuzzy clustering algorithm for image segmentation. Appl. Soft Comput.30, 48–57 (2015)
18. LH Son, TM Tuan, Dental segmentation from X-ray images using semi-supervised fuzzy clustering with spatial constraints. Eng. Appl. Artif. Intell.
59, 186–195 (2017)
19. PK Sahoo, G Arora, A thresholding method based on two dimensional Renyi’s entropy. Pattern Recogn.37, 1149–1161 (2004)
20. AB Ishak, Choosing parameters for Rényi and Tsallis entropies within a two-dimensional multilevel image segmentation framework. Physica A: Statistical Mechanics and its Applications.466, 521-536 (2017).
21. Y Liu, SN Srihari, Document image binarization based on texture features. IEEE Trans. Pattern Anal. Mach. Intell.19, 540–544 (1997)
22. J Bernsen,Dynamic Thresholding for Gray-Level Images, Proceedings of the Eighth International Conference Pattern Recognition, Paris (1986), pp. 1251–1255 23. W Niblack,An Introduction to Digital Image Processing(Prentice Hall,
Englewood Cliffs, 1986), pp. 115–116
24. J Sauvola, M Pietikainen, Adaptive document image binarization. Pattern Recogn.33, 225–236 (2000)
25. J Sauvola, T Seppanen, S Haapakoski, M Pietikainen,Adaptive document binarization, Proceedings of the ICDAR (1997), pp. 147–152
26. IJ Kim, inNinth International Workshop on Frontiers in Hand Writing Recognition. Multi-window binarization of camera image for document recognition (2004), pp. 323–327
27. Y Yang, H Yan, An adaptive logical method for binarization of degraded document images. Pattern Recogn.33(5), 787–807 (2000)
28. ØD Trier, T Taxt, Improvement of‘integrated function algorithm’for binarization of document images. Pattern Recogn. Lett.16(3), 277–283 (1995) 29. D Bradley, G Roth, Adaptive thresholding using the integral image. J. Graph.
Gpu. Game. Tools.12(2), 13–21 (2007)
30. IK Kim, DW Jung, RH Park, Document image binarization based on topographic analysis using a water flow model. Pattern Recogn.35, 265–277 (2002)
31. M Valizadeh, E Kabir, An adaptive water flow model for binarization of degraded document images. Int. J. Doc. Anal. Recognit.16, 165–176 (2013) 32. T Taxt, PJ Flynn, AK Jain, Segmentation of document images. IEEE Trans.
Pattern Anal. Mach. Intell.11(12), 1322–1329 (1989)
33. L Eikvil, T Taxt, K Moen, inProceedings of the International Conference on Document Analysis and Recognition. A fast adaptive method for binarization of document images (1991), pp. 435–443
34. JH Park, IH Jang, NC Kim, inProceedings of the IEEE Pacific Rim Conference on Communications, Computers and Signal Processing. Skew Correction of Business Card Images in PDA (2003), pp. 724–727
35. CH Chou, WH Lin, F Chang, A binarization method with learning-built rules for document images produced by cameras. Pattern Recogn.43, 1518–1530 (2010) 36. W Wei, XJ Shen, QJ Qian, An adaptive thresholding algorithm based on
grayscale wave transformation for industrial inspection images. Acta Automat. Sin.37(8), 944–953 (2011) (in Chinese)
37. LA Zadeh, Fuzzy sets. Inf. Control.8(3), 338–353 (1965)
38. SK Pal, RA King, Image enhancement using smoothing with fuzzy set. IEEE Trans. Syst. Man Cybern.11(7), 494–501 (1981)
39. S Krinidis, V Chatzis, A robust fuzzy local information C-means clustering algorithm. IEEE Trans. Image Process.19(5), 1328–1337 (2010) 40. KT Atanassov, Intuitionistic fuzzy sets. Fuzzy Sets Syst.20, 87–96 (1986) 41. P Burillo, H Bustince, Entropy on intuitionistic fuzzy sets and on
interval-valued fuzzy sets. Fuzzy Sets Syst.78, 305–316 (1996)
42. KT Atanassov, S Steova,Intuitionistic Fuzzy Sets, in: Proceedings of the Polish Symposium on Interval and Fuzzy Mathematics, Pozan(1993), pp. 23–26 43. SK Pal, DKD Majumder,Fuzzy Mathematical Approach to Pattern Recognition
(J Wiley, New York, 1986)
44. T Chaira, AK Ray, Segmentation using fuzzy divergence. Pattern Recogn. Lett.24, 1837–1844 (2003)
45. A Buades, B Coll, JM Morel, inIn Proceeding of IEEE Computer Society Conference on Computer Vision & Pattern Recognition. A non-local algorithm for image denoising, vol 2 (2005), pp. 60–65
46. PF Jin, Improved algorithm for Sobel edge detection of image. J. Appl. Opt.
29(4), 625–628 (2008) in Chinese
47. IK Vlachos, GD Sergiadis, Intuitionistic fuzzy information—applications to pattern recognition. Pattern Recogn. Lett.28, 197–206 (2007)