Amines' effect on CO
2
removal efficiency
Udara S.P.R. Arachchige
Faculty of Technology, University of Sri Jayewardenepura, Sri Lanka
Abstract:
Efficient CO2 mitigation techniques will become increasingly demanding due to environmental issues. There are many sources which release CO2 and combustion of fossil fuel plays the major role. Coal fired power plants are the most prominent CO2 emitting source today. The main purpose of this study is to understand the solvent’s effect on CO2 removal efficiency for power plant flue gas treating. Four different types of solvents are taken into consideration. MEA, Diethanolamine (DEA), Diglycolamine (DGA) and Methyldiethanolamine (MDEA) are applied as solvent for capturing processes. A coal fired flue gas removal process is implemented in to Aspen Plus. The solvent strength and lean loading are considered as most relevant factors for analyzing. With the variation of these factors, efficiency of CO2 removal from power plant flue gas is examined for different solvents. The four different solvents have unique optimum conditions such as; concentration, lean loading and solvent temperature, for highest removal efficiency. The suitable concentrations for MEA, DEA and MDEA are normally around 20-30wt%, however, DGA can be used as higher concentration solvent for CO2 removal. MDEA has low heat of regeneration and maximum loading capacity as well as less corrosive effect than MEA.
Keywords
Solvent properties, simulations, CO2 removal efficiency, temperature Profiles
1.
Introduction
Carbon dioxide (CO2) emission from
electric power generating sector can be accomplished by three different methods. The pre combustion CO2
capture, carbon is removed from the fuel prior to combustion, Oxy fuel combustion, coal is combusted with oxygen instead of air and finally, post combustion capture, where fossil fuel is combusted to produce energy, and in the end, CO2 is removed
from the flue gas [1].
The partial pressure of CO2 in the flue gas stream is
low. Therefore, technologies driven by high partial pressures, such as physical solvents or membrane
separation are not efficient for post combustion CO2
capture. The most suitable method is the chemical absorption process with amine based solvents. There are different types of amines available and some of them are categorized as primary amines (MEA, DGA), secondary amines (DEA), tertiary amines (MDEA, TEA), hindered amines (AMP) and cyclic amines (Piperazine). Primary amines are formed when one of three hydrogen atoms in ammonia is replaced by alkyl group. Secondary amines are formed form when two hydrogen atoms are substitute by two alkyl group and tertiary amines are formed with three alkyl groups combines with nitrogen. Cyclic amines are formed with 3-member ring called aziridine or 6-member ring piperidine. Hindered amines are arising with amine functional group surrounded by a crowded steric environment. Alkanolamines consist of both hydroxyl groups (-OH-) and amino groups (-NH2). The hydroxyl part helps to reduce vapor pressure and increase solubility of water while the amino group provides the required alkalinity in solution to perform reactions with acid gases [2].
In this study four different amine’s effect on CO2 removal efficiency is considered. These amines
are Monoethanolamine (MEA), Diethanolamine (DEA), Diglycolamine (DGA) and Methyldiethanolamine (MDEA). Basic information about these amines is given in Table 1.
Table 1. Properties of Amines [2]
Amine MEA DEA DGA MDEA
Chemical
formula C2H7NO C4H11NO2 C2H11NO2 C5H13NO2
Amines
category Primary Secondary Primary Tertiary
Molecular weight [g/mol]
61.08 105.14 105.14 119.163
Density
[g/cm3] 1.012 1.090 1.06 1.043
Boiling
point[°C] 170 217 223 247
2.
Model Development
The main objective of this study is to compare the different kind of amine's effect on CO2
capturing process. The model is implemented in Aspen Plus with Electrolyte NRTL property method. The 500MW coal fired power plant flue gas stream data is used for simulations with the parameters and kinetic data given in literatures [4], [5]. The explanation used for parameter calculation, process flow diagram and flue gas stream data related to implemented model is discussed in this section.
There are several models involve with calculating parameters in Electrolyte NRTL property method. In vapor phase fugacity coefficient and density, it use Redlich-Kwong equation of state and calculating enthalpy, entropy and Gibbs energy use ideal gas heat capacity together with Redlich-Kwong equation of state. Similar to that in liquid phase, calculating fugacity coefficient and Gibbs free energy, it uses extended Antoine vapor pressure and Henry’s constants.
ABSORBER STRIPPER
PUMP HEATER 1
HEATER 2 MIXER
COOLER SOLVENT
FLUE GAS
PURGE GAS
RICH
OUT TO HEAT
RICH IN
PURE CO2
LEAN CO2 HEATED LIQ LEAN OUT
MAKE UP Q
Figure 1. Process flow diagram
A simplified process flow diagram of an implemented model which employs CO2 capture by
absorption / stripping with an aqueous solvent is shown in Figure 1. Flue gas with CO2, H2S and other
components is introduced at the bottom of the absorber, where it flows upwards and counter currently contacts with the aqueous amine solution which is introduced at the top of the absorber. The absorber inlet streams are operated at 40°C and pressure inside the absorber maintained around 1 bar with 0.1 bar pressure drop. The amine solution is pumped through the heater where its temperature is raised by heat releasing from the lean amine stream. Subsequently, the heated rich amine stream at 115°C is supplied to the stripper at the top where it counter currently contacts steam around 120°C temperature. Stripper is operating around 2 bar pressure with 0.1 pressure drop throughout the column. The re-boiler
supplies the energy necessary to regenerate the amine solution and to separate acid gases that leave through the column top. The lean acid gas is then pumped through the heater unit to cool down the temperature which finally is recycled back to the absorber unit after adding the makeup stream.
Flue gas stream data for the four different models are given in the Table 2 [3], and the same flue gas condition is used for each model. Parameters and constants related to packed section is taken from the Stichlmair et al [6].
Table 2. Coal fired power plant flue gas data
Parameter Value
Flow Rate (tones/ hour) 2424.4
Pressure (bar) 1.1
Temperature (ºC) 40
Major components (mol %) Composition
H2O 8.18
N2 72.86
CO2 13.58
O2 3.54
H2S 0.05
3.
Simulation Studies
This section is divided into four different sub sections for each solvent.
3.1.
MEA
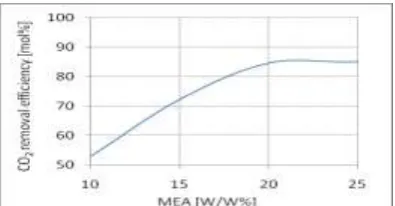
Figure 2 and 3 represent the MEA concentration and lean loading effect on removal efficiency. On the other hand, the liquid phase mole fraction variation with CO2 loading in the absorber bottom outlet
stream is shown in Figure 4.
Figure 3. CO2 removal efficiency variation with lean
loading (25w/w% MEA at 40°C)
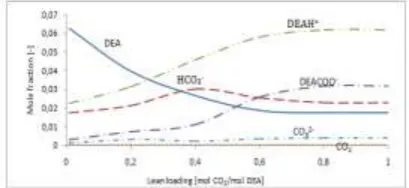
Figure 4. Liquid phase composition of a 25w/w% MEA solution loaded with CO2 at 40°C
The CO2 removal efficiency rapidly
increases with MEA concentration, but maximum efficiency according to the range of this study is obtained between 20-25% MEA concentrations (Figure 2). This is because of the increased capture capacity with amine concentration. When the lean loading of MEA solvent is increased from 15 to 35% [mol CO2/mol MEA], efficiency of the removal
process is drastically decreasing (Figure 3). The capacity of the solvent for CO2 absorption decreases
with the increase of lean loading, hence efficiency of the CO2 removal is decreasing [7]. The bulk
concentrations in liquid phase with CO2 loading is
illustrated in Figure 4 which shows stable liquid phase concentrations after 0.6 loading.
3.2.
DEA
Similar attempt in this section as for MEA is made to check the removal efficiency of DEA upon concentration and lean loading variation of DEA (Figure 5 and 6).
Figure 5. Removal efficiency variation with DEA concentration (25% lean loaded DEA at 40°C)
Figure 6. CO2 removal efficiency variation with lean
loading (40w/w% DEA at 40°C)
Figure 5 shows the DEA concentration effect on removal efficiency. Comparison of it against MEA plot suggests that the efficiency is lower than that of MEA system. Maximum efficiency of 58% in this case is achieved at 45[W/W%] concentrations. CO2 removal efficiency
variation with lean loading is given in Figure 6 and maximum efficiency reached, in the range tested, is 84% at 15% [mol CO2/mol MEA] lean loading. The
mole fraction variation in liquid phase with CO2
loading in the absorber bottom outlet stream is explained by Figure 7. It is almost similar to MEA plot (Figure 4), when analyzed at 40°C.
Figure 7. Liquid phase composition of a 40w/w% DEA solution loaded with CO2 at 40°C.
3.3.
DGA
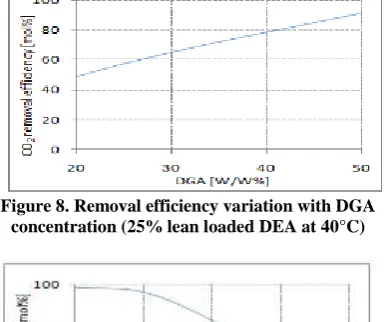
maximum efficiency in the range of varied during this work is achieved around 90% at 50 [w/w%] concentrations. CO2 removal efficiency variation
with lean loading given in Figure 9 showing that maximum efficiency observed about 98% at 15% [mol CO2/mol MEA] lean loading. Figure 10 is
mole fractions in liquid phase for the DGA analysis.
Figure 8. Removal efficiency variation with DGA concentration (25% lean loaded DEA at 40°C)
Figure 9. CO2 removal efficiency variation with lean
loading (45w/w% DGA at 40°C)
Figure 10. Liquid phase composition of a 45w/w% DGA solution loaded with CO2 at 40°C
3.4.
MDEA
MEA and DEA are the widely applicable and preferred alkanolamine for gas treating applications. However, recently MDEA has been used as an alternative to MEA and DEA in certain gas purification applications. It is used in bulk CO2
removal applications due to low heat of regeneration [8].
Figure 11 represents the variation of removal efficiency with MDEA concentration. However, efficiency is very low compared to the MEA, DEA and DGA systems and maximum efficiency achieved around 16% at 7% [w/w%] concentrations. CO2
removal efficiency variation with lean loading is given in Figure 12 and maximum efficiency of 17% is obtained at 15[mol CO2/mol MEA] % lean loading
for the range studied in this work. Mole fraction variation is given in Figure 13 for liquid phase.
Figure 11. Removal efficiency variation with MDEA concentration (20% lean loaded MDEA at 40°C)
Figure 12. CO2 removal efficiency variation with lean
loading (15w/w% MDEA at 40°C)
Figure 13. Liquid phase composition of a 15w/w% MDEA solution loaded with CO2 at 40°C
MDEA has a low heat of regeneration, and maximum loading capacity as well as it is less corrosive than MEA. The drawback of pure MDEA, on the other hand, is it has low reaction capability with CO2 directly due to lack of N-H bond, which
Chakravarty et al. [10] indicated that adding a small amount of primary or secondary amines, such as MEA or DEA, to the aqueous MDEA can enhance the absorption rate of CO2. The use of blended
amines for absorption of CO2 from flue gas streams
has received considerable attention because of the potential for low energy requirements for regeneration, high CO2 absorption capacity, good
chemical stability, and acceptable rate of CO2
absorption.
4.
Conclusion
The CO2 removal efficiency rapidly
increases as the amine concentration increases. The maximum efficiencies, in the range tested, are listed for different amines, see Table 3. Increasing efficiency is obtained because of increased capture capacity with amine concentration.
Table 3. Maximum CO2 removal efficiency at optimum
concentration according to the range of present study
Parameter MEA DEA DGA MDEA Efficiency
[mol%] 85 58 90 16 Concentration
[%] 22 45 50 7
Efficiency of MDEA is very low compared to the MEA, DEA and DGA systems and maximum efficiency achieved around 16% at 7[w/w%] concentrations. Pure MDEA does not react with CO2
directly due to lack of N-H bond, which is required to form carbamate ion with CO2.
When the lean loading of MEA solvent is increased, efficiency of the removal process decreases drastically. The capacity of the solvent for CO2 absorption decreases with the increase of lean
loading, hence efficiency of the CO2 removal is
decreasing.
5.
References
[1]. Arachchige, U.S.P.R.., " Carbon Dioxide Capture by Chemical Absorption: Energy Optimization and Analysis of Dynamic Viscosity of Solvents", Ph. D thesis, University of South-Eastern Norway, ISBN: 978-82-7206-516-3, 2019.
[2]. Polasek, J., Bullin, J.A., "Selecting amines for sweetening units", Energy Progress September 1984: 146- 150.
[3]. Freguia, S., "Modeling of CO2 removal from Flue Gas with
Mono-ethanolamine". Master Thesis, University of Texas, Austin, USA, 2002.
[4]. Arachchige U.S.P.R., Muhammed M., Melaaen M.C. "Optimized CO2 flue gas separation model for a coal fired power
plant". International Journal of Energy and Environment, 2013, 4, No. 1: 39-48.
[5]. Arachchige U.S.P.R., Muhammed M., Melaaen M.C. "Optimized Carbon Dioxide Removal Model for Gas Fired Power Plant". European Journal of Scientific Research, 2012, 86, No. 3: 348-359.
[6]. Stichlmair, J., Bravo, J.L., Fair, J.R., "General model for prediction of pressure drop and capacity of countercurrent gas/liquid packed columns". Gas Separation and Purification, Vol 3 March, 1989.
[7]. Arachchige, U.S.P.R., Aryal, N., Melaaen, M.C., "CO2-flue
gas separation for a gas-fired power plant", Proceedings, 10th Annual Conference on Carbon Capture and Sequestration, Pittsburgh, USA, 2-5 May, 2011.
[8]. Austgen, D. M., Rochelle, G. T., Chen, C. C., "Model of vapor-liquid equilibria for aqueous acid gas alkanolamine systems". University of Texas, Austin, USA, 1991.
[9]. Edali, M., Aboundheir, A., Idem, R., "Kinetics of carbon dioxide absorption into mixed aqueous solutions of MDEA and MEA using laminar jet apparatus and numerically solved absorption rate/kinetic model". University of Regina, Canada, 2007.
![Table 1. Properties of Amines [2] MEA DEA DGA](https://thumb-us.123doks.com/thumbv2/123dok_us/1889998.1247007/1.595.303.531.535.667/table-properties-amines-mea-dea-dga.webp)