Available Online atwww.ijcsmc.com
International Journal of Computer Science and Mobile Computing
A Monthly Journal of Computer Science and Information Technology
ISSN 2320–088X
IMPACT FACTOR: 6.017
IJCSMC, Vol. 8, Issue. 2, February 2019, pg.13 – 19
Support Vector Machine (SVM)
Based on Wavelet Transform (WT)
for Intrusion Detection System (IDS)
Sefer Kurnaz
1, Israa Abed Obaid
2¹²Computer Engineering & Altınbaş University, Turkey
1
[email protected]; [email protected]
Abstract— In this paper, SVM based DWT used to detect the IDS problem. SVM have many applications in different real live problems. The proposed method consists from two-part DWT and SVM. The DWT used to extract best and sensitive features from training data. The extracted features from DWT become input to the SVM and the SOFTMAX trained to classify the input data into two labels there is attack or not.
The experiment was implemented using MATLAB2016 on a dataset consist from 175,341 instance, each of these instance consist from 42 features and validated using 82,332 instance.
The proposed method is first time used to detect IDS problem and Produces 95.92% accuracy when validated by using UNSW-NB15 dataset. The experimental results show the proposed method presented satisfactory results when compared with best results obtained in this field.
Keywords— Wavelet Transform, SVM, IDS, Network, Security.
I. INTRODUCTION
The abundance of the e-devices and wide dependence on web founded applications for both, our even doings, as well as prominent use has directed to always cumulative network/internet communication. This has directed to the cohort of a marvelous quantity of traffic information at a high wild rate, affectation some thoughtful tests for harmless and dependable use of the internet by persons and institutions. As per the obtainable information, over the years there has been a marvelous upsurge in network traffic and a consistent increase in network intrusion or cyber-attacks. Depended on the Cisco studies, the size of the worldwide internet traffic will spread zettabytes (1021) by the year 2016 and double by the end of the year 2019 [1].
hurting network's Privacy, Honesty, and Obtainability possessions. It contains observing of unwelcome consumption of the network capitals, custody it obtainable for the genuine operators and in some cases stopping defeat of information/data to the interloper. IDS can be categorized into numerous ways and some of the classifications are:
1. Network-based and Host-based [2]:
In Network-based Intrusion Detection System (NIDS), each packet/ow in the network, whether incoming or outbound is examined by inhaling all the packets upcoming at the border of IDS. IDSs are installed deliberately at numerous positions in the network like Mainstay/Core layer, Supply layer, and Access layer. While, for Host-based Intrusion Detection System (HIDS) arrangement, IDS agendas in its place of a network are installed in every system of the network.
2. Passive and Active [3]:
An IDS, which only increases a fear in the occasion of an intrusion, is recognized as inert IDS. An IDS, which also receipts action in adding to rising a fear in reply to intrusions, is called vigorous IDS.
3. Signature based and Anomaly based [4]:
Autograph founded IDS is based on corresponding with a pattern of known attacks dragged from an information file with doings having harmful effect. Irregularity based IDS classifies the irregularities in the traffic, and it can distinguish unknown/new attacks in the network because it trusts on the rules as opposite to autograph based IDS.
In [6] three techniques used to classify the IDS data, decision tree (DT), linear regression (LR), artificial neural network (NB) and Regression Ramp Los K- Support Vector Machine (Ramp-KSVCR) which produce 85.56, 83.15, 82.07, 81.34, and 93.52 respectively. Furthermore, in [7] the author apply a wrapper approach based on a genetic algorithm.
One of the biggest contribution of this thesis is that really the WT optimized the performance of the SVM. In [8] ahmad et al. proposed SVM to detected the IDS by using the same dataset this method presented only 83.16% but in our study the SVM combined with WT and presented remarkable accuracy when compared with [8].
II. SUPPORTVECTORMACHINE
SVM depending on the idea of decision seaplanes that describe choice limits. A decision smooth is one that splits among a group of things having various classes memberships. A diagram instance is presented in the
Figure 1. In this instance, the items fit moreover to classes GREEN or RED. The splitting streak describes a
limit on the correct cross of which altogether items are GREEN and to the left-hand of which very items are RED. Any different item dropping to the correct is branded, i.e., categorized, as GREEN (or categorized as RED should it drop to the left-hand of the splitting line).
The beyond is a standard sample of a linear classifier. Greatest classification errands, yet are not that humble, and regularly more composite organizations are required so as to brand an ideal parting, i.e., appropriately categorize new items (testing) on the foundation of the sample that are obtainable (training). This state is showed in the diagram Figure 2. Likened to the forgoing diagram, it is strong that an occupied parting of the GREEN and RED items would need a curve. Classification errands depend on sketch splitting lines to differentiate among items of several classes associations are identified as hyperplane classifiers. SVM are mainly suitable to grip like errands.
Figure 2: nonlinear model [5]
The Figure 3 displays the simple impression behindhand Support Vector Machines. Here we see the innovative
items drawn, i.e., reordered, using a group of mathematical functions, identified as kernels. The procedure of reorganizing the substances is identified as charting (conversion). Note that in this original situation, the recorded items (right side of the diagram) is linearly separate and, therefore, instead of building the compound curve (left diagram), and find a best curve that can split the GREEN and the RED items.
III.DISCRETE WAVELET TRANSFORM (DWT)
DWT is a solicitation of the wavelet transform (WT) applying a separate group of the wavelet balances and changes succumbing approximately sure rules. Alternatively, this transfigure deteriorations the sign into similarly orthogonal usual of wavelets, which is the main alteration after the continuous wavelet transform (CWT), or its request for the separate period sequence infrequently entitled discrete-time continuous wavelet transform (DT-CWT) [9].
where j, k, nZ and a0 > 1.
IV.DISCRETE WAVELET TRANSFORM (DWT)
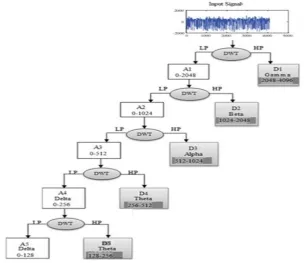
In this thesis, the input data first analyzed by using Wavelet Transform (WT), which try to obtained best features (which mean the features that produce the best results) from input data that represented the IDS attack
see Figure 6. Then, we will have tested all parameters (A1, A2, A3, A4, A5, D1, D2, D3, D4, D5) and the
parameter that produce the best classification accuracy from these parameters is chosen. Each signal divided into two parts and produce A1 and D1. Then, A1 also divided into two parts A2 and D2. A2 also divided into two parts A3 and D3. A3 separated into two parts A4 and D4. Finally, the A5 and D5. This mean every division procedure lead to divide the input information into 2 which mean reduce the information dimension and reduce the computation time and extracted the best features.
The features of IDS obtained by using the Eq (1)
Where j, k, are integer numbers, known as a wavelet series, DWT(i,k) represented the new array which is the wavelet array new signal. is the numeral of examples of the signal, , are the upper and lower bounds of the input signal.
Then, the obtained features are classified into classes that represented (normal and abnormal) classes by using SVM see Eq (2).
Generally, the proposed system consists from two sages: feature extraction stage and detection stage. wavelet transform used to extract important features (which mean the features that produce the best results) from input data to decrease the measurement of information The lead to decrease the computation time and growth the accuracy of the system. The output of first stage become input to the SVM which trained in supervised fashion by using extracted features by using wavelet transform. The trained system validated by using another data to calculate the performance of the system. The results related with common and best studies in this field.
B0 + (B1 * X1) + (B2 * X2) = 0 (3.2)
Where the constants (B1 and B2) that select the grade of the streak and the interrupt (B0) are originate by the training technique, and X1 and X2 are the 2 input parameters.
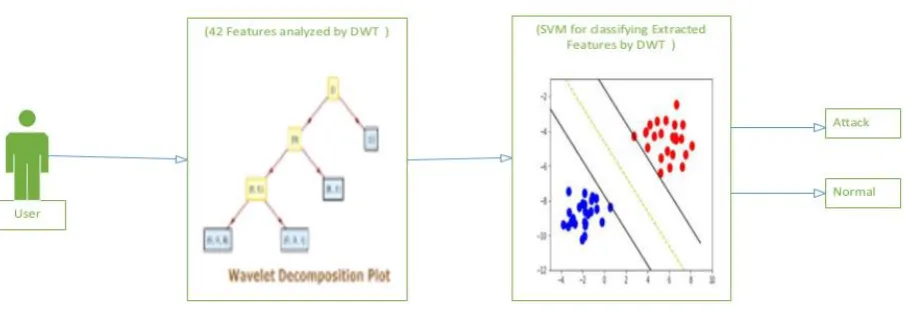
Then, the general block diagram of the proposed method is shown in Figure 7.
Figure 7: SVM Based DWT
As mentioned above any data consist from 42 features which is mean the data that sent by user. Then, these features are analyzed by using DWT which calculated the A1, A2, A3, D1, D2, D3 parameters each of these parameters represented number of features that used to classify the IDS case. Furthermore, the aim of this operation is to reduce the features dimension which mean reduce the execution time. Moreover, extracted sensitive features that can classified by the SVM in high accurate.
These parameters are tested using SVM to decide which of them presented remarkable results compared with previous studies
V. RESULTS
The dataset consists from 42 features as input and one column as target which represent the case there is IDS attack or not. The dataset consists from 257673 instance which divided into training and testing parts 175,341for training and 82,332 for testing.
Cross validation is used to avoid the overfitting problem, which five experimental are implemented for each parameter and the average accuracy of 5 experiments are listed in Table 1.
Number of parameters are calculated to evaluate the performance of the proposed method: sensitivity (TPR), specificity (SPC), precision (PPV) and accuracy (ACC). These parameters are calculated in equations (2-5)
TPR = (2)
SPC = (3)
PPV = (4)
ACC = (5)
Table 1: Experimental Results
Parameters Sensitivity Specificity Precision Accuracy
A1 0.8915 0.9823 0.9449 0.9592 D1 0.7972 0.9500 0.8449 0.9111 A2 0.7760 0.9204 0.7449 0.8871 D2 0.7028 0.9178 0.7449 0.8631 A3 0.6712 0.9165 0.7449 0.8511 D3 0.5913 0.9122 0.7449 0.8151
The obtained results that’s presented in Table 1 shown that the A1 presented best results which is 0.9592. Furthermore, D1 presented 0.9111, A2 presented 0.8871, D2 presented 0.8631, A3 presented 0.8511 and D3 presented 0.8151.
The experimental results show that the reduce in the features dimension lead to decrease the performance of the IDS.
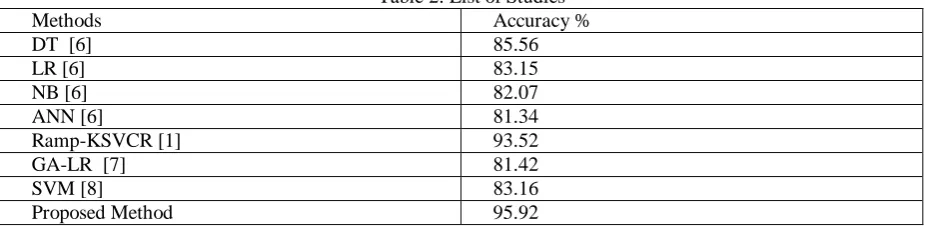
The proposed method compared with well-known studies in this field which used to detect IDS and validated using UNSW-NB15. The proposed method presented best result than previous studies presented in this field as shown in Table 2.
Table 2: List of Studies Methods Accuracy % DT [6] 85.56 LR [6] 83.15 NB [6] 82.07 ANN [6] 81.34 Ramp-KSVCR [1] 93.52 GA-LR [7] 81.42 SVM [8] 83.16 Proposed Method 95.92
VI.CONCLUSION
In this thesis, new method proposed to IDS detection by using SVM based WT. This is the first time SVM based WT used to detect IDS. The proposed method extracted sensitive features and reduce the dimension of features by using WT. This lead to produce 95.92% accuracy which is remarkable results when compared with previous studies. The increase in using internet in different fields such as banking, online shopping and hotel reservation lead to increase in IDS attacks too. Therefore, number of studies in IDS detection using automatic systems and methods was increased.
The major conclusion from this study is that the A1 presented the highest accuracy when compared with other parameters, which highest accuracy presented by A1 and The lowest accuracy presented by D3. This mean in very low dimension features the accuracy also will become low.
As future work the phishing websites can by classified by using another machine learning technique such as Bayesian, Neural Networks, LSTM and recurrent neural network. The use of WT technique presented best results than traditional methods that used in previous studies. Therefore, the power of machine learning techniques optimized by using WT, this combination can be applied to another classification problem too.
REFERENCES
[1] Cisco. Cisco Visual Networking Index: Forecast and Methodology, 20152020. http://www.cisco.com/c/dam/en/us/solutions/collateral/service- provider/visual-networking-index-vni/complete-white-paper-c11- 481360.pdf, 2016. Online; Last accessed :24-July-2016
[2] Ahmad Shari, Akram Noorollahi, and Farnoosh Farokhmanesh. Intrusion detection and prevention systems (idps) and security issues. International Journal of Computer Science and Network Security (IJCSNS), 14(11):80, 2014.
[3] Stefan Axelsson. Intrusion detection systems: A survey and taxonomy. Technical report, 2000.
[4] Pedro Garc a-Teodoro, JesuS az-Verdejo, Gabriel Maci a-Fernandez, and Enrique Vazquez. Anomaly-based network intrusion detection: Techniques, systems and challenges. Comput. Secur., 28(1-2):18{28, February 2009.
[5] M.J.D. Powell, Radial basis functions for multivariable interpolation: a review, Chapter 9 in Algorithms for Approximation, Clarendon Press, New York, 1987, pp. 143–167, ISBN: 0- 19-853612-7.
[6] S. M. Hosseini Bamakan, H. Wang, and Y. Shi, “Ramp loss K-Support Vector Classification-Regression; a robust and sparse multi-class approach to the intrusion detection problem,” Knowledge-Based Syst., vol. 126, pp. 113–126, 2017.
[7] C. Khammassi and S. Krichen, “A GA-LR wrapper approach for feature selection in network intrusion detection,” Comput. Secur., vol. 70, pp. 255–277, 2017
[8] Ahmad M. Karim, Mehmet S. Güzel, Mehmet R. Tolun, Hilal Kaya, and Fatih V. Çelebi, “A New Generalized Deep Learning Framework Combining Sparse Autoencoder and Taguchi Method for Novel Data Classification and Processing,” Mathematical Problems in Engineering, vol. 2018, Article ID 3145947, 13 pages, 2018. https://doi.org/10.1155/2018/3145947.
![Figure 1: Classified, as GREEN (or classified as RED) [5]](https://thumb-us.123doks.com/thumbv2/123dok_us/1895618.1247910/2.595.209.384.552.669/figure-classified-green-classified-red.webp)
![Figure 2: nonlinear model [5]](https://thumb-us.123doks.com/thumbv2/123dok_us/1895618.1247910/3.595.166.433.470.674/figure-nonlinear-model.webp)