Western University Western University
Scholarship@Western
Scholarship@Western
Electronic Thesis and Dissertation Repository
12-10-2018 2:00 PM
Tension Analysis in Survivor Interviews: A Computational
Tension Analysis in Survivor Interviews: A Computational
Approach
Approach
Jumayel Islam
The University of Western Ontario Supervisor
Mercer, Robert E.
The University of Western Ontario Co-Supervisor Xiao, Lu
Syracuse University
Graduate Program in Computer Science
A thesis submitted in partial fulfillment of the requirements for the degree in Master of Science © Jumayel Islam 2018
Follow this and additional works at: https://ir.lib.uwo.ca/etd Part of the Linguistics Commons
Recommended Citation Recommended Citation
Islam, Jumayel, "Tension Analysis in Survivor Interviews: A Computational Approach" (2018). Electronic Thesis and Dissertation Repository. 5878.
https://ir.lib.uwo.ca/etd/5878
This Dissertation/Thesis is brought to you for free and open access by Scholarship@Western. It has been accepted for inclusion in Electronic Thesis and Dissertation Repository by an authorized administrator of
Abstract
Tension is an emotional experience that can occur in different contexts. This phenomenon can originate from a conflict of interest or uneasiness during an interview. In some contexts, such
experiences are associated with negative emotions such as fear or distress. People tend to adopt
different hedging strategies in such situations to avoid criticism or evade questions.
In this thesis, we analyze several survivor interview transcripts to determine different char-acteristics that play crucial roles during tension situation. We discuss key components of tension experiences and propose a natural language processing model which can effectively combine these components to identify tension points in text-based oral history interviews. We
validate the efficacy of our model and its components with experimentation on some standard datasets. The model provides a framework that can be used in future research on tension
phe-nomena in oral history interviews.
Keywords: emotion recognition, hedge detection, oral history, interview transcripts, social
discourse, reticence, tension
Acknowledgements
I would like to express my sincere gratitude to my thesis supervisors Dr. Robert E. Mercer
and Dr. Lu Xiao for their continuous support and guidance throughout the entire time of my Masters study. I am really thankful to them for their patience, encouragement and always
steering me in the right direction whenever they thought I needed it. Furthermore, I would
like to thank Dr. Steven High for his useful comments, remarks and engagement through the
learning process of this Masters thesis. I am gratefully indebted to his valuable comments on
this thesis. I would also like to thank his group at the Centre for Oral History and Digital
Storytelling for providing us with the transcribed and translated interviews.
I would like to thank the Department of Computer Science of Western University for its
support towards my studies and providing me with scholarship. I would also like to thank
Concordia University and Dr. Steven High for providing me with the financial support for my research.
Finally, I must express my very profound gratitude to my parents and friends for providing
me with unfailing support and continuous encouragement throughout my years of study and
through the process of researching and writing this thesis. This accomplishment would not
have been possible without them. Thank you.
Contents
Abstract i
Acknowlegements ii
List of Figures vi
List of Tables vii
1 Introduction 1
2 Literature Review 4
3 Overall Architecture 6
3.1 Overview . . . 6
3.2 Emotion Recognition . . . 6
3.3 Hedge Detection . . . 7
3.4 Tension Detection . . . 8
3.4.1 Booster Words . . . 8
3.4.2 Markers . . . 9
3.4.3 Asking a Question Back . . . 9
3.4.4 Outliers . . . 9
3.4.5 Proposed Algorithm . . . 10
3.5 Summary . . . 12
4 Multi-channel CNN Model for Emotion and Sentiment Recognition 13 4.1 Introduction . . . 13
4.2 Related Work . . . 15
4.3 Proposed Model . . . 16
4.3.1 Embedding Layer . . . 17
4.3.2 Convolutional Layer . . . 18
4.3.3 Pooling Layer . . . 19
4.3.4 Hidden Layers . . . 19
4.3.5 Output Layer . . . 19
4.4 Experiments . . . 20
4.4.1 Datasets . . . 20
4.4.2 Experimental Setup . . . 21
4.4.2.1 Data Cleaning . . . 21
4.4.2.2 Input Features . . . 22
4.4.2.3 Network Parameters and Training . . . 24
4.4.2.4 Regularization . . . 24
4.5 Performance . . . 24
4.6 Summary . . . 29
5 A Lexicon-based Approach for Identifying Hedges 30 5.1 Introduction . . . 30
5.2 Related Work . . . 33
5.3 Lexicons . . . 34
5.4 Rules for Disambiguating Hedge Terms . . . 35
5.5 Experiments . . . 40
5.5.1 Data . . . 40
5.5.2 The Annotation Procedure . . . 40
5.5.3 Proposed Algorithm . . . 41
5.5.4 Performance . . . 43
5.6 Summary . . . 44
6 Performance Analysis 45 6.1 Experimental Results . . . 45
6.2 Discussion . . . 46
6.3 Summary . . . 47
7 Conclusion and Future Work 48 7.1 Conclusion . . . 48
7.2 Future Work . . . 49
Bibliography 50
A Booster Words 60
B Hedge Words 61
C Discourse Markers 62
D Cues 64
Curriculum Vitae 65
List of Figures
4.1 Overview of the MC-CNN model . . . 17
5.1 Dependency tree for the example“I hope to, someday, but no, I haven’t reached it yet.” . . . 36
5.2 Dependency tree for the example“A message of hope and daring to shed light on everything we see.”. . . 36
5.3 Dependency tree for the example“I think it’s a little odd.” . . . 36
5.4 Dependency tree for the example“I think about this all the time.”. . . 36
5.5 Dependency tree for the example“I assume he was involved in it.” . . . 37
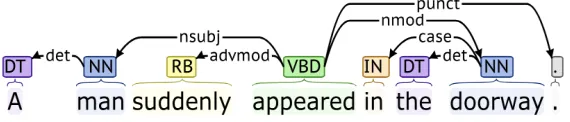
5.6 Dependency tree for the example“He wants to assume the role of a counselor.” 37 5.7 Dependency tree for the example“The problem appeared to be more serious than we thought.” . . . 37
5.8 Dependency tree for the example“A man suddenly appeared in the doorway.” . 37 5.9 Dependency tree for the example“I suppose they were present here during the genocide.” . . . 38
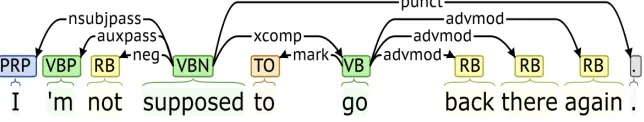
5.10 Dependency tree for the example“I’m not supposed to go back there again.” . 38 5.11 Dependency tree for the example“We tend to never forget” . . . 38
5.12 Dependency tree for the example“All political institutions tended toward despo-tism.” . . . 38
5.13 Dependency tree for the example“Perhaps I should be asking how we should all consider each other.” . . . 39
5.14 Dependency tree for the example“He should have been more careful.” . . . 39
5.15 Dependency tree for the example“We will likely visit there once again.” . . . . 39
5.16 Dependency tree for the example“He is a fine, likely young man.” . . . 39
List of Tables
4.1 Basic statistics of the emotion datasets. . . 20
4.2 Basic statistics of the sentiment datasets. . . 20
4.3 Ranges of different hyper-parameters . . . 23
4.4 Results (in %) of our model (MC-CNN) for four emotion-labeled datasets. . . . 25
4.5 Results (in %) of our model on sentiment labeled datasets (2 class) . . . 26
4.6 Results (in %) of our model on sentiment labeled datasets (3 class) . . . 27
4.7 Comparison of results (accuracy in %) of three variants of our model for emo-tion labeled datasets . . . 27
4.8 Comparison of results (accuracy in %) of three variants of our model for senti-ment labeled datasets . . . 28
4.9 Cross-corpus results (Accuracy in %) for emotion labeled datasets . . . 28
4.10 Cross-corpus results (Accuracy in %) for sentiment labeled datasets . . . 28
5.1 Statistics of our interview datasets . . . 40
5.2 Hedging annotation statistics . . . 41
5.3 Comparison of results (in %) of our hedge detection algorithm (2 annotators) . 43 5.4 Comparison of results (in %) of our hedge detection algorithm (1 annotator) . . 43
5.5 Comparison of results (in %) of our hedge detection algorithm (1 annotator) . . 44
6.1 Results of our tension detection algorithm . . . 46
Chapter 1
Introduction
Oral history is the systematic collection of living people’s testimony about their own
expe-riences [55]. It is a strategy for conducting historical research through recorded interviews
between a storyteller with individual experience of historically significant events and a
well-informed questioner, with the objective of adding to the historical record [70]. It plays a
signif-icant role for historians to understand the experience shared by the people from their past and
analyze it effectively. One of the crucial benefits of oral history interviews is that they can shed light on important issues that might not have been present in previous historical narratives.
Oral history interviews can be free form where the interviewer allows the narrator to speak freely with the recorder turned on. Narrators do not usually have to worry about being
in-terrupted with questions from the interviewer in such a form of interview [91]. On the other
hand, some interviews are well-structured. Such interviews have the interviewer asking a set
of questions to the narrator in order to get as much information as possible. Often in such
interviews, though the interviewers have a specific set of guidelines for asking questions, they
might need to improvise in order to capture certain information at certain times through out the
interview. Sometimes, the narrators don’t feel able to speak freely on certain matters causing
a conflict of interest, i.e., tension between the interviewer and the narrator [43]. Tension is the
feeling that is produced in a situation when people are anxious and do not trust each other, and when there is a possibility of sudden violence or conflict [44]. It is a situation or condition of
hostility, suspense, or uneasiness. In psychology, tension is defined as an emotion of physical
and psychological strain joined by discomfort, unease, and pressure to look for alleviation via
talking or acting [61]. Tension is also defined as a state of latent hostility or opposition between
individuals or groups [4].
Oral history interviews involve complex social interactions and different factors highly in-fluence the interview situation such as complexity of human lives, age, intelligence, personal
quality, etc. [11]. Both the interviewer and the interviewee contribute to these components
2 Chapter1. Introduction
and often it generates a situation which can be difficult for both parties, causing unpredictable emotional responses by the interviewee which changes the interview dynamics. Understanding
these factors and the turning points in an interview is important for the interviewers to
under-stand the process of interviewing and also for self-awareness [11]. Misztal [48] suggests that emotions lead directly to the past and bring the past somatically and vividly into the present.
This motivates our interest in analyzing the emotional aspect of the interview, how it affects the internal dynamics and it’s impact on causing tension between the narrator and the interviewer.
Layman (2009) [43] showed how reticence can also cause conversational shifts by
inter-viewees which often limits responses on certain issues. It is a common strategy adopted by
the narrators to avoid either outright refusal to respond or full disclosure. For example, the
use of discourse markers such as “not really”, “not that I remember” or “well, anyway” in
responses shows how reticence can be influential in an interview. This phenomenon indicates
tension points in an interview and gives interviewers an idea that the conversational flow has
somewhat been disrupted. Layman (2009) [43] also showed how certain topics can lead the
narrators to employ such strategies in order to avoid answering certain questions. More often such responses are filled with reticence and are either short or dismissive. Subjects which
ad-dress individual trauma, regardless of whether torment or dread or humiliation, are probably
going to incite hesitant reactions from narrators. This leads to interviewers’ judgement whether
to press the interviewee when it becomes evident that the narrator is reluctant to speak on
cer-tain matters. Thus, it imposes the necessity of analyzing such phenomenon and building tools
that can automate the process of identifying tension points in interviews giving the interviewers
much more flexibility to understand and control the flow of the interview.
Ponterotto (2018) [66] showed how hedging is used in conversations to deal with
controver-sial issues. Hedging refers to the technique of adding fuzziness to the propositional content by
a speaker. It is a common hesitation strategy adopted by the narrators in oral history interviews.
It gives narrators a moment to think and organize their thoughts to plan a successful response. For example, the usage of“I think ...”,“Well, ...” in interviews give narrators the authority to
shape their narratives. Thus, it is an important element to explore in order to identify tension
points in such interviews.
In this thesis, our final objective is to detect tension in oral history interviews such as
survivor interview transcripts. To achieve this, we identify lexical variations in narratives,
recognize emotions which may affect the interview dynamics, and analyze hedge strategies. We apply computational approaches to automate this process of identifying the tension
phe-nomenon in survivor interviews.
The rest of the thesis is structured as follows: In addition to the discussion above, Chapter 2
3
Literature related to emotion detection and hedging is reviewed in the appropriate chapters.
Chapter 3 describes the overall architecture of our system. Chapter 3 also briefly describes
different modules that have been used in this study. Chapter 4 describes our proposed model for emotion recognition and gives a comprehensive evaluation of the model on some standard datasets. Chapter 5 describes in detail different hedging strategies and our proposed approach for identifying hedging and discourse moves in survivor interviews. In Chapter 6, we provide
our experimental results on two survivor interviews and give a thorough analysis of our system.
We also discuss different aspects of our architecture, its advantages and its shortcomings in this chapter. Lastly, in Chapter 7, we give a summary of the research work that has been done for
Chapter 2
Literature Review
This chapter reviews some of the studies that have been done in recent years to analyze
inter-view dynamics and how different factors affect the interview flow, causing tension between the interviewer and the interviewee. We also discuss some of the computational approaches that
have been developed to identify such a phenomenon. We provide detailed analysis of past
liter-ature concerned with the various components of our architecture in the later chapters: emotion
detection in Chapter 4 and hedging and discourse markers in Chapter 5.
One of the important factors in interviews that shows signs of tension between the
inter-viewer and interviewee is hedging. Ponterotto (2018) [66] discussed different hedging strate-gies that have been employed by Barack Obama, the former president of the United States, in
political interviews affecting interview dynamics by changing the flow of conversation. They presented an in-depth analysis of the president’s responses by identifying hedging-related
dis-cursive strategies. In their work, they proposed four crucial discourse moves. “Reformulating
the interviewer’s question”; “Expanding the scope of the original question sequence”;
“Switch-ing the time frame of the question context” and “Recast“Switch-ing the question reference from specific
to general terms”. They also discussed hesitation strategies, such as, pauses and repairs (yes,
no), restarts(I won’t ... I won’t say)and discourse markers(anyhow, anyway, I mean).
Pedro Martín (2013) [14] discussed four common hedging strategies: Indetermination,
Camouflage, Subjectivization and Depersonalization. We provide brief details about these
strategies motivated by the description found in [5]. Strategy of Indetermination includes the usage of various epistemic modality, for example, epistemic verbs (assume, suspect, think),
epistemic adverbs (presumably, probably, possibly), epistemic adjectives (apparent, unsure,
probably), modal verbs(might, could) and approximators(usually, generally). Usage of such
epistemic modality provides vagueness and uncertainty in the interviewee’s response. Strategy
of Camouflage includes the use of different adverbs, e.g., generally speaking, actually. This method acts as a lexical device to avoid a negative reaction by the interviewer. Strategy of
5
Subjectivization is activated by the usage of first person pronouns followed by verbs of
cogni-tion, for example,“I think”, “I feel”. These expressions have been given the term “Shield” in
[67]. This technique allows the interviewees to express their opinion freely in certain events
causing the interviewers to oblige and listen. Strategy of Depersonalization includes the use of impersonal pronouns or constructs, for example, “we”, “you”, “people”. This allows the
interviewees to hide themselves behind a non-identified subject.
Though interview dynamics have been studied thoroughly in the past [11, 43, 48, 66, 91],
there are very little work that have been done to apply computational approaches to automate
the process of detecting tension in interviews. Burnap et al. (2015) [13] performed
conversa-tional analysis and used different text mining rules to identify spikes in tension in social media. They showed how lexicons of abusive or expletive terms can identify high levels of tension
separated from low levels. Their proposed tension detection engine relies solely on the
lexi-cons and membership categorization analysis (MCA) [72]. They showed that their proposed model consistently outperforms several machine learning approaches and sentiment analysis
tools.
Buechel et al. (2018) [12] provided the first publicly available dataset for text-based distress
and empathy prediction. Distress is a negative affective state that people feel when they are upset about something. Distress is closely related to tension, the main focus of this thesis.
Buechel et al. (2018) [12] considered the problem of distress and empathy prediction as a
regression problem. They used a Feed-forward Neural Network with word embeddings from
Fast-Text as their inputs and a Convolutional Neural Network model with one convolutional
layer with three different filter sizes. They argue that CNN models are able to capture semantic effects from the word order. They showed that CNN performs particularly well in detecting distress compared with detecting empathy from text.
In this chapter, we discussed different factors that affect the interview dynamics. We also gave brief details about the studies that have been done to identify tension-like phenomena in
text. We provide a detailed literature review of the different components of our architecture in their respective chapters. There has been very little work done in detecting tension from
interview collections. In this thesis, we introduce a novel computational approach to detect
Chapter 3
Overall Architecture
This chapter gives an overview of the architecture of our overall system. We briefly present
the components of our framework. We also discuss our proposed algorithms for tackling the
problem at hand. More detailed discussions of the main components are provided in Chapters
4 and 5.
3.1
Overview
The two core components of our proposed architecture for detecting tension in interview tran-scripts are: the Emotion Recognition Module and the Hedge Detection Module. We give a
brief overview of these components in this chapter and we give a detailed analysis of these
components in their respective chapters. We also talk about other important features (booster
words, markers, etc.) which we found to be useful during our analysis in this chapter. We
provide pseudo-code for our tension detection algorithm combining all these components.
3.2
Emotion Recognition
The first component in our system is the emotion recognition module. As we discussed
ear-lier, emotion plays a vital role in determining tension situations in survivor interviews. The
following excerpt from an oral history interview1 shows how emotion can dominate a tension
situation.
Interviewer: Even if they do - but the Hutus can pray in their Hutu churches and
the Tutsis in the Tutsi churches.
1In all transcript excerpts, the questions by the interviewer will be indicated by “Interviewer”, and the
intervie-wee’s response by “Narrator”. The interview transcripts can be found athttp://livingarchivesvivantes. org/.
3.3. HedgeDetection 7
Narrator:Exactly. You see, it’s odd, no, I’m not going to waste my time praying
in these circumstances because it’s completely - it’s hogwash.
Interviewer: Tell me
-Narrator: But what is even more serious is that there are Canadians, especially
Quebecers, who stand behind the factions and are even more extremist than we
are!
Interviewer: Indeed.
Narrator:It’s strange!
As we can see by the responses, the narrator feltanger at that moment of time, thus creating
a tension situation between the interviewer and narrator. Tension can also arise at the very be-ginning of an interview but there might not be any visible indicators of it until some later point.
Sometimes the interviewers keep pushing which makes the interviewee really uncomfortable
changing the dynamics of the situation. As a result two opposing forces arise in such situation
which are sometimes so strong that we can detect it, which, we refer to as tension. Interviewees
usually show different emotions as discomfort in such scenarios. Jurek et al. (2015) [36] also showed how negative sentiment or emotion can lead to tension.
In our studies, we have found negative emotions such asanger, fear, disgust, sadnessto be
particularly important in tension situations, thus, we incorporate these emotional categories in
our algorithm. We provide pseudo-code for emotion recognition in Algorithm 1. We provide
a detailed analysis of this emotion recognition component in Chapter 4 where we discuss our proposed model and do a comprehensive performance evaluation of the model.
3.3
Hedge Detection
The second component of our proposed architecture is the hedge detection module. We have
discussed previously how interviewees employ different hedging strategies in tension situations to change the flow of conversation or to show their reluctance in responding to certain topics.
The following excerpt from an interview shows a scenario like this:
Interviewer: Do you think that one day you may want to meet them?
Narrator: It’s a good question. I don’t know. We think we’d meet them, but
meeting someone who says "No, I didn’t do that," yet we know they have, it’s also
- in any case, I am reluctant. I am not so sure.
In the above example, as we can see, the use of phrases like“I don’t know”,“We think”shows
8 Chapter3. OverallArchitecture
among the interviewer and the interviewee. Hedging is presented in more detail in Chapter
5 where we also discuss our proposed approach for detecting hedges in interview transcripts,
along with a performance analysis of our approach.
3.4
Tension Detection
Our tension detection algorithm is composed of the Emotion Recognition Module and the
Hedge Detection Module. In addition, we have additional features which we have found to be
useful in our studies. We provide details about these features below.
3.4.1
Booster Words
Boosting, using terms such asabsolutely, clearlyand obviously, is a communicative strategy for expressing a firm commitment to statements. Holmes (1984) [32] provides an early
defini-tion of boosting. According to him, “Boosting involves expressing degrees of commitment or
seriousness of intention”. It allows speakers to express their proposition with confidence and
shows their level of commitment to statements. It also restricts the negotiating space available
to the hearer.
Boosting plays a vital role in creating conversational solidarity [32] and in constructing an
authoritative persona in interviews [31]. The following example shows a use of“completely”
as a booster word during an interview.
Interviewer: Before returning to I don’t know where after that?
Narrator: Do you know what happened to me afterwards? Oblivion, amnesia.
I can’t tell you how long we stayed in Kabuga, I can’t tell you when we left for
Kabuga and on what date we left Kabuga - no. When I think about it, it’s like a
single day that is being drawn out. Icompletelylost the notion of time. That may
have helped me survive, but my capacity to remember was blocked.
In this thesis, we have compiled a lexicon of booster words from different online resources. This lexicon can be found in Appendix A. Interestingly, if booster words are preceded by
negated words such as “not”, “without”, it can act as hedging. For example, “I’m still not
sureif I would go back, I don’t know what it would be like.” Here, “sure”is a booster word.
However, since it is preceded by a negation word “not”, it changes the meaning completely.
3.4. TensionDetection 9
3.4.2
Markers
The use of markers (e.g., laugh, silence, sigh) in such interviews is noteworthy. These have
various functions. Sometimes markers like “laughter” indicate invitations to the interviewer to ask the next question. At other times it represents hesitation or nervous deflection. In our
thesis, we have compiled a lexicon (Appendix D) of such markers/cues and used them in our tension detection algorithm. The example below shows a use of the marker “laugh”:
Interviewer: What would you like Canadians to know about you?
Narrator: I don’t know [laughs]. ... It’s a question of mutual acceptance.
Some-times we can be suspicious, thinking that Canadians haven’t lived through such
major events, but ... they also have things to share ... I think it’s a question of ...
opening up to the experience of others...
3.4.3
Asking a Question Back
When the interviewee poses a question back, asking for clarification, that is also a sign that
interviewee is trying to negotiate, a good marker for identifying tension points. In our tension
detection algorithm, we use this as a potential criterion. The example below demonstrates a situation like this:
Interviewer: So going back now to the period of 1994, during the genocide - you
saw it coming, but how did you live through that time?
Narrator:How do you mean?
3.4.4
Outliers
Interview dynamics provide examples of a narrator giving unusually long or short answers for
a specific question type. During our lab discussions we felt that this type of dynamic could be
a sign of tension, so we added this as one of the criteria in our tension detection algorithm. We
find statistics (mean and standard deviation) based on question type over the whole interview
transcript which allows us to determine if a response by the interviewer is unusually long or
short in comparison with their other responses for the same question type. We consider
wh-question,how,yes-noandmixed(mix of other question types) as the prime question types. We find the mean (Equation 3.1) and standard deviation (Equation 3.2) for each type.
µqt ← 1
N(qt) N(qt)
X
i=1
10 Chapter3. OverallArchitecture
σqt ←
s PN(qt)
i=1 (wi(qt)−µ(qt))2
N(qt)−1
(3.2)
Here, µqt indicates the mean for the question type qt, σqt indicates the standard deviation for
the question typeqt,wi(qt) indicates the total number of words in excerpteibelonging toqtand N(qt) indicates the total number of excerpts belonging to eachqt. We consider a response to be an outlier, thus a possible point for tension, if it falls below 3σqt or is above 3σqt.
3.4.5
Proposed Algorithm
Here, we provide the pseudo-code for tension detection and its components:
Algorithm 1Emotion Detection algorithm
1: functionisNegativeEmotion(s)
2: Predict emotion usingMC-CNNmodel
3: if Predicted Emotion∈{anger, fear, disgust, sadness}then
4: returnTrue
5: else
6: returnFalse
7: end if
8: end function
Algorithm 2Tension Detection algorithm
1: functionTensionDetection()
2: Excerpts(E)←List of narrator’s responses
3:
4: Markers (M)←List of evasions markers and cues
5: Single Excerpt(e)←List of sentences in each response
6:
7: qt ←Question type (wh-question/how/yes-no/mixed)
8:
9: wi(qt)←Total number of words in excerptei belonging toqt
10:
11: N(qt)←Total number of excerpts belonging to eachqt
12:
13: Mean, µqt ← 1 N(qt)
PN(qt)
i=1 {wi(qt)}
14:
15: Standard Deviation, σqt ←
r
PN(qt)
i=1 (wi(qt)−µ(qt))2 N(qt)−1
16:
17: foreach excerpteinEdo
3.4. TensionDetection 11
19: q←Question asked by the Interviewer
20: nSentences←Firstnsentences ine
21: isNegativeEmotion,eneg =False
22: isHedgedSentence,hs=False
23: isBoosting,bs =False
24: markerPresent,mp =False
25: isQuestion,qs =False
26: isOutlier,or =False
27: foreach sentence sin nSentencesdo
28: if isNegativeEmotion(s) is Truethen
29: eneg =True
30: end if
31: if isHedgedSentence(s) is Truethen
32: hs=True
33: end if
34: if isBoosting(s) is Truethen
35: bs=True
36: end if
37: end for
38: for AinM do
39: if Ainethen
40: mp =True
41: end if
42: end for
43: if nSentences[0] is a Questionthen
44: qs=True
45: end if
46: if w> µqt +3∗σqt orw< µqt −3∗σqt then
47: or =True
48: end if
49: if (enegandhs) or (hsandbs) or (hsandmp) orqsororthen
50: mark excerpt asTension
51: else
52: mark excerpt asNo Tension
53: end if
54: end for
55: end function
56: functionisBoosting(s)
57: Boosters(B)←List of booster words
58: forbinBdo
59: if binBandbis not preceded bynotorwithoutthen
60: returnTrue
61: end if
62: end for
63: returnFalse
12 Chapter3. OverallArchitecture
3.5
Summary
In this chapter, we have provided an overview of our tension detection architecture. We have
also briefly discussed some of its core components. Emotion plays a significant part in the
ten-sion situation in an interview. Hedging or reticence largely contributes to it, as well. Hedges
and boosters draw attention to the fact that statements don’t just communicate ideas, but also
the speaker’s attitude to them [30]. Lastly, we have provided our tension detection algorithm
along with pseudo-code for the core components of our architecture. Details of these
Chapter 4
Multi-channel CNN Model for Emotion
and Sentiment Recognition
This chapter discusses about one of the core components of our tension detection architecture,
namely emotion recognition. We provide brief details of the recent works that have been done
in this field of research. We also discuss in details about our proposed model for recognizing
emotion from text. We give an in-depth analysis of our model by evaluating performance on
some standard datasets.
4.1
Introduction
Emotion plays a significant role in oral history interviews. Misztal [48] suggests that emotions
lead directly to the past and bring the past somatically and vividly into the present causing a
shift in interview dynamics. Jurek et al. (2015) [36] also showed how negative sentiment or
emotion can lead to tension. Emotion recognition in computational linguistics is the process of
identifying discrete emotion expressed by humans in text. In the past decade, emotion
detec-tion in text has become widely popular due to its vast applicadetec-tions in marketing, psychology,
political science, etc. The evolution of different social media sites and blogs has paved the way for researchers to analyze huge volume of opinionated text. As a result, it has caught attention of lot of researchers of related fields. Emotion analysis can be viewed as a natural evolution
of sentiment analysis. While sentiment analysis deals with polarity of texts (positive, negative
or neutral) and the intensity of it, emotion mining deals with identifying human emotion
ex-pressed via text. However, this field still has a long way to go before matching the success and
ubiquity of sentiment analysis. Identifying discrete human emotions can be useful in lots of
applications such as analyzing interview dynamics, political campaigns, etc.
14 Chapter4. Multi-channelCNN Model forEmotion andSentimentRecognition
There is often a misconception about sentiments and emotions as these subjectivity terms
have been used interchangeably [56]. Munezero et al. (2014) [56] differentiate these two terms along with other subjectivity terms and provide the computational linguistics community with
clear concepts for effective analysis of text. While sentiment classification tasks deal with the polarity of a given text (whether a piece of text expresses positive, negative or neutral
sentiment) and the intensity of the sentiment expressed, emotion mining tasks naturally deal
with human emotions which in some end purposes are more desirable [69][19][54].
There are four approaches that have been widely used in emotion detection studies. They
are keyword based, learning based, hybrid based and rule-based approaches. Keyword based
approach usually depends on some sort of emotion lexicons. This approach is fairly easy to
implement as it depends on identifying emotion keywords in text mostly. But this approach
has some major limitations because of its complete reliance on emotion lexicons. For
exam-ple, “I passed the test” and “Hooray! I passed the test”, both should imply the same emotion
“happiness”, but keyword based approaches might fail to predict the emotion for the first
sen-tence as it lacks emotion keyword in it. Moreover, keywords can be multiple and vague and they can possess different meaning according to its usage and context. Learning based ap-proaches make use of trained model on large annotated datasets. Such models, in general,
use emotion keywords as features. These approaches include traditional machine learning and
deep learning based techniques. One of the main advantages of such techniques is that they
can adapt to domain changes very easily by learning new features from the given training set.
Although learning-based approach can automatically determine the probabilities between
fea-tures and emotions, it still has limitations as it also depends on keywords as feafea-tures to certain
extent. Hybrid approaches consist of a combination of keyword-based implementation and
learning-based implementation. It is relatively more popular than keyword-based approach or
learning-based approach alone as it can achieve higher accuracy from training a combination of classifiers and adding knowledge-rich linguistic information from dictionaries and thesauri
[6][7]. Rule based approaches consist of a predefined set of rules or ontologies for the purpose
of detecting emotion. However, success of this approach can be highly domain dependent and
requirement of rules or ontologies can be expensive.
There are a number of emotion theories available which suggest different sets of basic emotions. Interestingly,joy, sadness, anger, fearandsurpriseare common to all of the models.
To the best of our knowledge, the model suggested by Ekman (1999) [22] is the most broadly
used emotion model. In this study, we use Ekman’s basic emotions together with other sets of
emotions [65][78].
Deep learning models have been very successful in recent years when applied on
4.2. RelatedWork 15
on. But in emotion detection related studies, the datasets that are available are very small. As
a result, we focused on social media because of the fact that it generates huge volume of text
data every moment and the data collection process is also very simple and straight-forward.
The huge number of collected text can be very beneficial for deep learning models. In this thesis, we put our efforts on building such a model which can be effectively used in identifying emotions in interview transcripts.
4.2
Related Work
The advent of micro-blogging sites has paved the way for researchers to collect and analyze
huge volumes of data in recent years. Twitter, being one of the leading social networking sites
worldwide [57], allows its users to express their states of mind via short messages which are
called tweets. Detecting emotion and sentiment from noisy twitter data is really challenging
due to its nature. Tweets tend to be short in length and have a diverse vocabulary making them
harder to analyze due to the limited contextual information they contain. We are interested in tackling these two tasks with a novel use of a single neural network architecture.
In early textual emotion mining and sentiment analysis research, the usefulness of using
external lexicons along with predefined rules has been demonstrated. Aman and Szpakowicz
(2007) [6] introduced a task for annotating sentences with different emotion categories and its intensities. They showed the usefulness of using lexical resources to identify emotion-related
words using two machine learning algorithms - Naive Bayes and Support Vector Machine (SVM). However, lexical coverage of these resources may be limited, given the informal
na-ture of online discourse. A sentence may not have any emotion-bearing word at all. They [7]
also used Roget’s Thesaurus along with WordNet-Affect for fine-grained emotion prediction
from blog data. They utilized two different types of features - corpus based features and fea-tures derived from two emotion lexicons. They have reported superior performance with their
experiments when combining both of the lexicons with corpus-based unigram features on data
collected from blogs. Agrawal and An (2012) [3] proposed a novel unsupervised context-based
approach for detecting emotion from text. Their proposed method computes an emotion vector
for each potential affect-bearing word based on the semantic relatedness between words and various emotion concepts. The results of evaluations show that their technique yields more
accurate results than other recent unsupervised approaches and comparable results to those
of some supervised methods. One of the weaknesses of their approach is that the semantic
relatedness scores depend on the text corpus from which they are derived. Neviarouskaya
16 Chapter4. Multi-channelCNN Model forEmotion andSentimentRecognition
words, etc., in which each entry is labeled with an emotion and its intensity. Bandhakavi et
al. (2017) [9] proposed a unigram mixture model (UMM) to create a domain-specific lexicon
which performs better in extracting features than Point-wise Mutual Information and
super-vised Latent Dirichlet Allocation methods. Thelwall et al. (2010) [90] proposed an algorithm,
SentiStrength, which utilizes a dictionary of sentiment words associated with strength measures to deal with short informal texts from social media. Gilbert and Eric (2014) [27] proposed
VADER, a rule-based model for sentiment analysis. They built a lexicon which is specially
attuned to microblog-like contexts and their model outperforms individual human raters.
More recently, deep learning models have proven to be very successful when applied on various text-related tasks. Kim (2014) [38] showed the effectiveness of a simple CNN model that leverages pre-trained word vectors for a sentence classification task. Kalchbrenner et al.
(2014) [37] proposed a dynamic CNN model which utilizes a dynamic k-max pooling
mech-anism. Their model is able to generate a feature graph which captures a variety of word
re-lations. They showed the efficacy of their model by achieving high performances on binary and multi-class sentiment classification tasks without any feature engineering. dos Santos et
al. (2014) [20] proposed a deep CNN model that utilizes both character and word-level
infor-mation allowing them to achieve state-of-the-art performance on both binary and fine-grained
multi-class sentiment classification for one of the twitter datasets. Tai et al. (2015) [84] pro-posed a Tree-LSTM model which can capture syntactic properties in text. Their model
per-forms particularly well on the sentiment classification task. Wang et al. (2016) [95] proposed a
regional CNN-LSTM model for dimensional sentiment analysis. Their proposed model
com-putes valence-arousal ratings from texts and outperforms several regression-based methods.
Felbo et al. (2017) [24] proposed a bi-directional LSTM model with attention and show that
their model can learn better representations when distant supervision is expanded to a set of
noisy labels. Abdul-Mageed and Ungar (2017) [1] also used distant supervision to build a
large twitter dataset and proposed a Gated Recurrent Neural Network model for fine-grained
emotion detection.
4.3
Proposed Model
We represent the architecture of our model in Fig. 4.1. In this thesis, we discuss a novel use of a
multi-channel Convolutional Neural Network model. A Convolutional Neural Network (CNN)
is a type of artificial neural network used primarily in image recognition and processing, but
in the last few years it has been widely used in natural language processing (NLP) tasks as
well. Due to its huge success in related NLP tasks, we also make use of a CNN model in our
4.3. ProposedModel 17 … K=1 K=2 K=3 K=1 Convolutional layer with multiple window sizes (k=1,2,3)
Convolutional layer with single window size (k=1)
Multichannel Embedding Layer
Tweet Matrix (L1x d)
Hash-Emo Matrix (L2x d) Dropout + Max Pooling
. . . . . . . . . . . .
Affect + Sentiment Features
. Fully-connected layer with softmax Concatenation w1 w2 . . . wn h1 . . . hk e1 . . . ep
Figure 4.1: Overview of the MC-CNN model
layer with different kernel sizes and multiple filters, a dropout layer for regularization, a max pooling layer, multiple hidden layers and a softmax layer. In the following subsections, we describe each of these layers in detail.
4.3.1
Embedding Layer
In this layer, we have two embedding matrices, called the Tweet Matrix and the Hash-Emo
Ma-trix, passed through two different channels of our convolutional neural network. The first ma-trix represents a particular tweet. Each tweetticonsists of a sequence of tokensw1,w2, . . . ,wni.
A full description of what tokens are is given in Section 4.4.2.1. L1 is the maximum tweet
length. The height of the Tweet Matrix isL1. Short tweets are padded using zero padding.
In the Tweet Matrix, every word is represented as a d-dimensional word vector. Since
tweets are usually noisy, short in length, and have different kinds of features other than text, it’s useful to have a word embedding specially trained on a large amount of Tweet data [87].
Pre-vious research [16][80] has shown the usefulness of using pre-trained word vectors to improve
the performance of various models. As a result, in our experiments, we have used the publicly
available pre-trainedGloVe1 word vectors for Twitter by Pennington et al. [63]. GloVeis an
18 Chapter4. Multi-channelCNN Model forEmotion andSentimentRecognition
unsupervised learning algorithm for obtaining vector representations for words, which is called
a word embedding. The word vectors are trained on 27 billion word tokens in an unsupervised
manner. A word embedding such as this is capable of capturing the context of a word in a
sentence, semantic and syntactic similarity, relationships with other words, etc.
In this layer, we also pass another matrix called the Hash-Emo Matrix through a different channel in our network. This matrix is composed of three different sets of features: hashtags, emoticons and emojis. These are considered as distinguishable traits to showcase one’s mood
[102]. People like to use hashtags to express their emotional state through various
micro-blogging sites (e.g., Twitter) [68]. Also graphical emoticons or emojis can convey strong
emo-tion or sentiment. So for each tweetti, we extract hashtagsh1,h2, . . . ,hki and emoticons/emojis e1,e2, . . . ,epi. We concatenate the hashtags and emoticons/emojis vectors for each tweet ti to get the Hash-Emo Matrix. We introduce a hyper-parameter L2 as a threshold on the height of the Hash-Emo Matrix. Tweets with the number of hash-emo features less thanL2 are padded
with zero while tweets with more hash-emo features thanL2 are truncated. We use word
vec-tors fromGloVewith dimensiondfor hashtags words. In the case that no word vector is found
for a particular word we randomly initialize it. We also do random initialization of word
vec-tors for emoticons. For emojis, we first map it to something descriptive (to be discussed in
more detail in Section 4.4.2) and then generate random word vectors. These word vectors are
tuned during the training phase.
4.3.2
Convolutional Layer
In this layer, we apply mfilters of varying window sizes (k) over the Tweet Matrix from the
embedding layer as seen in Fig. 4.1. Here, window size (k) refers to the number of adjacent
word vectors in the Tweet Matrix that are filtered together (when k > 1). Then we slide our
filter down and do the same for the rest of the word vectors. Letwi ∈IRdbe thed-dimensional
word vector corresponding to thei-th word in a tweet. Also letwi:i+jdenote the concatenation of word vectors wi,wi+1, . . . ,wi+j and F ∈ IRk
×d
denote the filter matrix. Thus a feature fi is
generated by:
fi = F⊗wi:i+k−1+b (4.1)
wherebis a bias term and⊗ represents the convolution action (a sum over element-wise
mul-tiplications). At this stage, we apply a nonlinear activation function such asReLU [58] before
passing it through the dropout layer. We use multiple filters with the same window size in order
4.3. ProposedModel 19
For the Hash-Emo Matrix, we apply m filters to each hash-emo vector to generate local
unigram features in different scales before passing it to the next layer.
4.3.3
Pooling Layer
In this layer, we employ a max-over pooling operation [16] on the output from the previous
layer for each channel in order to extract the most salient features. In this way, for each filter,
we get the maximum value. So we get features equal to the number of filters in this stage. We
chose max pooling instead of other pooling schemes because [101] showed that max pooling
consistently performs better than other pooling strategies for various sentence classification tasks.
4.3.4
Hidden Layers
We concatenate all the feature vectors from the previous layer. In addition, we concatenate
additional sentiment and affect feature vectors (which are described in detail in Section 4.4.2) as well which forms a large feature vector. This is then passed through a number of hidden
layers. A non-linear activation function (i.e., ReLU [58]) is applied in each layer before the
vector is finally passed through the output layer. We tried a different activation function (tanh) as well, but ReLU worked the best for us.
4.3.5
Output Layer
This is a fully connected layer which maps the inputs to a number of outputs corresponding
to the number of classes we have. For multi-class classification task, we use softmax as the
activation function and categorical cross-entropy as the loss function. The output of the softmax
function is equivalent to a categorical probability distribution which generally indicates the
probability that any of the classes are true. Mathematically, the softmax function is shown
below:
P(y= j|z)= e zTw
j
PK
k=1ez Tw
k
(4.2)
wherezis a vector of the inputs to the output layer andKrepresents the number of classes. For
binary classification task, we use sigmoid as the activation function and binary cross-entropy
as our loss function. Finally, the classification result can be obtained by:
ˆ
y=arg max j
20 Chapter4. Multi-channelCNN Model forEmotion andSentimentRecognition
Emotion Dataset
BTD TEC CBET SE
joy 409,983 8,240 10,691 3,011
sadness 351,963 3,830 8,623 2,905
anger 311,851 1,555 9,023 3,091
love 175,077 − 9,398 −
thankfulness 80,291 − 8,544 −
fear 76,580 2,816 9,021 3,627
surprise 14,141 3,849 8,552 −
guilt − − 8,540 −
disgust − 761 8,545 −
Total 1,419,886 21,051 80,937 12,634
Table 4.1: Basic statistics of the emotion datasets.
Dataset #Tweets #Positive #Negative #Neutral
STS-Gold 2,034 632 1,402 −
STS-Test 498 182 177 139
SS-Twitter 4,242 1,252 1,037 1,953
Table 4.2: Basic statistics of the sentiment datasets.
4.4
Experiments
In this section, we describe in detail the datasets and experimental procedures used in our study.
4.4.1
Datasets
We used a number of emotion and sentiment datasets for our experiments. A description of
each dataset is given below:
BTD. Big Twitter Data is an emotion-labeled Twitter dataset provided by Wang et al.
(2012) [96]. The dataset had been automatically annotated based on the seven emotion
cate-gory seed words [78] being a hashtag and the quality of the data was verified by two annotators
as described in [96]. We were only able to retrieve a portion of the original dataset as many tweets were either removed or not available at the time we fetched the data using the Twitter
API. We applied the heuristics from [96] to remove any hashtags from the tweets which belong
to the list of emotion seed words.
TEC. Twitter Emotion Corpus has been published by Saif (2012) [51] for research
pur-poses. About 21,000 tweets were collected based on hashtags corresponding to Ekman’s [22]
4.4. Experiments 21
CBET. The Cleaned Balanced Emotional Tweet dataset is provided by Shahraki et al.
(2017) [77]. To the best of our knowledge, this is one of the largest publically available
bal-anced datasets for twitter emotion detection research. The dataset contains 80,937 tweets with
nine emotion categories including Ekman’s six basic emotions.
SE. The SemEval-2018 Task 1 - Affect dataset was provided by Mohammad et al. (2018) [50]. The SemEval task was to estimate the intensity of a given tweet and its corresponding
emotion. However, in this study, we utilize the labeled dataset only to classify the tweets into
four emotion categories. We have used the training, development and test sets provided in this
dataset in our experiments.
STS-Gold. This dataset was constructed by Saif et al. (2013) [73] for Twitter
senti-ment analysis. The dataset contains a total of 2,034 tweets labeled (positive/negative) by three annotators. This dataset has been extensively used in several works for model
evalua-tion [40][74][75].
STS. The Stanford Twitter Sentiment dataset was introduced by Go et al. (2009) [28]. It
consists of a training set and a test set. The training set contains around 1.6 million tweets,
whereas the test set contains 498 tweets. The training set was built automatically based on
several emoticons as potential identifiers of sentiment. However, the test set was manually
annotated and heavily used for model evaluation in related research [34, 20, 28]. We
per-form two experiments on the dataset. One with all three labels (positive/negative/neutral) to compare the performance of different variants of our model and the other one with two labels (positive/negative) to make comparison with related works [34][20][28].
SS-Twitter. The Sentiment Strength Twitter dataset has been constructed by Thelwall et al.
(2012) [89] to evaluate SentiStrength. The tweets were manually labeled by multiple persons.
Each tweet is assigned a number between 1 and 5 for both positive and negative sentiments.
Here, 1 represents weak sentiment strength and 5 represents strong sentiment strength. We
followed the heuristics used by [73] to obtain a single sentiment label for each tweet, giving us a total of 4,242 positive, negative and neutral tweets. The transformed dataset has been used in existing literature [73][100][28].
We provide basic statistics of the emotion labeled and sentiment labeled datasets used in
our experiments in Table 4.1 and Table 4.2.
4.4.2
Experimental Setup
4.4.2.1 Data Cleaning
22 Chapter4. Multi-channelCNN Model forEmotion andSentimentRecognition
Twitter, TweetTokenizer, which preserves user mentions, hashtags, urls, emoticons and emojis
in particular. Tokenization is the process of splitting a sequence of strings into elements such
as words, keywords, punctuation marks, symbols and other elements called tokens.
TweetTo-kenizer also reduces the length of repeated characters to three (i.e. “Haaaaaapy” will become “Haaapy”). In our experiments with Twitter data, we utilized the TweetTokenizer to tokenize
tweets.
To accommodate the pretrained word vectors from [64], we pre-processed each tweet in a
number of ways. We lowercased all the letters in the tweet. User mentions have been replaced with<user>token (i.e. @username1 will become<user>). In addition, we also removed urls from the tweets as urls do not provide any emotional value. We also normalized certain negative
words (e.g., “won’t” will become “will not”). Using slang words is a very common practice
in social media. We compiled a list of the most common slang words2 and replaced all of the
occurrences with their full form (e.g., “nvm” will become “never mind”). Usage of certain
punctuation is often crucial in social media posts as it helps the user to emphasize certain
things. We found that two punctuation symbols (! and ?) are common among social media
users to express certain emotional states. We kept these symbols in our text and normalized the
repetitions (e.g., “!!!” will become “! <repeat>”)
The use of emojis and emoticons has increased significantly with the advent of various
social media sites. Emoticons (e.g., :-D) are essentially a combination of punctuation marks,
letters and numbers used to create pictorial icons which generally display an emotion or
sen-timent. On the other hand, emojis are pictographs of faces, objects and symbols. The primary purpose of using emojis and emoticons is to convey certain emotions and sentiments [21].
One advantage of using the TweetTokenizer is that it gives us emoticons and emojis as tokens.
Though we use the emoticons as is in our experiment, we utilize a python library called “emoji”
to get descriptive details about the pictorial image.
In our experiments, we removed stop-words from the tweets and replaced numbers
occur-ring in the tweets with the token <number>. We also stripped off “#” symbols from all the hashtags within the tweets (e.g., “#depressed” will become “depressed”). We only kept tokens
with more than one character.
4.4.2.2 Input Features
Along with word embeddings, we used additional affect and sentiment features in our network. In our experiments, we used a feature vectorVf where each value in the vector corresponds to a particular lexical feature ranging between [0,1]. We utilized a number of publicly available
4.4. Experiments 23
lexicons which are described briefly below to construct the vector.
Warriner et al. (2013) [97] provides a lexicon consisting of 14 thousand English lemmas
with valence, arousal and dominance scores. Three components of emotion are scored for each
word between 1 and 9 in this lexicon. We calculate the average score for each component
across all tokens in a tweet and normalize them in the range [0, 1]. Gibert (2014) [27] provides
a list of lexical features along with their associated sentiment intensity measures. We utilize
this lexicon to calculate the average of positive, negative, and neutral scores over all the tokens
in a tweet.
In addition, we used theNRC Emotion Lexiconprovided by Mohammad and Turney (2013)
[53] which consists of a list of unigrams and their association with one of the emotion
cate-gories (anger, anticipation, disgust, fear, joy, sadness, surprise, trust). We use the percentage of
tokens belonging to each emotion category as features. We also used theNRC Affect Intensity
Lexicon provided by Mohammad and Bravo-Marquez (2017) [49] and NRC Hashtag
Emo-tion Lexicon provided by Mohammad and Kiritchenko (2015) [52] which contain real-valued
fine-grained word-emotion association scores for words and hashtag words respectively.
We combined two lexiconsMPQAandBingLiuprovided by Wilson et al. (2005) [98] and
Hu and Liu (2004) [33], respectively, and used them to calculate the percentage of positive and
negative tokens belonging to each tweet.
We also used AFINN [60] which contains a list of English words rated for valence with
an integer between−5 (negative) to +5 (positive). We first normalized the scores in the range [0,1] and then calculated the average of this score over all the tokens in a tweet. Lastly, we
detect the presence of consecutive exclamation (!) and question marks (?) in a tweet and use
them as boolean features.
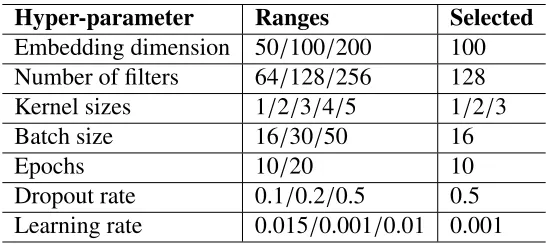
Hyper-parameter Ranges Selected
Embedding dimension 50/100/200 100
Number of filters 64/128/256 128
Kernel sizes 1/2/3/4/5 1/2/3
Batch size 16/30/50 16
Epochs 10/20 10
Dropout rate 0.1/0.2/0.5 0.5
Learning rate 0.015/0.001/0.01 0.001
24 Chapter4. Multi-channelCNN Model forEmotion andSentimentRecognition
4.4.2.3 Network Parameters and Training
Zhang and Wallace (2017) [101] performed a sensitivity analysis on various parameters of a
one-layer CNN model and showed how tuning the parameters can affect the performance of a model. Inspired by the work done by [101], we also searched for the optimal parameter configurations in our network. Table 4.3 shows different hyper-parameter configurations that we tried and the final configuration that was used in our model. The final configuration was
based on both performance and training time. The embedding dimension has been set to 100
for both of the channels of our network as it worked best for us among other dimensions.
We also experimented with a different number of filters and varying kernel sizes during our experiments. The combination of kernel sizes, (k = 1,2,3) in the first channel and k = 1 in the second channel worked the best for us. We also experimented with various batch sizes
and the performance of the model remained reasonably constant, though the training time
varied significantly. We used the Adam optimizer [39] and the back-propagation [71] algorithm
for training our model. Keras 2.2.0 was used for implementing our model under the Linux environment.
4.4.2.4 Regularization
In order to reduce overfitting, it is a common practice to employ regularization strategies in
CNNs. In our experiments, we used dropout regularization [81] for both of the channels after
the convolutional layer as seen in Fig 4.1. We experimented with three different dropout rates as seen in Table 4.3 and also with no dropout at all. The model works better when we apply
dropouts after the convolutional layer.
4.5
Performance
In this section, we describe the results obtained through our experimentation. We use precision,
recall, F1-score and accuracy as our evaluation metrics. These metrics are defined as:
precision= tp
tp+fp (4.4)
recall= tp
tp+fn (4.5)
F1-score= 2∗precision∗recall
4.5. Performance 25
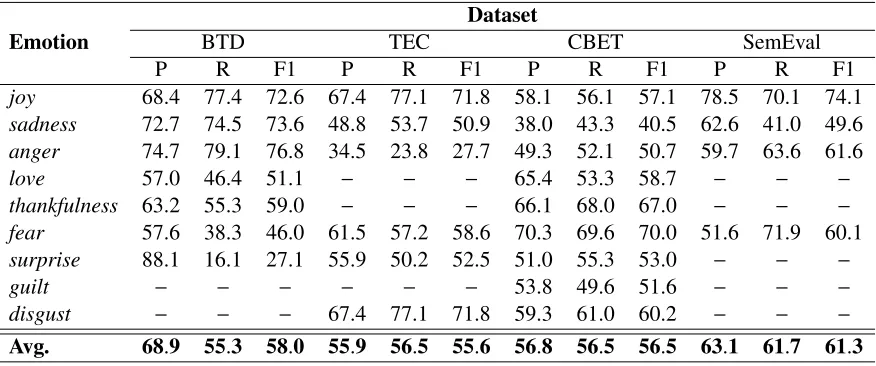
Emotion
Dataset
BTD TEC CBET SemEval
P R F1 P R F1 P R F1 P R F1
joy 68.4 77.4 72.6 67.4 77.1 71.8 58.1 56.1 57.1 78.5 70.1 74.1 sadness 72.7 74.5 73.6 48.8 53.7 50.9 38.0 43.3 40.5 62.6 41.0 49.6 anger 74.7 79.1 76.8 34.5 23.8 27.7 49.3 52.1 50.7 59.7 63.6 61.6 love 57.0 46.4 51.1 − − − 65.4 53.3 58.7 − − − thankfulness 63.2 55.3 59.0 − − − 66.1 68.0 67.0 − − − fear 57.6 38.3 46.0 61.5 57.2 58.6 70.3 69.6 70.0 51.6 71.9 60.1 surprise 88.1 16.1 27.1 55.9 50.2 52.5 51.0 55.3 53.0 − − −
guilt − − − − − − 53.8 49.6 51.6 − − −
disgust − − − 67.4 77.1 71.8 59.3 61.0 60.2 − − −
Avg. 68.9 55.3 58.0 55.9 56.5 55.6 56.8 56.5 56.5 63.1 61.7 61.3
Table 4.4: Results (in %) of our model (MC-CNN) for four emotion-labeled datasets.
Accuracy= tp+tn
tp+tn+fp+fn (4.7)
Here, tp represents true positive, fp represents false positive, tn represents true negative and
fn represents false negative. We evaluated our model on four emotion labeled datasets. Table
4.4 shows the results for each emotion category for all of the datasets. For the BTD dataset, we trained our model with 1,136,305 tweets, while we used 140,979 and 142,602 tweets as development and test data respectively. We used the same training, development and test sets
as [96] except that our retrieved dataset contains fewer samples. We achieved relatively high
F1-scores of 72.6%,73.6%and76.8%for joy, sadnessandanger, respectively, whereas for
surprise we get a low F1-score of27.1%. This is probably due to the imbalanced nature of
the dataset as can be seen in Table 4.1. The number of samples for joy, sadness and anger
is much higher than for surprise. Our model achieves an accuracy of 69.2%, whereas Wang
et al. (2012) [96] reported an accuracy of 65.6%when trained on a much larger dataset. We
can not make direct comparison with [96] since we were not able to retrieve the full test set due to the unavailability of some tweets at the time of fetching data from Twitter. For the
TEC dataset, we evaluated our model with 10-fold cross validation. Mohammad (2012) [51]
reported an F1-score of49.9%with SVM, whereas our model achieves an F1-score of55.6%.
For the CBET dataset, we used 80% of the data as the training set and the remaining 20% as
the test set. We get an average F1-score of56.5%. We also used 10-fold cross-validation for
the SemEval dataset and achieved an F1-score of61.3%.
26 Chapter4. Multi-channelCNN Model forEmotion andSentimentRecognition
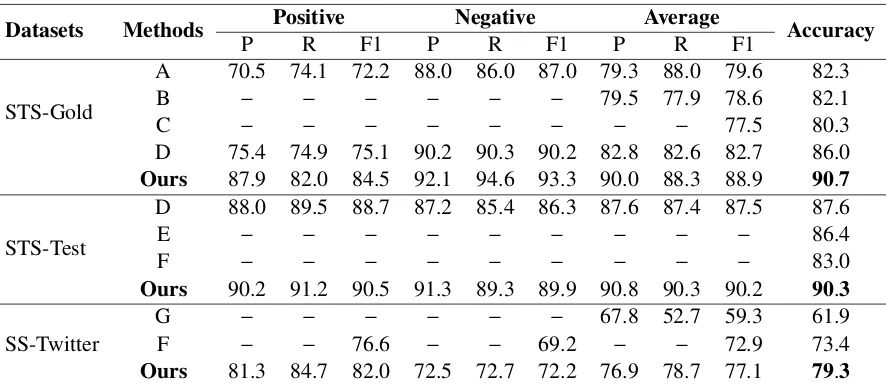
Datasets Methods Positive Negative Average Accuracy
P R F1 P R F1 P R F1
STS-Gold
A 70.5 74.1 72.2 88.0 86.0 87.0 79.3 88.0 79.6 82.3
B − − − − − − 79.5 77.9 78.6 82.1
C − − − − − − − − 77.5 80.3
D 75.4 74.9 75.1 90.2 90.3 90.2 82.8 82.6 82.7 86.0
Ours 87.9 82.0 84.5 92.1 94.6 93.3 90.0 88.3 88.9 90.7
STS-Test
D 88.0 89.5 88.7 87.2 85.4 86.3 87.6 87.4 87.5 87.6
E − − − − − − − − − 86.4
F − − − − − − − − − 83.0
Ours 90.2 91.2 90.5 91.3 89.3 89.9 90.8 90.3 90.2 90.3
SS-Twitter
G − − − − − − 67.8 52.7 59.3 61.9
F − − 76.6 − − 69.2 − − 72.9 73.4
Ours 81.3 84.7 82.0 72.5 72.7 72.2 76.9 78.7 77.1 79.3
Table 4.5: Results (in %) of our model (MC-CNN) from 10-fold cross-validation compared against other methods for sentiment labeled datasets (2-class). Bold text indicates the best per-formance in a column. A: Thelwall-Lexicon (Updated + Expanded) [75]. B: SentiStrength [40]. C:SentiCircle with Pivot [74]. D:Deep Convolutional Neural Network [34]. E: Char-acter to Sentence Convolutional Neural Network (CharSCNN) [20]. F: Maximum Entropy [73]. G: Globally Convergence based Quantum Language Model + Quantum Relative En-tropy [100].
model achieves an accuracy of 90.7% whereas the previous best accuracy (86.0%) was
re-ported by Jianqiang et al. (2018) [34] with a deep CNN model. Our model achieves the best accuracy (90.3%) for the STS-Test dataset as well, while the previous best (87.6%) was reported in [34]. Dos Santos et al. (2014) [20] also experimented with the same dataset with
their Character to Sentence CNN model (CharSCNN) and they reported an accuracy of86.4%.
Lastly, for the SS-Twitter dataset, our model achieves an accuracy of 79.3% whereas Zhang
et al. (2018) [100] and Saif et al. (2013) [73] reported an accuracy of 61.9% and 73.4%,
respectively.
Tables 4.6, 4.7 and 4.8 show the performance of three variants of our model on the emotion
labeled datasets with all available emotion categories for each of the emotion datasets and
the sentiment labeled datasets with all the available sentiment labels for each of the sentiment datasets. The first variant is a basic CNN model without hash-emo embedding or any additional
features. The second variant includes the hash-emo embedding, while the last variant combines
additional lexical features as well. It can be observed that when we introduce the second
channel with hash-emo embedding, we get a significant increase in accuracy for most of the
datasets. We can see in Table 4.6 that, for STS-Test and SS-Twitter datasets, we get better
4.5. Performance 27
Datasets Methods Positive Negative Neutral
P R F1 P R F1 P R F1
STS-Test
CNN 73.6 84.1 76.8 73.5 74.2 72.8 74.2 64.3 65.8 MC-CNN† 63.1 83.4 70.3 76.5 70.4 72.8 71.6 53.9 60.8 MC-CNN†‡ 80.3 83.8 81.4 87.5 81.2 83.5 79.2 77.9 77.7
SS-Twitter
CNN 48.9 51.7 49.3 43.9 53.7 47.4 67.8 66.8 64.3 MC-CNN† 61.6 62.0 61.4 55.3 65.5 59.7 71.6 62.7 66.4 MC-CNN†‡ 65.1 65.4 64.0 56.2 65.7 60.0 72.2 62.7 66.7
Table 4.6: Results (in %) of three variants of our model from 10-fold cross-validation for sentiment labeled datasets (3-class). Bold text indicates the best performance in a column.† represents the inclusion of Hash-Emo embedding into the network. ‡represents the inclusion of external features into the network.
Models Dataset
BTD TEC CBET SE
CNN 66.1 54.3 53.8 56.3
MC-CNN† 68.5 57.6 56.1 59.8
MC-CNN†‡ 69.2 58.9 56.4 62.0
Table 4.7: Comparison of results (accuracy in %) of three variants of our model. †represents the inclusion of Hash-Emo embedding into the network. ‡represents the inclusion of external features into the network.
external lexical features. In Table 4.8, for SS-Twitter, we get a4.1percentage point increase in accuracy over the base model. Also for STS-Gold, we get a2.3percentage point increase.
When we include the hash-emo embedding along with additional features in the network, we
get an increase of 4.5,6.4and5.5percentage points for STS-Gold, STS-Test and SS-Twitter,
respectively, over the base model. In the case of the emotion labeled datasets in Table 4.7,
inclusion of hash-emo embedding in the network gives us2.4,3.3,2.3and3.5percentage points
increase in accuracy and the inclusion of additional features as well gives us 3.1,4.6,2.6and 5.7percentage points increase in accuracy for BTD, TEC, CBET and SE datasets, respectively, over the base models.
Table 4.9 and Table 4.10 show the cross-corpus results on the emotion and sentiment
la-beled datasets used in our experiments. We trained our model with one dataset and evaluated its performance on the other datasets. For cross-corpus evaluation on the emotion labeled datasets,
we only consider four basic emotionsanger, fear, joy andsadness, as these four are common
to all of them. (It should be noted that in tension situation negative emotions such as anger,
28 Chapter4. Multi-channelCNN Model forEmotion andSentimentRecognition
Models Dataset
STS-Gold STS-Test SS-Twitter
CNN 86.2 75.1 59.1
MC-CNN† 88.5 70.6 63.2
MC-CNN†‡ 90.7 81.5 64.6
Table 4.8: Comparison of results (accuracy in %) of three variants of our model. †represents the inclusion of Hash-Emo embedding into the network. ‡represents the inclusion of external features into the network.
BTD TEC CBET SE
BTD − 42.4 46.7 48.9
TEC 53.2 − 44.2 36.4
CBET 63.2 42.8 − 41.2
SE 68.8 40.1 43.3 −
Table 4.9: Cross-corpus results (Accuracy in %). Rows correspond to the training corpora and columns to the testing.
results when trained on CBET and SE datasets. In Table 4.10, we can observe that, STS-Gold and STS-Test perform comparatively better than the SS-Twitter dataset. Our model achieves
an accuracy of81.1%and78.4%on the STS-Test and SS-Twitter datasets, respectively, when
trained on the STS-Gold dataset which has two sentiment classes (positive/negative). Though the STS-Test dataset has relatively fewer positive and negative samples, our model still
gener-alizes well when trained on this dataset. As discussed earlier, this is probably due to the fact
that both STS-Gold and STS-Test were labeled with positive-negative sentiment in
compari-son with the SS-Twitter dataset which was originally labeled with numerical numbers for the
sentiment.
It should be noted that our interview datasets do not have hashtags, emoticons or emojis
which are found in Twitter data. Hence, during training a model with Twitter data for detecting
emotion in our interview transcripts, we only use the first channel in our proposed model for
emotion recognition along with the external feature vector.
STS-Gold STS-Test SS-Twitter
STS-Gold − 81.1 78.4
STS-Test 76.9 − 72.6
SS-Twitter 31.1 50.7 −