Scholarship@Western
Scholarship@Western
Electronic Thesis and Dissertation Repository
8-27-2018 1:00 PM
The Role of Familiarity in Rhythmic Timing and Beat Perception
The Role of Familiarity in Rhythmic Timing and Beat Perception
Joshua Hoddinott
The University of Western Ontario
Supervisor Grahn, Jessica A.
The University of Western Ontario
Graduate Program in Neuroscience
A thesis submitted in partial fulfillment of the requirements for the degree in Master of Science © Joshua Hoddinott 2018
Follow this and additional works at: https://ir.lib.uwo.ca/etd
Part of the Cognition and Perception Commons
Recommended Citation Recommended Citation
Hoddinott, Joshua, "The Role of Familiarity in Rhythmic Timing and Beat Perception" (2018). Electronic Thesis and Dissertation Repository. 5669.
https://ir.lib.uwo.ca/etd/5669
This Dissertation/Thesis is brought to you for free and open access by Scholarship@Western. It has been accepted for inclusion in Electronic Thesis and Dissertation Repository by an authorized administrator of
i
Behavioural and neural differences associated with strong and weak-beat rhythms may
indicate that strong-beat rhythms are more familiar stimuli than weak-beat rhythms, or
differences may be because intervals in strong-beat rhythms are more easily encoded relative
to a beat. To test these different possibilities, participants were trained to reproduce strong-,
weak-, and non-beat rhythms over 4 days, in an attempt to equate familiarity across the
different categories of rhythms. On a fifth day, participants were tested on their ability to
reproduce these same rhythms at learned, slower, and faster rates, as well as novel rhythms.
Participants improved performance on all rhythms across the 4 training sessions, but were
still more accurate for strong-beat than weak- or non-beat rhythms after training. Accuracy
for rescaled (slower and faster) versions of the rhythms was not different from accuracy for
learned rates, and all trained rhythms, regardless of rate, were reproduced more accurately
than novel rhythms. Though the results are not conclusive about the two proposed
explanations for behavioural and neural differences between strong and weak-beat rhythms,
findings indicate that possibly both familiarity and beat strength play roles in improving
ii
Keywords
iii
Acknowledgments
First, I would like to thank Dr. Jessica Grahn for her unwavering guidance from the
beginning to the end of this journey. It goes without say (but it shall be said) that this project
would not have been successful without Dr. Grahn’s involvement. The dedication to her
students, including myself goes far beyond what is required to succeed in this type of work.
Thank you for creating a culture that not only facilitates high-quality work, but also builds a
strongly cohesive group of students.
My colleagues, the members of the Music and Neuroscience Lab, have been nothing other
than a friendly, welcoming, and supportive group. I truly thank each of you for your
contributions to this project, and to my own growth both personally and vocationally. A
special thank you is required to Aaron Gibbings, for his intricately executed efforts in
instilling an enthusiasm and motivation for good science, while also keeping me in line. It is
hard to say where we would all be if not for his well-balanced efforts. I would also like to
specifically thank the research assistants who helped with this project. Your efforts
throughout data collection certainly did not go unnoticed.
I must also thank my friends and family for their unending support throughout these past 2
years. You have all remained incredibly vigilant and dedicated to my wellbeing, despite the
bouts of radio silence on my end. Thank you for keeping me grounded (I mean mentally,
Mom). Finally, I’d like to especially thank Chantal Rochon for really carrying this burden
with me, through the ups and downs, your contribution really cannot be expressed enough.
iv
Table of Contents
Abstract ... i
Acknowledgments... iii
Table of Contents ... iv
List of Tables ... vi
List of Figures ... vii
List of Appendices ... viii
Chapter 1 ... 1
1 Introduction ... 1
1.1 Beat Perception ... 1
1.2 Behavioral and Neural Correlates of Beat Perception ... 3
1.3 Role of the Basal Ganglia and SMA in Beat Perception ... 4
1.4 Current Experiment ... 6
Chapter 2 ... 9
2 Method ... 9
2.1 Participants ... 9
2.2 Stimuli ... 9
2.3 Procedure ... 12
2.3.1 Beat Alignment Test (BAT)... 14
2.3.2 Preferred Tempo ... 14
2.3.3 Rhythm Reproduction (Training) ... 14
2.3.4 Rhythm Synchronization (Training) ... 15
2.3.5 Rescaling Reproduction (Test) ... 16
Chapter 3 ... 18
v
3.1 Analysis... 18
3.2 Rhythm Reproduction (Training) ... 18
3.3 Rescaling Reproduction (Test) ... 20
3.3.1 Proportional Error ... 20
3.3.2 Ratio Analysis ... 23
3.3.3 Correlation with Training Performance ... 28
Chapter 4 ... 30
4 Discussion ... 30
4.1 Current Findings ... 31
4.2 Encoding Rhythms Relative to Beat Strength ... 33
4.3 The Role of Familiarity ... 34
4.4 A Dual Role of Familiarity and Regularity ... 35
4.5 Limitations ... 37
4.6 Future Directions ... 39
4.7 Conclusion ... 40
References ... 42
vi
List of Tables
Table 1: Rhythmic Stimuli ... 12
vii
List of Figures
Figure 1. Example of Rhythmic Conditions ... 3
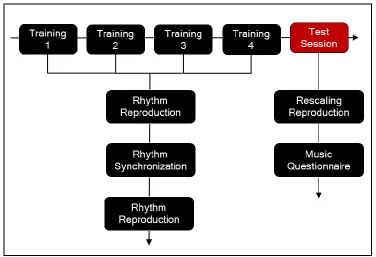
Figure 2: Procedure Flow Chart ... 13
Figure 3. Average Proportional Error across 8 Training Blocks ... 20
Figure 4. Average Proportional Error during Rescaling Reproduction Test Session ... 21
Figure 5. Average Proportional Error for Reproduced Ratios ... 25
viii
List of Appendices
Appendix A: Proportion of Trials Excluded from Analysis. ... 46
Appendix B: Extra Rescaling Data...47
Chapter 1
1
Introduction
The ability to time movements with external cues is essential for interacting with the
environment. Movement timing dictates performance in simple tasks, such as catching a
ball, and in complex movements, like dancing to music. The accuracy of timed
movements is influenced by relevant stimulus features, such as its regularity or
predictability. One unique feature of music that improves timing performance is the
feeling of a steady pulse or “beat” that unfolds over time. The influence of the beat on
movement timing is evident in humans, who tend to spontaneously synchronize with the
beat, such as with clapping or foot tapping.
1.1
Beat Perception
Though melody, harmony, and lyrics can all contribute to perceiving the beat in music,
timing information alone can induce beat perception (Grahn & Brett, 2007). This can be
demonstrated by beat perception occurring in rhythm even when all musical parameters
of the tones are identical, apart from the duration that separates their onsets (inter-onset
interval) (Grahn & Brett, 2007). Varying interval duration is thought to influence beat
perception through a process called perceptual accenting (Povel & Okkerman, 1981).
Perceptual accents are perceived increases in stimulus salience in the absence of any true
differences between the stimuli. For example, the second sound in a pair of sounds is
generally perceived as more salient (e.g., louder) than the first, even when no acoustic
differences are present (Povel & Okkerman, 1981). When the inter-onset intervals in a
points in time (e.g. every 500ms), a strong beat percept is induced (Bouwer et al., 2018).
The beat percept can be weakened by rearranging the same inter-onset intervals that
make up a strong-beat rhythm so that the perceptual accents are no longer evenly spaced
(Figure 1). In addition to perceptual accents, inducing beat perception may require
sequences of integer-ratio intervals, in which the durations of the intervals are related by
a common base unit duration (e.g., 2:1, 2:3) (Grahn & Brett, 2007). Integer-ratio intervals
are typical in music, where rhythm conforms to a hierarchical metric structure so that the
timing between notes is related as a fraction of a whole measure (e.g., 1/4 notes or 1/8
notes). Thus, rhythms with intervals that are not integer-ratio related (e.g., 1.4:1 or 3.6:1),
which therefore cannot be notated in music, generally do not induce beat perception
(Grahn & Brett, 2007). In sum, manipulating the temporal characteristics of rhythmic
sequences, whether by spacing perceptual accents or altering interval relationships,
allows for rhythms to be created that have a strong beat, a weak beat, or no beat. In beat
perception research, strong-beat rhythms are directly compared to weak- and non-beat
rhythms to study effects of beat strength without any other acoustic differences
Figure 1. Example of Rhythmic Conditions (adapted from Grahn & Brett, 2007).
Black vertical lines represent acoustic tones, red dashed lines indicate beat locations
according to perceptual accents. Numbers indicate interval durations as ratio
relationships.
1.2
Behavioral and Neural Correlates of Beat Perception
There are specific neural correlates associated with rhythm and beat perception. Studies
using functional magnetic resonance imaging (fMRI) report activity in the ventrolateral
prefrontal cortex, cerebellum, supplementary motor area and basal ganglia while listening
to rhythmic sequences (Chen, Penhune, & Zatorre, 2008). In a study investigating neural
correlates of beat perception specifically, subjects were asked to discriminate between
rhythms that had either strong, weak, or no beat presence (Grahn & Brett, 2007).
Rhythms with a strong beat were associated with greater activity in the basal ganglia and
supplementary motor area (SMA), compared to weak- and non-beat rhythms. Functional
connectivity analysis has also shown correlated activity between these two regions, which
may suggest the role of a striatal-cortical loop during beat perception (Grahn & Rowe,
perception, and the necessity of the basal ganglia’s contribution to beat perception is
confirmed by the deficits in patients with compromised basal ganglia functioning.
Specifically, Parkinson’s disease patients do not show the same performance
improvement on a rhythm discrimination task for strong-beat rhythms as do healthy
controls (Grahn & Brett, 2009). Therefore, without proper basal ganglia functioning, the
advantages of beat presence are reduced, suggesting that the basal ganglia play a
necessary functional role in beat perception. So far, beat perception research has not been
conclusive about the specific functions of the basal ganglia and SMA in beat perception.
1.3
Role of the Basal Ganglia and SMA in Beat Perception
Though the areas associated with beat perception are more traditionally viewed as motor
areas, they are also implicated in timing and time perception functions. The
supplementary motor area is often reported for various timing and time perception tasks
(Schwartze, Rothermich, & Kotz, 2012). Some suggest that the SMA responds to
sequential stimuli, such as motor sequences and number sequences (Cona & Semenza,
2017), and as rhythms are essentially sequences of time intervals, the SMA’s role may be
in processing the sequential aspect of the stimuli. However, the SMA is also cited for
time discrimination tasks and the perception of subsecond (durations under 1000 ms)
intervals, even outside of a sequential context (Schwartze, et al., 2012), suggesting a
particular role in interval processing.
Though structures in the basal ganglia have been implicated in perceptual and timing
functions (Kotz, Schwartze, & Shmidt-Kassow, 2009), the specific function of the basal
ganglia in beat perception is less clear. One explanation is that the basal ganglia are
detection of the regular beat structure. This is supported by evidence showing that
relative timing tasks, which require internalizing a unit of time, are correlated with basal
ganglia and cortical activity, whereas absolute timing, in which internalizing a common
temporal unit is not useful, is related to activity in other brain areas (Teki et al., 2011).
Furthermore, in a study comparing neural activity during finding a new beat versus
continuing an already perceived beat, the basal ganglia were most active when continuing
the beat, in which internal generation of the beat is greatest (Grahn & Rowe, 2012). In
addition to generating a beat, the beat continuation task required prediction of the beat
interval. Therefore, the function of the basal ganglia during beat perception may be in the
prediction of upcoming interval onsets relative to the perceived beat. As mentioned
previously, a strong beat can provide structure to a rhythm, thus making events that occur
in time with the beat predictable (whether occurring “on” the beat, or at a time interval
related to the beat) (Grahn & Rowe, 2012). Thus, the regularity of strong-beat rhythms
allows prediction of interval onsets, which may account for the increased basal ganglia
activity compared to weak- and non-beat rhythms.
An alternative explanation for the neural findings in beat perception suggests that
familiarity-based, rather than regularity-based, predictability of strong-beat rhythms is
responsible. As the daily human environment often includes music, strong-beat rhythms
may be more familiar to human listeners, and therefore more predictable because of that
familiarity, than non-beat rhythms. This explanation is consistent with findings
implicating the basal ganglia in prediction without temporal regularity, such as reward
prediction (Haruno & Kawato, 2005), and movement prediction (Schiffer & Schubotz,
encompasses a temporal predictability that does not require internal beat generation
(Kotz, Schwartze, & Shmidt-Kassow, 2009).
Familiarity-based predictability may explain improved memory and timing for
strong-beat rhythms. People better detect small changes in interval timing for rhythmic patterns
that are common to the individual’s culture, compared to patterns from other cultures,
with which they would have less long-term exposure (Hannon, Soley, & Ullal, 2012).
Even with short-term exposure (i.e. the length of an experimental session), repeated
listening to rhythms elicits faster reaction times for correct responses to rhythm
discrimination tasks (Tillmann, Stevens, & Keller, 2011). Short-term exposure also
improves reproduction accuracy (Tillmann, et al., 2011). For example, during a repeated
serial reaction time task, participants implicitly learned the timing of one 3-interval
sequence, either the pattern 2:2:3 or 2:2:4. After exposure, synchronization and
reproduction accuracy for the 2:2:3 sequence was measured. Both groups had less
tapping variability than a no-exposure group, and the 2:2:3-exposed group had less
variability only for the 3 interval, compared to the 2:2:4-exposed group (Tillmann et al.,
2011). Thus, stimulus familiarity may benefit motor timing performance, even in a
short-term implicit learning design. These findings suggest that previous beat perception
research may be confounded by using stimuli that differ in how familiar they are.
1.4
Current Experiment
To date, no studies have directly examined the role of familiarity-based predictability in
rhythm perception for strong-beat and non-beat rhythms. To address this gap in literature,
the current study examined the role of familiarity-based and regularity-based
familiarity of rhythms regardless of beat strength. We then probed whether weak- or
non-beat rhythms were encoded similarly to strong-non-beat rhythms once they were equally
familiar. One way that encoding representations have been probed in timing research is
by measuring rescaling accuracy, or how well timing accuracy on an initially-learned
sequence transfers to faster or slower rates. For example, Collier & Wright (1995) used a
rescaling paradigm to highlight differences in encoding integer-related and
non-integer-related intervals (Collier & Wright, 1995). Participants were trained to reproduce interval
pairs that were either related by simple integer ratios (e.g. 2:1), such as the intervals
occurring in strong-beat rhythms, or complex non-integer ratios (e.g. 2.72:1), which do
not induce beat perception. Though participants improved performance during acquisition
trials for both interval types, when asked to rescale the intervals by reproducing them in
double the total duration, temporal accuracy remained only for integer-ratio intervals.
Collier & Wright (1995) concluded that this distinction in rescaling ability reveals
different timing mechanisms used for simple and complex intervals. In the
aforementioned study by Tillmann et al. (2011), differences between exposure groups
(2:2:3-exposed versus 2:2:4-exposed groups) in reproduction performance were only
found when tested on faster-than-learned reproduction rates. That is, both groups
performed the test stimulus at similar accuracy when presented at the learned rate, but
only the group most familiarized with the test sequence transferred reproduction accuracy
to a fast-rate version of the sequence. Rescaling was thus used to indicate whether
participants were learning the absolute durations of intervals, or if they encoded the
relationships between intervals, which would allow the performance accuracy to be
Rescaling ability has not been tested in longer musical rhythms. However, musicians are
known to play pieces at faster or slower rates without losing rhythmic precision,
suggesting that rescaling is possible for rhythms with a beat. It is not clear, though,
whether this ability is mediated by the beat, or if familiarity with the music alone allows
musicians to perform such a manipulation.
In the current experiment, participants were trained to reproduce 12 unique stimuli with
strong, weak, and no beat strength. In a final session, participants’ reproduction accuracy
was measured for the 12 trained rhythms, as well as for faster and slower versions of
those same rhythms, and for 12 novel rhythms, matched for beat strength. If rhythms are
encoded differentially dependent on beat presence, then rescaled weak- and non-beat
rhythms should be less accurately reproduced than the trained rhythms, even though they
are familiar. Alternatively, if rhythm timing accuracy depends on familiarity, then
reproduction accuracy should be similar between trained and rescaled rates, regardless of
beat strength, both learned and rescaled rhythms should be reproduced more accurately
Chapter 2
2
Method
2.1
Participants
28 participants (16 female) completed the experiment. Of the 28, 2 participants were
removed for lack of improvement over the training period, marked by a positive slope in
proportional error across the 8 blocks of rhythm reproduction. Thus, the following
analysis was completed with 26 participants (15 female), ranging from 18 – 46 years of
age (M = 23.39). 13 participants reported having some formal music training, ranging
from 2 – 23 years (M = 5.58 years). All participants reported normal hearing.
2.2
Stimuli
Twenty-four unique rhythms were created based on the stimuli used in previous studies
(Grahn & Brett, 2007). The 24 rhythms were selected to optimize uniqueness, such that
small strings of intervals (e.g. 2 1 1) were balanced across stimulus sets and conditions
(see Table 1), and to balance relative reproduction difficulty across beat strength
conditions (based on pilot data). The rhythms were created using Matlab (Mathworks),
with intervals presented as 500 Hz sine-wave tones, and the duration of each interval was
measured as the onset of one tone to the onset of the next tone. The tones lasted the
duration of each interval, minus 40 ms, so that each interval onset was distinguishable
from the previous tone. Tone onsets and offsets were created with 8ms linear ramps.
Rhythms were created for each of three conditions: Metric simple (MS), metric complex
(MC), and non-metric (NM) rhythms were created, which elicited a beat percept that was
complex conditions contained intervals that were integer-related, such that intervals were
integer multiples of the shortest duration (i.e. 2, 3, or 4 times a base unit duration of 1).
The shortest duration varied from 210-290 ms (see below). The non-metric rhythms
contained intervals that were non-integer-related (1:1.4:3.6:4). Metric simple rhythms
were designed to elicit perceptual accents at evenly spaced timepoints (e.g. every 4 base
units) throughout the rhythm (Povel & Okkerman, 1981; Grahn & Brett, 2007); these
accents indicate the beat to the listener. Metric complex and non-metric rhythms had
perceptual accents that did not occur at evenly spaced points in time, thus making it more
difficult or impossible to perceive a beat (Povel & Okkerman, 1981; Grahn & Brett,
2007). In all conditions, rhythms contained 6 or 7 intervals, and were ~3 seconds in total
duration.
During training, all rhythms were presented and reproduced at the same rate, with the
base interval duration of 250 ms. All other intervals (2:3:4) were multiples of the base
unit duration. In the rescaling condition, the trained rhythms were presented at rates 8%
faster and slower than the trained tempo. Thus, the base unit duration changed to 230ms
in the faster condition, and 270ms in the slower condition. Intervals in the learned and
rescaled rhythms were timed relative to the respective base unit durations. For example,
for the rhythm 211231, participants would have learned to tap 500 250 250 500 750 250
ms intervals, and tested on the rescaled 460 230 230 460 690 230 ms intervals. A portion
of the participants (n = 12) were tested on rhythms rescaled by +/– 16%, in addition to
the 8% manipulation. Therefore the base units for the extra rescaling conditions were 210
Stimuli were placed into 4 counterbalanced sets of 12 unique rhythms (Table 1). Each set
contained 4 rhythms of each metric condition, 2 with 6 intervals, and 2 with 7 intervals.
The stimulus sets were arranged so that each set was matched with another, with no
overlapping stimuli between them. This way, the unique stimuli for learned rhythms and
novel rhythms were balanced across participants. For example, participants who learned
set 1 were tested on sets 1 (learned/rescaled) and 2 (novel) during the final experimental
session (see Table 1). Stimulus sets 3 and 4 were a second permutation of the 24 rhythms,
and were added to eliminate stimulus-specific effects (e.g. if the rhythms in set 1 were
unexpectedly easier to reproduce than set 2, the permutations in sets 3 & 4 should balance
this issue). Participants were assigned stimulus sets for training consecutively, such that
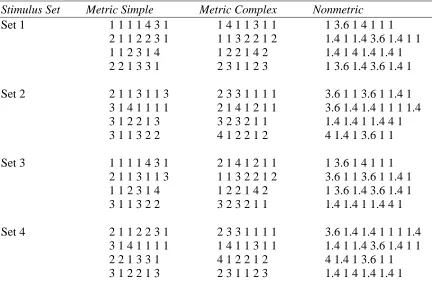
Table 1: Rhythmic Stimuli
Stimulus Set Metric Simple Metric Complex Nonmetric
Set 1 1 1 1 1 4 3 1 1 4 1 1 3 1 1 1 3.6 1 4 1 1 1 2 1 1 2 2 3 1 1 1 3 2 2 1 2 1.4 1 1.4 3.6 1.4 1 1 1 1 2 3 1 4 1 2 2 1 4 2 1.4 1 4 1.4 1.4 1 2 2 1 3 3 1 2 3 1 1 2 3 1 3.6 1.4 3.6 1.4 1
Set 2 2 1 1 3 1 1 3 2 3 3 1 1 1 1 3.6 1 1 3.6 1 1.4 1 3 1 4 1 1 1 1 2 1 4 1 2 1 1 3.6 1.4 1.4 1 1 1 1.4 3 1 2 2 1 3 3 2 3 2 1 1 1.4 1.4 1 1.4 4 1 3 1 1 3 2 2 4 1 2 2 1 2 4 1.4 1 3.6 1 1
Set 3 1 1 1 1 4 3 1 2 1 4 1 2 1 1 1 3.6 1 4 1 1 1 2 1 1 3 1 1 3 1 1 3 2 2 1 2 3.6 1 1 3.6 1 1.4 1 1 1 2 3 1 4 1 2 2 1 4 2 1 3.6 1.4 3.6 1.4 1 3 1 1 3 2 2 3 2 3 2 1 1 1.4 1.4 1 1.4 4 1
Set 4 2 1 1 2 2 3 1 2 3 3 1 1 1 1 3.6 1.4 1.4 1 1 1 1.4 3 1 4 1 1 1 1 1 4 1 1 3 1 1 1.4 1 1.4 3.6 1.4 1 1 2 2 1 3 3 1 4 1 2 2 1 2 4 1.4 1 3.6 1 1 3 1 2 2 1 3 2 3 1 1 2 3 1.4 1 4 1.4 1.4 1
Note: In training, 1 = 250ms. In rescaling, 1 = 210, 230, 270, & 290ms. All other intervals are multiples of the selected base unit.
2.3
Procedure
The experiment had 5 sessions, each separated by at least 24 hours. In the first 4 sessions
(Training), participants learned to reproduce and synchronize with 12 unique rhythms. In
the 5th session (Test), participants were tested on their ability to reproduce the 12 trained
rhythms at the learned, slower, and faster rates. At this time they were also tested on 12
novel rhythms that were not heard before.
Prior to starting the experiment, participants read a letter of information and signed
informed consent. Participants were told that they would learn to tap 12 rhythms over the
course of 4 training sessions. They were also informed that they would be tested on
from the study, in the 5th session.
On each day of Training, participants underwent 2 blocks of the Rhythm Reproduction
task, separated by 1 block of Rhythm Synchronization (tasks are described below)
(Figure 2). Before each block, participants were reminded of the task requirements. On
the first day, participants also performed the Beat Alignment Test (BAT), and preferred
tempo tapping task. On the last day (the Test phase), participants performed the
Rescaling Reproduction task followed by a short music experience questionnaire. All
participants performed the sessions seated at a desk with a laptop computer. All stimuli
for the experiment were delivered using noise-reducing headphones. After the final
session, participants were given a debriefing form. The purpose of the experiment was
reiterated orally.
2.3.1
Beat Alignment Test (BAT)
The Beat Alignment Test (BAT; Iverson & Patel, 2008) measured participants’ ability to
produce and perceive a beat when listening to short music clips. In the production test,
participants listened to music clips and tapped the beat on a computer key in time with
the beat that they perceived. After each trial, participants rated their familiarity with the
stimulus.
In the beat perception test, participants listened to the same music clips, but this time
paired with an isochronous series of tones that was timed to be either on or off the beat.
Participants decided whether the tone was on or off the beat, and indicated via button
press as soon as they knew their response. BAT production and perception tests were
presented in the same order for each participant.
2.3.2
Preferred Tempo
Participants tapped on a contact microphone at a steady pace that felt most comfortable to
them. Responses were recorded for 30 seconds using Audacity software. Data from the
preferred tempo task were not analyzed for the current experiment.
2.3.3
Rhythm Reproduction (Training)
Rhythm Reproduction required participants to listen to a rhythm, and then reproduce the
rhythm by tapping a key on a computer keyboard. On each day of training, two blocks of
the Rhythm Reproduction task were performed. In a block, each unique rhythm stimulus
was attempted on two consecutive trials, for a total 24 trials per block.
On each trial, the rhythm was presented twice, with a 1000 ms silent inter-stimulus
time” appearing the first and second times the rhythm was presented. After the second
presentation, the screen turned red, with the words “tap back”, indicating that the
participant was to reproduce the rhythm that they just heard. The response window
duration was 4000ms longer than the stimulus duration. Participants were instructed to
use the ‘m’ key on the computer to reproduce the intervals, and to do so as accurately as
possible. If every interval in a rhythm was reproduced within 15% of its target duration
(e.g. a 250 ms interval was considered correctly reproduced between 212.5 ms and 287.5
ms), participants received feedback that the trial was correct. If there were too many or
few taps, or if any of the intervals were tapped outside of the 15% window, the feedback
indicated an incorrect response.
So as to not discourage participants, the feedback threshold was set at 20% for the first
block on the first day of training. All subsequent blocks were set at the 15% threshold.
Participants were informed of the threshold before completing each block.
2.3.4
Rhythm Synchronization (Training)
The synchronization task was used to help participants identify tapping errors using
tone-by-tone feedback. As participants synchronize taps with the tones, it becomes clear which
intervals are being reproduced too short or too long during rhythm reproduction. Pilot
testing showed that the synchronization task helped improve performance on the rhythm
reproduction task.
During the synchronization task, participants tapped along with (synchronized to) the
tone onsets in the rhythm. Before starting the task, onscreen instructions were read by the
notice when they tapped in relation to the onset of the tones. Each block of rhythm
synchronization started with 1 practice trial. The practice stimulus was not used
elsewhere in the experiment.
For each trial, one rhythm was repeated 25 times, with 290msof silence between
repetitions. The silent gaps were timed such that the rhythm repetitions did not start on
the beat. Participants initiated the start of a trial by pressing the space bar on a computer.
A black screen with white numbers displayed a countdown from 3 (“3”, “2”, “1”) before
stimulus presentation began. During stimulus presentation, the screen read “Tap along
with the tones.”
To ensure recorded response times and stimulus onset times were not misaligned by
computer timing lags, the synchronization task used an external recording setup. A
Steinberg UR22 mk II soundcard was used to simultaneously record both stimulus
presentation and responses. To do this, participants tapped on a contact microphone,
which inputted audio signal to the right channel of the soundcard. The stimulus output
was looped from the source (computer) into the left input channel of the soundcard.
During the task, right and left channel inputs were recorded simultaneously using
Audacity software. The stimulus onset and tap times were then computed directly from
the waveforms created in Audacity (stimulus/response recording procedure adapted from
Jacoby & McDermott, 2017).
2.3.5
Rescaling Reproduction (Test)
Rescaling Reproduction was used in the final test phase of the experiment (session 5;
Reproduction, participants were tested on 48 stimuli. This included 12 trained, 12 novel,
and 24 rescaled stimuli. Rescaled stimuli were made up of the same relative ratios as the
12 training rhythms, but were adjusted to be slower-than-trained, and faster-than-trained
rates. The base unit (1 intervals; Table 1) for the training tempo was 250ms. In the faster
condition, the base unit was shortened by 8% (230ms), in the slower condition, the base
unit was elongated by 8% (270ms).
A portion of the participants performed more extreme rescaling (16% faster and slower)
in addition to the original 8% rescaling conditions. As the extra rescaling required a
longer testing session, the extra rescaling task allowed for a break halfway through the
Chapter 3
3
Results
3.1
Analysis
Rhythm Reproduction and Rescaling Reproduction performance was analyzed by
comparing the durations between participant keypresses (reproduced intervals), to the
durations between tone onsets in the stimuli (stimulus intervals). For each interval in a
rhythm, proportional timing error in milliseconds was calculated by subtracting the
stimulus interval from the corresponding reproduced interval, and then dividing by the
duration of the stimulus interval. Thus, perfect reproduction would be 0 error. The
absolute value of this proportional error was then averaged across all intervals within a
trial, to give one average proportional error value per trial.
Trials with the incorrect number of taps were excluded from the average error analysis, as
it is not clear which taps were intended to correspond to which stimulus interval. To
account for differing trial counts between subjects that resulted from this exclusion,
reproduction ability was additionally assessed by analyzing the proportion of trials
excluded owing to incorrect number of taps. This analysis revealed a similar pattern of
results across conditions as the proportional error analysis did (e.g., conditions with
higher proportional error also tended to have higher numbers of excluded trials),
therefore the excluded trial data are only reported in Appendix A.
3.2
Rhythm Reproduction (Training)
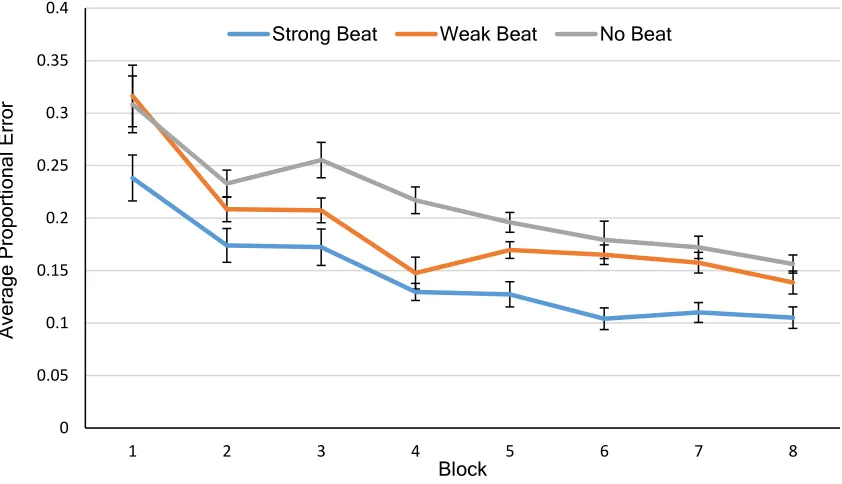
Rhythm Reproduction data are shown in Figure 3. A one-way repeated measures
beat strength (MS, MC, NM) in the last session of training (averaged across 2 blocks in
the 4th training session). A significant main effect of beat strength was found, F(2, 50) =
14.70, p < .001, ƞp2 = .563. Follow-up paired sample t-tests revealed that MS rhythms (M
= .11, SD = .063) were performed with significantly less error than both MC rhythms (M
= .15, SD = .095), t(25) = -4.31, p < .001, and NM rhythms (M = .16, SD = .069), t(25) =
-5.04, p < .001. MC rhythms and NM rhythms were not significantly different at the end
of training, t(25) = -1.31, p = .20.
Differences in the pattern of improvement over training sessions between beat strength
conditions could indicate that different strategies were used to learn different rhythm
types. To quantify learning trends, a linear function was fit to the average proportional
error for each metric condition across the 8 rhythm reproduction blocks. The resulting
linear slope values were then used in a one-way repeated measures ANOVA to measure
differences in the learning rate for MS, MC, and NM rhythms. This analysis revealed no
significant differences in rate of learning based on beat strength, F(2,50) = .078, p = .93,
suggesting that beat strength did not alter how quickly participants improved
performance. Thus, the differences in reproduction accuracy between levels of beat
strength for the training phase appears to indicate a stable timing benefit related to the
Figure 3. Average Proportional Error across 8 Training Blocks. Error bars depict
within-subject standard error (Loftus & Masson, 1994).
3.3
Rescaling Reproduction (Test)
3.3.1
Proportional Error
Proportional error in the final test session was evaluated with a 3 (beat strength; MS, MC,
NM) × 4 (rescaling; learned, slower, faster, novel) repeated measures ANOVA (Figure
3). Greenhouse-Geisser adjustment was used where sphericity violation occurred.
Significant main effects were found for both beat strength, F(2, 50) = 22.98, p < .001, ƞp2
= .479, and rescaling conditions F(1.60, 39.94) = 18.20, p < .001, ƞp2 = .421. The beat
strength by rescaling interaction was not significant, F(3.17, 79.12) = 1.17, p = .33
(Figure 4).
Follow-up paired t-tests were used to determine which differences led to the main effects.
Post-hoc analyses of the beat strength main effect revealed that MS rhythms (M = .12, SD
0 0.05 0.1 0.15 0.2 0.25 0.3 0.35 0.4
1 2 3 4 5 6 7 8
A verage P rop orti on al E rr or Block
= .076) were performed with lower average proportional error than both MC rhythms (M
= .16, SD = .093), t(26) = -4.71, p < .001, and NM rhythms (M = .20, SD = .11), t(26) =
-5.96, p < .001. Additionally, MC rhythms exhibited significantly lower average
proportional error than NM rhythms t(26) = -3.04, p = .006.
Figure 4. Average Proportional Error during Rescaling Reproduction Test Session.
Error bars depict within-subject standard error (Loftus & Masson, 1994).
Follow-up paired t-tests for the rescaling main effect showed no significant differences in
performance between learned (M = .14, SD = .092) and either faster (M = .14, SD = .081),
t(25) = .953, p = .35 or slower (M = .15, SD = .092), t(25) = -.991, p = .33 rhythms.
Performance also did not differ between faster and slower rhythms, t(25) = 1.994, p =
.057. However, performance in the novel condition (M = .21, SD = .11) was significantly 0
0.05 0.1 0.15 0.2 0.25 0.3
Learned Slower Faster Novel
A
verage
P
rop
orti
on
al
E
rr
or
worse than in learned, t(25) = -4.49, p < .001, slower, t(25) = -5.93, p < .001, and faster
conditions t(25) = -4.86, p < .001.
3.3.1.1
Influence of Music Training and Beat Perception Ability
As beat perception ability and musical training can covary with rhythm reproduction
performance, the above ANOVA was also conducted with either BAT perception score
or years of musical training added as a covariate (a total of 2 independent ANCOVAs
were conducted, each with just 1 of these covariates included). However, as neither of the
covariate main effects were significant, and neither covariate significantly interacted with
the beat strength or rescaling factors, the results of the ANCOVAs are not reported.
3.3.1.2
Extra Rescaling
A 3 (beat strength; MS, MC, NM) × 6 (rescaling; learned, slower, extra slow, faster, extra
fast, novel) repeated measures ANOVA was conducted on proportional error using data
from the 12 participants who performed rescaling of the 16% rate-changed stimuli in
addition to the 8% rate-changed stimuli (data represented in Appendix B). As in previous
analyses, significant main effects were observed for both beat strength, F(2,22) = 11.77, p
< .001, ƞp2 = .517, and rescaling conditions, F(5,52) = 4.17, p = .003, ƞp2 = .275. A
significant interaction was not observed F(10,110) = 1.82, p = .066, ƞp2 = .142.
Follow-up paired t-tests were conducted to evaluate the main effects. For the beat
strength main effect, performance on MS rhythms (M = .099, SD = .057) was not
significantly different from MC rhythms (M = .11, SD = .045), t(11) = -2.03, p = .068,
.004. Additionally, performance on MC rhythms had significantly less error than NM
rhythms, t(11) = -3.55, p = .005.
For the rescaling main effect, learned rhythms (M = .10, SD = .039) were performed with
significantly less error than slower rhythms (M = .11, SD = .048), t(11) = -2.47, p = .031,
extra slow rhythms (M = .12, SD = .038), t(11) = -2.27, p = .045, and novel rhythms (M =
.15, SD = .040), t(11) = -5.19, p < .001. Faster rhythms (M = .11, SD = .061) were
performed with significantly less error than novel rhythms, t(11) = -2.79, p = .018. Extra
slow rhythms were performed with significantly less error than novel rhythms, t(11) =
-4.83, p = .001. No other comparisons were significant (ps > .13). In general, performance
did not worsen with extra rescaling.
3.3.2
Ratio Analysis
Proportional error only measures the difference between response times and a target
duration, and does not consider the reproduced between-interval relationships. Thus, if
participants spontaneously rescale their reproduced rhythms (e.g., reproducing them
faster or slower than presented), but do so accurately (maintaining the ratio relationships
between intervals) the reproductions will still appear incorrect in a comparison of
response and target timing in milliseconds. To examine whether accuracy differed across
rhythm conditions when spontaneous rescaling was not penalized, we analyzed the
average reproduced ratios in each rhythm, scaled relative to the overall duration of the
reproduced rhythm, during the rescaling task. It is important to look at timing accuracy
on the interval level (in addition to the whole rhythm analysis above) because of the
influence of different interval types in past literature. For example, previous rescaling
(Collier & Wright, 1995). As the NM rhythms contain both integer and non-integer
ratios, it is possible that reproduction accuracy and rescaling accuracy is altered by
interval type.
For the ratio analysis, each reproduced interval was divided by the total duration of
reproduction in a trial (i.e. the time from the first tap to the final tap). Each resulting
fraction of the total duration was then multiplied by the total number of base units in the
target rhythm (e.g., the rhythm 43122 would have 12 base units), thus converting the
response duration fractions (in milliseconds) into ratio units (e.g., 1, 2, 3, 4). In a trial,
ratios for each unique interval type were averaged. By this calculation, perfect
reproduction of ratios would result in 1, 2, 3, and 4 ratios for the MS and MC rhythms,
and 1, 1.4, 3.6, and 4 for the NM rhythms. For example, if a rhythm had intervals 1000
750 250 500 500, but was reproduced faster, say as 800 600 200 400 400, then these steps
would yield values of 4,3,1,2,2. Signed proportional error for the reproduced ratios was
then calculated by subtracting the ideal performance from the average reproduced ratios
on each trial, and then dividing by the ideal ratio, yielding the proportion error of the
ratio. Thus, negative-signed error indicates a shortening of that interval ratio (relative to
the duration of the entire rhythm), and positive error indicates a lengthening of the
interval. Perfect reproduction would result in 0 error.
A 3 (beat strength; MS, MC, NM) × 4 (rescaling; learned, slower, faster, novel) × 4
(interval; 1,2,3,4; for NM: 2 = 1.4, 3 = 3.6) repeated measures ANOVA was conducted
on reproduced ratio error values. This revealed significant main effects of beat strength,
F(1.59, 39.70) = 14.24, p < .001, ƞp2 = .363, and interval, F(1.58, 39.40) = 35.49, p <
= .34. Significant interactions were found between beat strength and interval, F(3.23,
80.85) = 10.59, p < .001, ƞp2 = .297, and between rescaling and interval, F(4.22,105.38) =
3.51, p = .009, ƞp2 = .123 (Figure 5).
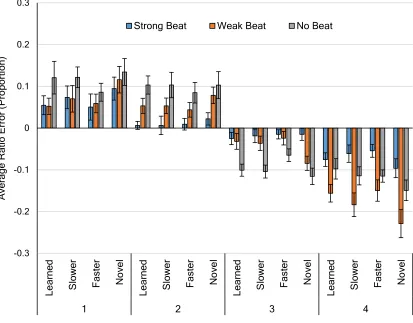
Figure 5. Average Proportional Error for Reproduced Ratios. For NM rhythms, 2
and 3 intervals are 1.4 and 3.6. Values further from 0 represent greater error. Error
bars depict within-subject standard error (Loftus & Masson, 1994).
Follow-up paired t-tests were conducted to evaluate the main effects. Performance error
for ratios was collapsed across interval and rescaling conditions to examine the beat
strength main effect. On average, MS intervals (M = -.0025, SD = .0081), were truncated
significantly less (closer to 0 performance error) than MC intervals (M = -.024, SD =
.023), t(25) = 4.27, p < .001, but were not significantly different from NM intervals (M =
-0.3 -0.2 -0.1 0 0.1 0.2 0.3 Le
arned Slower Fas
ter
No
ve
l
Le
arned Slower Fas
ter
No
ve
l
Le
arned Slower Fas
ter
No
ve
l
Le
arned Slower Fas
ter
No
ve
l
1 2 3 4
A verage Rati o E rr or ( P rop orti on )
-.0023, SD = .013), t(25) = -.084, p = .93. MC intervals were truncated significantly more
than NM intervals, t(25) = -4.015, p < .001.
The main effect for interval was calculated by comparing the average ratio error
collapsed across beat strength and rescaling conditions for each interval. Performance on
1 intervals (M = .086, SD = .90) was not significantly different from 2 intervals (M =
.0525, SD = .057), t(26) = 1.66, p = .11, but were significantly longer than 3 intervals (M
= -.053, SD = .056), t(26) = 5.012, p < .001, and 4 intervals (M = -12, SD = .079), t(26) =
6.78, p < .001. Similarly, the 2 intervals were significantly longer than the 3 intervals,
t(26) = 5.56, p < .001, and 4 intervals, t(26) = 7.31, p < .001. Finally, the 3 intervals were
truncated significantly less than the 4 intervals, t(26) = 8.62, p <.001. Notably,
differences between the short (1 and 2) intervals and long (3 and 4) intervals were driven
by different directions of error (lengthening vs. shortening). That is, shorter intervals
were reproduced as longer than their respective target ratios, and longer intervals were
reproduced as shorter than their respective target ratios.
Moving next to the beat strength by interval interaction, average ratio error was collapsed
across rescaling conditions, and paired-sample t-tests were conducted to compare ratio
error across levels of beat strength (MS, MC, NM) within each interval condition (1, 2, 3,
4). On average, MS 1 intervals (M = 0.068, SD = 0.10) were significantly less elongated
(closer to 0 error) than NM 1 intervals (M = .12, SD = .12), t(25) = -2.66, p = 0.014. MC
1 intervals (M = .074, SD = .11) did not significantly differ from MS or NM 1 intervals
(ps > .11). MS 2 intervals (M = .012, SD = .06) were truncated significantly less than MC
2 intervals (M = .055, SD = .055), t(25) = -4.03, p < .001 , and NM 2 intervals (M = .091,
significantly different, t(26) = -1.80, p = .083. MS and MC 3 intervals (M = -.0184, SD =
.046) were not significantly different (M = -.044, SD = .077), t(25) = 1.96, p = .061. MS 3
intervals were truncated significantly less (closer to 0 error) than NM 3 intervals (M =
-.096, SD = .073), t(25) = 9.04, p < .001. MC 3 intervals were truncated less than NM 3
intervals, t(25) = 3.64, p = .001. MS 4 intervals (M = -.072, SD = .075) were truncated
significantly less than both MC 4 intervals (M = -.18, SD = .12), t(25) = 5.96, p < .001,
and NM 4 intervals (M = -.12, SD = .081), t(25) = 2.93, p = .007. However, MC 4
intervals were truncated significantly more than NM 4 intervals, t(25) = -3.54, p = .002.
In sum, it appears that the short MS intervals were lengthened less than MC and NM
intervals, and the long MS intervals were shortened less than the MC and NM rhythms.
MC and NM intervals only differed on the long intervals (3 & 4), but the direction of this
difference did not systematically depend on beat strength.
Finally, the rescaling by interval interaction was explored by collapsing ratio error scores
across beat strength conditions, and conducting paired-samples t-tests between rescaling
conditions within each interval. Slow 1 intervals (M = .089, SD = .098) and novel 1
intervals (M = .11, SD = .11) were elongated significantly more than fast 1 intervals (M =
.066, SD = .10), t(25) = 2.14, p = .043; t(25) = -2.54, p = .018. Fast 3 intervals (M =
-.035, SD = .062) were significantly less truncated than learned 3 intervals (M = -.053, SD
= .066), t(25) = 2.40, p = .024, slow 3 intervals (M = -.053, SD = .064), t(25) = 2.73, p =
.012, and novel 3 intervals (M = -.072, SD = .056), t(25) = -4.34, p < .001. Learned 4
intervals (M = -.11, SD = .086) and fast 4 intervals (M = -.11, SD = .080) were
significantly less truncated than novel 4 intervals (M = -.16, SD = .11), t(25) = 2.86, p =
significant (all ps > .06). In general, short intervals in the fast condition were not
lengthened as much as short slow and novel intervals, and long intervals in the learned
and fast conditions were less truncated than long intervals for the novel condition.
3.3.3
Correlation with Training Performance
To investigate the relationship between Rhythm Reproduction performance during
training and performance on the Rescaling Reproduction task, proportional error for the
final training session (performance averaged across the 2 blocks on the 4th day of
training) was correlated across participants with proportional error for the learned rate,
rescaled rates (averaged across slower and faster conditions), novel stimuli during
Rescaling Reproduction, and the first day of training (averaged across 2 blocks).
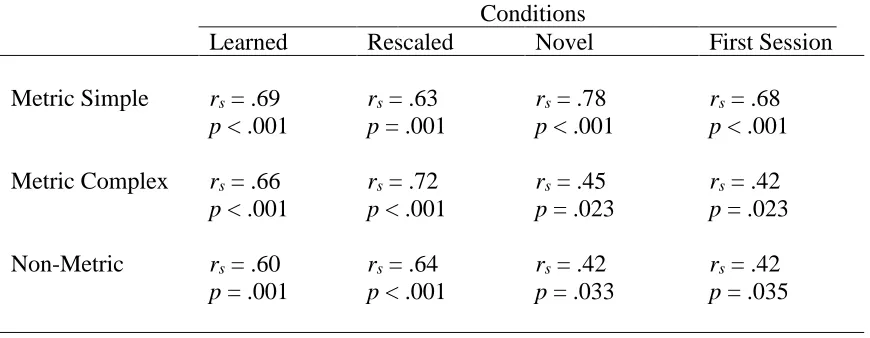
Significant Spearman correlations were found between final training session performance
and rescaling reproduction performance for all beat strength conditions (see Table 2).
Table 2. Correlations with Final Training Session Performance error and
performance on the Rescaling and Novel conditions in the Rescaling Reproduction
task.
Conditions
Learned Rescaled Novel First Session
Metric Simple rs = .69
p < .001
rs= .63
p = .001
rs = .78
p < .001
rs= .68
p < .001
Metric Complex rs= .66
p < .001
rs = .72
p < .001
rs= .45
p = .023
rs= .42
p = .023
Non-Metric rs= .60
p = .001
rs= .64
p < .001
rs= .42
p = .033
rs= .42
Altogether, these correlations suggest that performance on the final day of training
predicted performance in the Rescaling Reproduction task for all beat strength conditions.
Strong relationships (i.e., r > .6) for learned and rescaled conditions indicate that
participants who performed well during training also performed well on the same
rhythms in the final Rescaling Reproduction task, regardless of rate changes. For MC and
NM rhythms, relatively weaker correlations for performance on the final day of training
with performance on the first day of training, and performance on the final day of training
with performance on novel rhythms during the Rescaling Reproduction task may reveal
that familiarity with the stimuli was important for predicting performance. However, for
the MS rhythms, performance during the final training session predicted Rescaling
Reproduction performance for both familiar (i.e., during rescaling and learned
Chapter 4
4
Discussion
Research in rhythm and timing suggests that the presence of a beat in acoustic rhythms
elicits behavioural advantages in rhythm reproduction. Behavioural advantages may arise
from the beat structure across a rhythm, which allows for interval durations to be encoded
relative to the beat, rather than encoding a rhythm as a series of independent durations.
However, as the everyday human environment is rich with regularity, such as in music,
an equally plausible explanation for beat-based advantages is a general familiarity with
strong-beat rhythms. Thus, previous research in beat perception may be confounded by
the discrepant familiarity between rhythms with a strong beat and irregular rhythms that
do not have a beat. The current study was designed to probe whether equally familiar
acoustic rhythms were encoded relative to beat strength, or whether timing performance
is dependent on familiarity with a rhythm, regardless of beat strength. By familiarizing
participants with strong-, weak-, and non-beat rhythms, we expected to see differences in
rescaling accuracy, an ability known to be possible for beat-based music, that would be
sensitive to either beat strength, or familiarity. Generally, the results did not conclusively
show that timing performance depends solely on either beat strength or familiarity.
However, there is evidence that both beat strength and familiarity improve timing
performance independently.
The following discussion details the current findings, how the findings fit with previous
research, limitations to the study, and proposed future directions to continue investigating
4.1
Current Findings
Over 4 days of training, participants improved performance for rhythms in strong-, weak-
and non-beat conditions. The goal of the training period was to improve performance
such that beat and non-beat rhythms could be reproduced at similar accuracy. However,
despite equal exposure to and practice on all rhythms, weak- and non-beat rhythms were
not performed as accurately as strong-beat rhythms by the end of training. The analysis of
slope across the 4 training days revealed that the rate of learning was not significantly
different between rhythmic conditions. Thus, the difference in accuracy at the end of
training was similar to the difference in accuracy at the beginning of training, perhaps
indicating a benefit of beat strength that is independent from exposure-based benefits.
On the final test (Rescaling Reproduction), the effect of beat strength remained:
Strong-beat rhythms were reproduced most accurately, followed by weak-Strong-beat rhythms, and
non-beat rhythms were reproduced at the poorest accuracy overall. Surprisingly, rescaling
accuracy was not sensitive to beat presence. Reproduction accuracy for trained strong-,
weak-, and non-beat rhythms did not alter depending on rate.Moreover, the learned
(same rate) and rescaled (faster/slower rate) versions of the trained rhythms were both
performed more accurately than the novel rhythms, suggesting that rescaling did not
compromise the learning gained from the training period.
The analysis of reproduced ratios indicates a general truncating of longer intervals (i.e. 3,
3.6, 4), and better precision on shorter intervals (i.e. 1, 1.4, 2). Consistent with previous
work, truncation of 3 and 4 intervals was less severe for strong-beat rhythms (Grahn &
Brett, 2007), suggesting that beat presence aids in reproducing longer intervals. This
participants to encode a smaller unit of time (i.e. a beat unit), rather than encoding and
reproducing a unique long duration. For example, a 4 interval may be more accurately
reproduced if it is encoded as 2 shorter beat units, for which reproduction is shown to be
more accurate. However, when it is difficult to detect a beat, performance accuracy may
reflect the difficulty in estimating longer units of time.
Some have suggested that non-integer ratios elicit greater error because they are
systematically regularized to nearby integer-related intervals (e.g., a 1.4 interval may be
reproduced as a 2 interval) (Collier & Wright, 1995; Jacoby & McDermott, 2017).
Though the 1.4 and 3.6 intervals in the current study do appear to approach
integer-related intervals (1.4 is elongated towards 2, and 3.6 is truncated towards 3), this pattern
of error is not reliably different from integer-ratio error for similar durations. For
example, error on the 1.4 ratios were not significantly different from the MC 2 ratio error,
and the longer intervals in strong and weak-beat rhythms are truncated to a similar degree
as the long intervals (3.6 and 4) in non-beat rhythms (see Figure 5). Therefore, it is more
likely that participants have difficulty prolonging responses for long durations or have a
limited ability to encode long durations, and the greater truncation for 3.6 intervals is due
to its longer absolute duration compared to the 3 interval. A general difficulty with long
intervals could explain the slight improvement on 3 and 4 intervals in the faster rescaling
condition. At faster rates, the absolute durations of intervals become shorter, thus a
tendency to truncate intervals, or an inability to encode longer durations, would affect
4.2
Encoding Rhythms Relative to Beat Strength
Pertaining to the original research question, the results do not conclusively show whether
rescaling accuracy depends on beat strength, or familiarity. Our hypothesis predicted an
interaction between beat strength and rescaling. If rhythms were encoded relative to a
beat, rescaled reproduction accuracy for weak- and non-beat rhythms should be worse
than non-rescaled reproduction accuracy, perhaps approaching accuracy observed for
novel rhythms. Alternatively, if familiarity allows rescaling, reproduction accuracy after
training for learned and rescaled rates should be similar across all beat strengths, and
should be more accurately reproduced than novel rhythms. However, neither of these
expected results were observed. This is likely because the experimental design depended
on participants learning all categories of rhythms to an equal accuracy level during
training, and this did not happen. Although participants improved on all rhythms,
differences in accuracy between different levels of beat strength persisted across training.
The enhanced performance for strong-beat rhythms throughout the experiment may
indicate that beat strength independently benefits rhythmic timing regardless of
familiarity with the stimuli. Replicating Grahn and Brett (2007), we show that beat
strength improves performance, with stronger beat presence eliciting more accurate
reproduction. However, the current study is the first to show that beat strength is still
beneficial when stimuli are very familiar. Though training improved performance on all
rhythm types over time, the amount of familiarity gained from the training phase was not
enough to eliminate the beat-based advantage. Though it is possible that 4 training
sessions was not sufficient to override the familiarity gained from environmental
stimuli may suggest that beat strength improves timing independently from familiarity.
An independent benefit of beat strength is substantiated by strong correlations between
performance on the last session of training and performance on novel rhythms with a
strong beat. This correlation indicates that the performance on trained strong-beat
rhythms predicts performance on strong-beat rhythms that are relatively unfamiliar.
Therefore, this relationship likely does not depend on the familiarity gained from the 4
days of training, but may instead depend on the presence of a strong beat. Relatively
weaker correlations for rhythms with a weak or no beat between the final training session
and novel rhythms reinforce this interpretation by showing that without a strong beat, the
timing performance on rhythms at the end of training do not strongly predict performance
on unfamiliar rhythms with weak or no beat presence. Therefore the relatively strong
relationship between performance on the final training session and unfamiliar rhythms in
the strong-beat condition may be indicative of a general performance benefit of beat
presence, rather than the familiarity gained from training.
4.3
The Role of Familiarity
Though the current findings suggest that familiar weak- and non-beat rhythms are still
not encoded as accurately as familiar strong-beat rhythms, familiarity does appear to play
a role in rescaling accuracy. We found no differences between the performance of learned
and rescaled rhythms within each beat condition, and all familiar rhythms were
reproduced more accurately than novel rhythms of the same beat-strength. Therefore,
familiarity gained from training likely allowed for accurate rescaling in the current
experimental design. Like the interpretation of beat-based timing benefits, this conclusion
final training performance was highly correlated with rescaling performance in all beat
conditions, correlations were weaker between final training performance and novel
rhythms with weak or no beat presence, suggesting that the benefits of the training period
were important for reproducing familiar rhythms, even at different-from-learned rates.
However, for weak- and non-beat rhythms, the performance in training was less
predictive of performance on novel rhythms, suggesting that the improved accuracy for
learned and rescaled rhythms was due to familiarity with the stimuli. Importantly, this
finding is different from performance on the strong-beat rhythms, which is highly
correlated regardless of familiarity, perhaps indicating an added benefit of beat presence
for this rhythm type. A similar finding was reported by Tillmann et al. (2011) who found
that differences in interval timing performance between two different exposure groups
were only statistically significant when the task required rescaled reproduction. At the
learned rate, performance on the test sequence was relatively similar between groups, and
did not depend on the familiarity with the test sequence, but when reproduced faster than
the learned rate, participants who were most familiar with the stimulus performed better
than the control group (Tillmann et al., 2011). Together with the current findings, it
appears that familiarity with rhythms may provide general benefits to some
timing-related tasks, but the difference between beat conditions in the current experiment implies
that these familiarity-based benefits may occur independently from beat-related timing
benefits.
4.4
A Dual Role of Familiarity and Regularity
In agreement with the current findings, timing research outside of beat perception
Western infants’ ability to discriminate between sequences with ratios of temporal
intervals that were either familiar, unfamiliar, or rare in Western music (2:1, 3:2, 7:4;
respectively). While the infants generally detected disruptions (measured via novelty
preference after habituation) in stimuli for the simple, familiar ratios, only the
5-month-olds, and not 7-month-5-month-olds, detected disruptions in the unfamiliar, complex (3:2) ratios.
This suggests that the perception of temporal intervals can become biased towards those
commonly experienced in the environment—7-month-olds were insensitive to the less
common 3:2 ratios than 5-month-olds. However, neither the 5- nor 7-month-old infants
detected disruptions in the rare, highly complex (7:4) intervals. As enculturation had less
chance to influence 5-month-olds, this finding suggests that there are inherent constraints
to temporal perception prior to cultural familiarity, with a preference for simpler interval
ratios (Hannon, Soley, & Levine, 2011).
A general preference for simple interval ratios is also apparent in interval reproduction
performance. For example, serial binary intervals (1:2:4:8) are reproduced more
accurately than non-binary intervals (1:3:5:6), though both types of ratios occur in music
(Wu, Westanmo, Zhou, & Pan, 2013). In a study designed to detect a bias toward
regularity in interval reproduction, subjects were presented with a sequence of
randomly-timed intervals. After reproducing this “seed” sequence by tapping, the stimulus on the
following trial would be made up of the response durations on the previous trial. After
many iterations, most subjects tended to regularize the original randomly-timed
sequences toward integer-ratio intervals, suggesting that sequence timing is biased
towards regularity (Jacoby & McDermott, 2017). Interestingly, the study tested North
in music. Although North American and Amazonian groups have some different
preferred patterns of intervals, there is also much overlap in the preferred patterns
between groups, with both groups regularizing the intervals into integer ratios (Jacoby &
McDermott, 2017). Altogether, this suggests that familiarity through exposure widely
influences the perception and reproduction of temporal intervals. However, a general
preference for regularity and simple temporal relationships seems to be universal, and
may indicate a regularity bias independent from, or in conjunction with, familiarity
biases.
4.5
Limitations
A limitation of this experiment is that subjects did not learn all rhythm conditions equally
well. One possible contributing factor to this is that feedback during reproduction
performance did not provide information on the types of errors participants were making.
During rhythm reproduction tasks, participants received binary feedback, and rhythms
were considered incorrect when just 1 interval was incorrect, or were performed with the
wrong number of taps. We attempted to remedy this problem by using synchronization
during the training blocks, during which participants could hear when sounds were
occurring, and compare this time to when they were tapping. However, this method
requires participants to have the ability to perceive their mistakes. This type of feedback
may not have provided enough information to improve timing for the more difficult
weak- and non-beat rhythms for all subjects.
An additional explanation for the differences in rhythm learning is that weak- and
non-beat rhythms may require more time to learn than strong-non-beat rhythms. As culture-based
unfamiliarity with weak- and non-beat rhythms may not be overridden by just 4 training
sessions. Therefore, if the training session was extended, it is possible that performance
on the weak- and non-beat rhythms would continue to improve, perhaps to the accuracy
of the strong-beat rhythms.
Finally, it is possible that the method of rescaling used in this experiment was not
sensitive to differences in encoding strategies. This may explain why our results conflict
with previous rescaling studies. Specifically, Collier & Wright (1995) found that only
integer-ratio intervals, compared to non-integer ratios, could be rescaled correctly after
learning. In the current study, although rhythms with non-integer ratios were generally
performed worse than rhythms with only integer ratios, there were no differences in
reproduction performance between the learned and rescaled rates of the non-beat
rhythms. This suggests that subjects in the current experiment could rescale rhythms
containing non-integer ratios. The analysis of interval ratios confirmed that this ability
was not driven by the integer-related ratios in non-beat rhythms, as performance on the
1.4 and 3.6 intervals did not consistently differ between learned and rescaled rates.
The discrepancy with Collier & Wright’s (1995) findings may be due to differences in the
level of difficulty associated with the current task, and that used in their rescaling
experiment. Collier & Wright (1995) only gave their subjects the total duration with
which they must tap the two target intervals, whereas in the current experiment
participants listened to the target rhythm at the target (whether faster, slower, or the
same) rate before responding. Thus, participants in the Collier & Wright (1995) study
were required to remember the trained intervals, then internally manipulate the intervals