Western University Western University
Scholarship@Western
Scholarship@Western
Electronic Thesis and Dissertation Repository
4-23-2019 11:00 AM
Big Data for Traffic Engineering in Software-Defined Networks
Big Data for Traffic Engineering in Software-Defined Networks
Wander Queiroz
The University of Western Ontario Supervisor
Capretz, Miriam
The University of Western Ontario
Graduate Program in Electrical and Computer Engineering
A thesis submitted in partial fulfillment of the requirements for the degree in Doctor of Philosophy
© Wander Queiroz 2019
Follow this and additional works at: https://ir.lib.uwo.ca/etd
Recommended Citation Recommended Citation
Queiroz, Wander, "Big Data for Traffic Engineering in Software-Defined Networks" (2019). Electronic Thesis and Dissertation Repository. 6147.
https://ir.lib.uwo.ca/etd/6147
This Dissertation/Thesis is brought to you for free and open access by Scholarship@Western. It has been accepted for inclusion in Electronic Thesis and Dissertation Repository by an authorized administrator of
Abstract
Software-defined networking overcomes the limitations of traditional networks by splitting the control plane from the data plane. The network logic is moved to a component called the controller that manages devices in the data plane. To implement this architecture, it has become the norm to use the OpenFlow protocol, which defines several counters that are maintained by network devices. These counters are the starting point for Traffic Engineering activities. Traffic Engineering monitors several network parameters, including network bandwidth utilization. A great challenge for Traffic Engineering is to collect and generate statistics about bandwidth utilization for monitoring and traffic analysis activities. This becomes even more challenging if fine-grained monitoring is required. Network management tasks such as network provisioning, capacity planning, load balancing, and anomaly detection can benefit from this fine-grained monitoring. Because the counters are updated for every packet that crosses the switch, they must be retrieved in a streaming fashion. This scenario suggests the use of Big Data techniques to collect and process counter values.
The benefits of Big Data techniques for collecting and processing counter values are two-fold. First, Big Data techniques provide streaming processing tools that can deliver outputs in near real time, which can help early detection of anomalous traffic behaviour and possible proactive actions toward resolving the issue. Second, Big Data techniques provide batch pro-cessing tools that can deal with a large amount of historical data, which enable the use of Big Data analytics techniques to achieve a better understanding of traffic behaviour over time.
This research proposes an approach based on a fine-grained Big Data traffic monitoring method to collect and generate traffic statistics using counter values. This research work can significantly leverage Traffic Engineering. The approach can provide a more detailed view of network resource utilization because it can deliver individual and aggregated statistical analy-ses of bandwidth consumption. In the context of the proposed monitoring method, this research proposes a new approach to estimate the Traffic Matrix, a repository that maintains information about the traffic volume between all host origin-destination pairs. This research also proposes a traffic analysis method based on batch processing of historical traffic data. Experimental results show the effectiveness and potential of the proposed methods.
Keywords: Software-Defined Network (SDN), OpenFlow, Network Monitoring, Traffic Engineering, Traffic Matrix, Big Data Streaming, Traffic Analysis.
Co-Authorship Statement
The thesis presented here has been written by Wander J´acome de Queiroz under supervision of Dr. Miriam A. M. Capretz. Parts of the content of this thesis has been published in peer-reviewed journal, or is under review for publication. The research published in each paper has been mainly conducted and written by the principal author. The presented research is guided and supported by Dr. Miriam Capretz as the research supervisor.
A version of the material presented in Chapter 4 has been published in
• W. Queiroz, M. A. Capretz, and M. Dantas, “An approach for SDN traffic monitoring based on big data techniques,” in Journal of Network and Computer Applications, vol. 131, pp. 28–39, Apr. 2019.
– W. Queiroz - developed the model, collected experimental data, analyzed the re-sults, evaluated the model and wrote the manuscript.
– M. Capretz and M. Dantas - contributed to the interpretation of the work by criti-cally revising the paper.
The material presented in Chapter 6 is currently under peer review for publication in
• W. Queiroz, M. A. Capretz, and M. Dantas, “A MapReduce Approach for Traffic Matrix Estimation in SDN,” inIEEE Access, 2019.
– W. Queiroz - designed the model and experiments, analyzed the results, evaluated the approach and wrote the manuscript.
– M. Capretz and M. Dantas - contributed to the interpretation of the work by criti-cally revising the paper.
Acknowledgements
First, I would like to express my deep gratitude to Dr. Miriam Capretz, my supervisor, for the support of my Ph.D. study, for her patience, guidance and for believing in me and in my research project. Her comments and suggestions had a huge impact on this thesis and improved the quality of this research work.
My sincere thanks also go to Dr. Mario Dantas, Dr. Wilson Higashino, Dr. Katarina Grolinger, Dr. Hany ElYamany, and Dr. He Fang for their help and encouragement.
I would like to offer my special thanks to my wife Leticia Queiroz and my beloved child An-nie Queiroz for their unconditional support and making these years of research work a pleasant journey.
To my parents Ademar Moreira Queiroz (in memoriam) and Dilza J´acome Queiroz and brothers Jusley J´acome Queiroz, Ademar Moreira Queiroz Junior and Wladimir J´acome Queiroz for their support and encouragement.
A special thanks to my mother-in-law Ivonice Alves Rocha for solving our problems when we could not be there to solve them, and also for her love for Annie, Leticia and me.
Thanks to all my friends from TEB 346 and TEB 244, Roberto Barboza, Dennis Bachmann, Daniel Araya, Jos´e Miguel, Willamos Aguiar, Alexandra L’Heureux, Rafael Aguiar, Dr. Mah-moud ElGayyar and Norman Tasfi for providing a happy and healthy environment for research work.
Thanks to Prof. Quazi Rahman for the great privilege of being his TA and to all TA col-leagues for the moments we shared in the labs and marking sessions.
Thanks to ECE department for the opportunity and the graduate coordinator Stephanie Tigert for always being available to help.
Contents
Abstract ii
Co-Authorship Statement iii
Acknowledgements iv
List of Figures viii
List of Tables xi
List of Acronyms xii
1 Introduction 1
1.1 Motivation . . . 4
1.2 Contributions . . . 5
1.3 Thesis Organization . . . 7
2 Background 8 2.1 Software-Defined Networking . . . 8
2.1.1 OpenFlow . . . 11
2.1.2 Traffic Engineering . . . 14
2.2 Big Data . . . 17
2.2.1 Processing of Streaming Big Data . . . 17
2.2.2 MapReduce . . . 18
2.2.3 Lambda Architecture . . . 20
2.3 Summary . . . 20
3 Literature Review 22 3.1 Traffic Monitoring . . . 22
3.2 Traffic Matrix Estimation . . . 28
3.3 Summary . . . 31
4 Big Data Traffic Monitoring Method 32
4.1 Introduction . . . 32
4.2 Data Acquisition . . . 33
4.3 Data Aggregation . . . 42
4.3.1 Queue Messages . . . 42
4.3.2 Generate Statistics . . . 43
4.4 Data Persistence . . . 44
4.5 Summary . . . 45
5 Implementation 46 5.1 Big Data Traffic Monitoring Implementation . . . 46
5.1.1 SDN Controller . . . 47
5.1.2 Data Acquisition . . . 48
5.1.3 Data Aggregation . . . 51
5.1.4 Data Persistence . . . 52
5.1.5 Environment . . . 53
5.1.6 Deployment . . . 53
5.2 Summary . . . 54
6 MapReduce Traffic Matrix Estimation Method 56 6.1 MapReduce Design . . . 56
6.2 Basic Definitions . . . 57
6.2.1 Implementation . . . 59
6.2.2 Generatehkey,valueiPairs Algorithm . . . 64
6.3 Summary . . . 67
7 Big Data Traffic Analysis 68 7.1 Traffic Analysis Method . . . 68
7.1.1 Store Streaming Data . . . 70
7.1.2 Calculate Switch Port Traffic Statistics . . . 70
7.1.3 Generate Switch Traffic Statistics . . . 70
7.1.4 Generate Network Switch Statistics . . . 72
7.1.5 Generate Network Port Statistics . . . 72
7.1.6 Generate Switch Traffic Analysis . . . 72
7.1.7 Generate Switch Port Traffic Analysis . . . 74
7.1.8 Generate Link Traffic Analysis . . . 75
7.1.9 Generate Path Traffic Analysis . . . 75
7.2 Summary . . . 76
8 Experimental Results 78 8.1 Big Data Monitoring Results . . . 78
8.1.1 Switch and Port Throughput . . . 79
8.1.2 Switch Throughput Breakdown . . . 81
8.1.3 Switches Throughput . . . 82
8.1.4 Port Capacity Usage . . . 82
8.1.5 Links Throughput . . . 83
8.1.6 Current Link Throughput . . . 84
8.2 MapReduce TM Estimation Results . . . 85
8.2.1 Host-to-Host Throughput . . . 85
8.2.2 Host-to-Host Current Throughput . . . 86
8.3 Performance Evaluation . . . 87
8.4 Big Data Traffic Analysis Method Results . . . 89
8.4.1 Switch Port Traffic Analysis . . . 90
8.4.2 Switch Traffic Analysis . . . 91
8.4.3 Link Traffic Analysis . . . 92
8.4.4 Path Traffic Analysis . . . 93
8.5 Summary . . . 95
9 Conclusions 96 9.1 Contributions . . . 97
9.2 Future Work . . . 98
9.2.1 Traffic Engineering . . . 99
9.2.2 Traffic Monitoring and Analysis . . . 99
Bibliography 103
Curriculum Vitae 111
List of Figures
1.1 TE approach based on Big Data techniques. . . 3
2.1 High-level illustration of control and data plane deployment (adapted from [1]). 9 2.2 Basic SDN architecture [2]. . . 10
2.3 Distributed architecture (Adapted from [3]). . . 11
2.4 Basic OpenFlow architecture (Adapted from [4]). . . 12
2.5 OpenFlow device. . . 13
2.6 Packet flow through an OpenFlow switch [5]. . . 14
2.7 Scope of traffic engineering [2]. . . 16
2.8 MapReduce flow [6]. . . 19
2.9 MapReduce example (Adapted from [7]). . . 19
2.10 Lambda architecture (Adapted from [8]). . . 21
4.1 Big Data traffic monitoring method. . . 33
4.2 ER model for inventory data. . . 34
4.3 Collect streaming data. . . 37
4.4 Switch hierarchy. . . 41
4.5 Queue messages process. . . 42
4.6 Generate statistics procedure. . . 44
5.1 Big Data traffic monitoring components. . . 47
5.2 OpenDaylight architecture [9]. . . 48
5.3 Repositories. . . 48
5.4 Collect streaming data package. . . 50
5.5 Generate statistics package. . . 52
5.6 Big Data traffic monitoring deployment. . . 54
6.1 MapReduce design. . . 57
6.2 Port statistics message layout. . . 59
6.3 Network topology. . . 61
6.4 OpenDaylight topology representation. . . 61
6.5 Line for extractingU1elements. . . 62
6.6 Line for extractingU2elements. . . 62
6.7 L1element. . . 62
6.8 L2element. . . 62
6.9 Topology traversing S1. . . 63
6.10 Topology traversing S2. . . 63
6.11 Paths between (h7,h5) and (h8,h1). . . 63
6.12 Port origin/destination pairs. . . 64
6.13 LPentries for two paths between the same OD. . . 65
6.14 Collected statistics on link S1:eth1/S3:eth3. . . 66
7.1 Traffic analysis method. . . 69
7.2 Traffic statistics message layout. . . 70
7.3 Output generated by the calculate switch port traffic statistics activity. . . 70
7.4 Switch analysis generation. . . 74
7.5 Port analysis generation. . . 75
7.6 Link analysis generation. . . 76
7.7 Path analysis generation. . . 76
8.1 Monitoring scheduling diagram. . . 78
8.2 Switch and port throughput. . . 80
8.3 Port contribution to switch throughput. . . 81
8.4 Switch throughput. . . 82
8.5 Port percentage capacity used. . . 83
8.6 Links throughput. . . 85
8.7 Links current throughput. . . 86
8.8 Origin-Destination throughput. . . 87
8.9 Origin-Destination current throughput. . . 87
8.10 Record input rate. . . 88
8.11 Scheduling delay. . . 88
8.12 Processing time. . . 89
8.13 Total delay. . . 89
8.14 Batch scheduling diagram. . . 89
8.15 Switch port traffic analysis. . . 90
8.16 Switch traffic analysis. . . 91
8.17 Links throughput distribution. . . 93
8.18 Path average throughput. . . 94
9.1 TE scope. . . 99
List of Tables
2.1 List of counters. . . 15
4.1 Attributes for the switch entity. . . 35
4.2 Attributes for the switch port entity. . . 36
4.3 Attributes for port counters. . . 38
4.4 Attributes for flow table counters. . . 39
4.5 Attributes for flow counters. . . 40
5.1 Host attribute description. . . 49
5.2 Network interface attribute description. . . 49
5.3 Switch attribute description. . . 49
5.4 Link attribute description. . . 49
5.5 Hardware environment. . . 53
6.1 Generatedhkey,valueipairs. . . 66
6.2 Reduce by key applied tohkey,valueipairs. . . 67
7.1 Calculated port throughputs. . . 71
7.2 Mean statistics . . . 73
7.3 Example of the switch traffic analysis object. . . 74
7.4 Example of the switch port traffic analysis object. . . 75
7.5 Example of the path traffic analysis object. . . 77
8.1 IP routing table. . . 79
8.2 Origin-Destination roots. . . 86
8.3 Links h1–h7. . . 94
8.4 Links h2-h6. . . 94
List of Acronyms
ARP Address Resolution Protocol
API Application Programming Interface
BPMN Business Process Model and Notation
BR Bytes Received
BRT Bytes Received Throughput
BT Bytes Transmitted
BTr Bytes Throughput
BTT Bytes Transmitted Throughput
ER Entity-Relationship
ICMP Internet Control Message Protocol
IETF Internet Engineering Task Force
IP Internet Protocol
LA Lambda Architecture
LLDP Link Layer Discovery Protocol
MAC Media Access Control
MDNS Multicast Domain Name System
NOS Network Operating System
OD Origin-Destination
OF OpenFlow
ONF Open Networking Foundation
OSGI Open Services Gateway Initiative
PR Packets Received
PRT Packet Received Throughput
PT Packets Transmitted
PTr Packet Throughput
PTT Packet Transmitted Throughput
QoS Quality of Service
REST Representational State Transfer
SDN Software-Defined Networks
TCP Transmission Control Protocol
TE Traffic Engineering
TM Traffic Matrix
VLAN Virtual Local Area Network
XML Extensible Markup Language
Chapter 1
Introduction
Software-defined networking (SDN) is a paradigm designed to overcome the limitations of traditional networks [1, 10]. This approach makes the network more programmable and easier to configure. The problem with traditional networks is that the control plane and the data plane are embedded in the same device. As a result, no point in the network has a global view of the network. Such a design also makes it difficult to change the network configuration. Basically, each device must be manually configured to reflect a new configuration. This process becomes even more challenging for large networks. Implementing a new configuration can take large amounts of time and resources [10]. Several protocols have been proposed to implement SDN [11–14], but OpenFlow (OF) [15] is the industry standard nowadays.
A critical activity in SDN is traffic engineering (TE), which measures and manages network traffic [2]. TE plays an important role in network performance optimization by analyzing real-time traffic, predicting traffic, and designing routing mechanisms to improve network resource utilization [16, 17]. To carry out all these activities, network monitoring is crucial. One of the aspects of good monitoring is the design of network parameters. Network parameters are values that reflect current network status [17]. A widely used parameter to measure network performance is bandwidth utilization, which is sometimes referred to as network throughput.
One of the features introduced by the OF protocol is the use of counters [15]. Counters are maintained for a variety of objects in an OF switch. The introduction of counters enables a more direct approach to collecting traffic statistics. There are basically two approaches for collecting counter values: (1) indirectly using the SDN controller and (2) directly sending specific messages to the switches. The common approach is to use an SDN controller, which usually, in addition to collecting counter values, provides a wide range of configuration and service request APIs.
The starting point for TE in SDN is to collect counters provided by OF devices. These col-lected values enable monitoring tools to measure bandwidth utilization. In recent years, several
2 Chapter1. Introduction
monitoring tools have been proposed to measure bandwidth utilization [18–22]. However, a fine-grained measurement tool that leverages TE is still lacking. A fine-grained measurement provides details of network traffic and can be used as input to more advanced tasks such as finding traffic patterns and trends on routes and links.
OF counters can be retrieved in a streaming fashion. Because large networks usually consist of hundreds of hosts generating a huge amount of traffic, acquiring and processing this stream of data can be very challenging. This scenario strongly suggests the use of Big Data streaming techniques to address this issue because Big Data streaming is characterized by data streams in which data are received as a continuous, infinite, rapid, unpredictable, and time-varying sequence [23].
A significant output of traffic monitoring is a traffic matrix (TM). A TM provides the traffic volume going between any origin-destination (OD) pair of nodes in the network over a specific time interval [24]. This information is essential for several activities in traffic engineering (TE), such as switch load balancing and fault tolerance. For example, if a link fails, a new route between the OD pair affected by this failure needs to be selected among the available routes that connect these nodes. To select the best route, the volume of traffic in each possible route needs to be available for an optimal decision.
Due to the large number of combinations of OD pairs present in large networks, an accurate measurement of the TM becomes a hard task. One of the most significant challenges is the number of links between any pair of OD nodes. As the number of links increases, providing an accurate measurement becomes even harder. The traffic of each link in the path has to be retrieved to aggregate the traffic volume between A and B at a specific time. Collecting link traffic information at the same time is extremely difficult because of the lack of measurement infrastructure [25].
Using the appropriate APIs, an application can retrieve counter values for any switch con-nected to the SDN controller and use them to estimate the TM. However, even when counters had been introduced by the OF protocol, two challenges for TM estimation still remained: i) which approach to use to collect the traffic data (direct measurement or inference techniques), and ii) how to aggregate the traffic values to produce the estimated TM.
3
data are going to be used for batch processing, this aggregation may not pose a challenge, but this is not the case for real-time processing. Due to the volume of data and to time constraints, especially for large networks, this aggregation can be challenging.
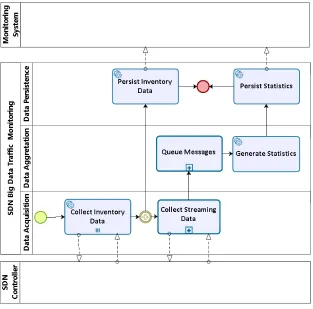
In addition to the traffic monitoring task, the data provided by the OF counters can be used to provide traffic analysis to deliver a wide range of insights about network usage to drive TE activities such asflow management,fault tolerance, andtopology update. Figure. 1.1 provides the design of a TE approach based on Big Data techniques. Two modules compose the TE approach: theBig Data Streamingmodule and theTraffic Engineeringmodule.
Figure 1.1: TE approach based on Big Data techniques.
As previously mentioned, the data coming from an OF switch can be collected in a stream-ing fashion because of the fast changes in the counters due to dynamic traffic crossing the switches. TheBig Data Streamingmodule collects network data and forwards it to process-ing accordprocess-ing to the data purpose (Flow Data, Topology Data, Controller Data, and Traffic data).
TheTraffic Engineeringmodule performs TE activities. TheTraffic Analysis/ Characteri-zationactivity processes the data coming from theBig Data Streamingmodule and performs the trafficMonitoringandAnalysistasks. TheFlow Managementactivity carries out load bal-ance on switches and controllers, the Fault Tolerance activity provides fast recovery in case of component failures, and the Topology Update activity works on network topology update for planned changes. These activities make decisions based on the data provided by theTraffic Analysis/Characterizationactivity.
4 Chapter1. Introduction
in real time. Based on Topology Data and Traffic Data, the proposed method delivers fine-grained measurements of traffic throughput at the flow, port, link, path, and switch levels. ”Fine-grained” means the throughput of every switch, every port in each switch, every link, and every host origin-destination pair. The proposed method provides an approach for on-line TM estimation. To produce all the mentioned measurements a Big Data programming model called MapReduce [6, 7, 27] was used. The counter values collected from the SDN controller were processed by the MapReduce approach to generate the estimated TM for all the OD pairs in the network everytseconds.
This study also proposes a Big Data traffic analysis method (Figure 1.1 (b)). The Big Data traffic analysis method encompasses theAnalysisactivity and theHistorical Datadatabase to process historical data and reveal traffic trends and behaviour. Unlike the Big Data traffic mon-itoring method, the traffic analysis method is based on batch processing because it is expected a large volume of traffic data over time. The proposed method provides switch, switch port, link, and path traffic analysis.
To validate the Big Data traffic monitoring method, this study has provided an implemen-tation following the design guidelines presented in Chapter 4. To validate the Big Data traffic analysis method this study provided an implementation following the design guidelines pre-sented in Chapter 7.
1.1
Motivation
TE is an essential activity for SDN. The good health of the network depends on the activities performed by TE, such as load balancing and fault tolerance. The availability of real-time traffic statistics and historical traffic analysis will leverage TE to adapt to traffic changes and to ensure balanced usage of network resources.
Real-time traffic statistics play an important role in network monitoring for early detec-tion of link and route congesdetec-tion, enabling network administrators to take proactive acdetec-tions to resolve congestion.
The design and implementation of a real-time traffic monitoring method face several chal-lenges due to the need to process large amounts of data. This statement can be confirmed by reviewing a series of previous monitoring methods that usually selected a specific link, switch, and route to monitor.
1.2. Contributions 5
data, which arrive in a streaming fashion while previous data are still being processed. The stored data are then grouped by a predetermined key as they arrive in random order. The de-sired outputs are computed according to the grouped keys. Each one of the previous steps must be addressed by any approach, and in most cases, these approaches are application-dependent. Big Data techniques provide robust and stable tools to tackle the aggregation problem. These tools provide a standardized, but flexible approach that can be used in a wide range of applications that must deal with streaming data and real-time processing. These tools provide a wide range of APIs to deal with different requirements and manage infrastructure horizontal scalability. Using Big Data techniques, large amounts of data can be processed seamlessly, and statistics can be provided in near real time.
The benefits of using Big Data techniques can also be extended to traffic analysis because the same type of aggregation used in traffic monitoring can also be applied to traffic analysis, with the difference being the amount of data. Traffic analysis requires more data because it searches for traffic characteristics such as traffic pattern. Traffic aggregations, as performed in traffic monitoring, are the basis for more advanced calculations.
1.2
Contributions
This research provides the following contributions to traffic monitoring and analysis tasks in the TETraffic Analysis/Characterizationactivity for SDN:
• Big Data traffic monitoring method.
– A novel method for monitoring network traffic based on Big Data techniques is presented. The proposed method defines various processes and a data model. Both the processes and the data model can be implemented using a variety of Big Data tools.
– A fine-grained statistical analysis of network resources, such as the ratio of each port to the switch load and the throughput capacity used on each port, path, and switch, is provided. The deployment of the implementation is presented and pro-vides a roadmap for a distributed environment that can run various Big Data tools.
6 Chapter1. Introduction
approach also produces what is called here theactual TM between all OD pairs. The actual TM is the difference between the currently calculated throughput and the last calculated throughput for each OD pair [18]. This TM enables network managers to keep track of the traffic evolution between any OD pair in near real time.
– A direct measurement infrastructure to collect and process traffic data generated by the OF switches. The Big Data traffic monitoring method shows that direct measurement can be feasible if an appropriate infrastructure is provided, not only for collecting the counters, but also for aggregating the collected data.
• Big Data traffic analysis method.
– A novel method for traffic analysis based on Big Data batch processing is presented. The method establishes the data dependency between the network resource statis-tics and traffic analysis of the resources. The generated traffic analysis can also be used to provide the historical behaviour of the network resources.
The methods proposed in this research work can help network administrators and mon-itoring applications to analyze the behaviour of network traffic and resource utilization. In general, these users perform TE activities to maintain healthy behaviour in the network traffic. The decisions made are based on information about the traffic in the devices and on resource utilization. This information plays a crucial role in decision-making. The more detailed the information, the better is the chance of a good response to an unexpected event. The proposed traffic monitoring and analysis methods provide a detailed view of network traffic and can help to improve both manual and automatic decisions.
1.3. ThesisOrganization 7
1.3
Thesis Organization
This thesis is organized as follows:
• Chapter 2 presents necessary background concepts to understand the scope of the re-search. It starts by presenting a review of software-defined networking and introduc-ing the OpenFlow protocol and the activities of traffic engineering. In sequence, it presents the Big Data concepts used in this research, such as processing of streaming data, MapReduce, and Lambda Architecture.
• Chapter 3 presents an extensive review of research studies related to SDN traffic moni-toring and traffic matrix estimation, which are the main contributions of this thesis.
• Chapter 4 presents the Big Data traffic monitoring method. The activities that compose the monitoring method are presented in detail. The description and definition of the data used to provide the statistics and the algorithms that collect these data are also presented.
• Chapter 5 presents the implementation of the Big Data traffic monitoring method. The SDN controller and the components of the implementation are described, as well as the deployment environment.
• Chapter 6 presents the MapReduce approach to estimating the TM. The approach in-cludes the definition of basic data structures as well as the data collected to estimate the TM.
• Chapter 7 presents the proposed Big Data traffic analysis method. An activity diagram is presented based on the hierarchical data dependency needed to generate the traffic analysis.
• Chapter 8 presents an evaluation of the results obtained by implementing the proposed methods.
Chapter 2
Background
This section presents background concepts used in this thesis. The first section provides an introduction to SDN, describes the OF protocol and the activities of traffic engineering. Sec-tion 2.2 introduces Big Data concepts related to the streaming process and the MapReduce programming paradigm, which is the basis for the solution presented in Chapters 4, 6, and 7. Section 2.2 also introduces the concept of Lambda Architecture, an architectural solution used in Chapters 4, 6, and 7.
2.1
Software-Defined Networking
Current hardware-centric networks pose several operation and management challenges [1, 28]. The core of such a network’s infrastructure contains forwarding devices like switches and routers. These have two logical components for traffic management: the control plane (which decides how to handle network traffic) and the data plane (which forwards traffic based on deci-sions made by the control plane) [3, 10, 29]. This approach makes management of traffic flows very time-consuming especially for large networks, because any new configuration has to be implemented manually in each device. Furthermore, different vendors have their own sets of rules to configure their devices, making the management task even harder.
A new network architecture has been proposed to overcome the problems and limitations of traditional networks. Software-defined networking (SDN) can be defined as ”an emerging architecture that is dynamic, manageable, cost-effective, and adaptable, making it ideal for the high-bandwidth, dynamic nature of today’s applications. This architecture decouples the
network control and forwarding functions enabling the network control to become directly
programmable and the underlying infrastructure to be abstracted for applications and network
services.” [30]. The main idea of SDN architecture is to split the control plane from the data plane (which just does forwarding). One consequence of this approach is that the control logic
2.1. Software-DefinedNetworking 9
is implemented in a logically centralized controller and that network switches simply forward packets. The controller is now programmable, making it possible to establish dynamic routes for network packets. Figure 2.1 shows the deployment of control and data planes in traditional networks and SDN.
Compared with traditional networks, SDN provides the following advantages:
1. Global control. The controller has a global view of the network topology, network status, and application requirements.
2. Programmability and flexibility. The data plane can be dynamically programmed to improve network resource allocation.
3. Openness. Communications between the controller and forwarding devices do not de-pend on the device suppliers.
Figure 2.1: High-level illustration of control and data plane deployment (adapted from [1]).
SDN structure is presented in Figure 2.2. The components are described below [1, 3, 10, 29, 31]:
• Data-Plane Layer. Represents the interconnected forwarding devices. These devices have a set of instructions that specify actions to be taken on incoming packets (e.g., forward to specific ports, forward to the controller, rewrite header, drop temporarily or permanently).
• South-Bound Open APIs. Defines the set of instructions used for interaction between control-plane elements and forwarding devices. These also defines the communication protocol between them.
10 Chapter2. Background
• North-Bound Open APIs. SDN Controllers provide services for applications by means of APIs. These APIs represent the northbound interface.
• Application layer. Applications benefit from decoupling between the control and data planes. They can use the northbound API to implement special purpose operations such as routing, monitoring, and traffic engineering.
Figure 2.2: Basic SDN architecture [2].
A flow, in general terms, is a sequence of packets that traverse the network and that share a set of header field values such as the same source and destination IP addresses, the same VLAN identifier, and the same MAC address [10, 31]. Each new flow needs permission from the controller, which checks the flow against network policy. The SDN controller determines which flows are allowed to go through the data plane. More specifically, the first packet of every new flow is sent to the controller by the data plane to obtain permission to continue in the network and also to obtain its route across all the forwarding devices established.
2.1. Software-DefinedNetworking 11
A distributed architecture shares the control function among several controllers (Figure 2.3). This solves the single point of failure problem and offers the following benefits [31]:
• Scalability. The number of devices that a single controller can manage is limited. Using multiple controllers helps distribute the load.
• Privacy. A set of devices can be assigned to customers who want to implement their own privacy policies. In this case, the controller managing these devices can protect information that customers do not want disclosed.
• Incremental deployment. Dividing device management among several controllers en-ables flexible incremental device deployment.
The distributed architecture introduces the need for controllers to communicate with each other. For this purpose the east and west bound APIs are used. Currently, the implementation is not standardized, and therefore each controller implements its own APIs [3]. The Internet Research Task Force has proposed a protocol called SDNi [34] to exchange information be-tween SDN Domains Controllers. An SDN domain is a set of devices controlled by a single controller.
Figure 2.3: Distributed architecture (Adapted from [3]).
2.1.1
OpenFlow
According to Stallings [31], to implement an SDN, two requirements must be met:
• A common logic architecture must be present in all network devices managed by the controller. Even if different vendors implement this logic in different ways, the controller must see a set of uniform functions.
12 Chapter2. Background
OpenFlow has met these requirements by providing a specification of the logical format of network switching functions and also by being a communication protocol between con-trollers and devices. The OpenFlow architecture consists of switching equipment managed by an OpenFlow controller (Figure 2.4). OpenFlow is defined by theOpen Networking Founda-tion(ONF) in theOpenFlow Switch Specification[5].
Figure 2.4: Basic OpenFlow architecture (Adapted from [4]).
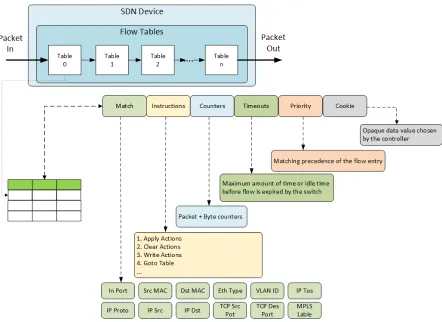
The main activities of an OpenFlow switch are based on a flow table. In cases where more than one flow table exists, they are organized as a pipeline (Figure 2.5). A flow table consists of flow entries and each entry has six parts (Figure 2.5).Matchfields are used to match against incoming packets and consist of the ingress port and packet headers. Instructionsmodify the action set of pipeline processing. Countersare updated when packets are matched. Timeouts specify the maximum amount of total time or of idle time before a flow is expired by the switch. Priorityis used for matching precedence of flow entries. Cookie is the opaque data value chosen by the controller. The controller can use Cookie to filter flow statistics, flow modifications and flow detection.
Every flow table must accommodate a table-miss flow entry. This entry specifies the action in case a packet does not match any of the entries in the table. In this case, the packet can be forwarded to the controller, dropped, or directed to a subsequent table. The table-miss entry has basically the same behavior as any other flow entry. It is not included by default, and the controller can add or remove it at any time.
2.1. Software-DefinedNetworking 13
Figure 2.5: OpenFlow device.
specific entry in a flow table [31].
The Instruction part is a set of instructions that is applied to all matching packets. With these instructions, it is possible to modify the state of a packet, direct the packet to a specific port, forward the packet to another table, and pass metadata across the pipeline. Each packet is associated with an action set, which is a list of actions that are stored while the packet is processed by each table and executed when the packet leaves the pipeline. Actions can drop, modify, queue and forward packets [5].
When the device receives a packet, it proceeds in the following way [5, 31] (Figure 2.6):
1. Perform a table lookup in the first flow table, trying to find the highest-priority match. In case there is no match and no table-miss entry, the packet is dropped. In case of a match only on a table-miss entry, one of three procedures is specified:
(a) Forward the packet to the controller. In this case, the controller can create a new flow for this packet or simply drop it.
(b) Forward the packet to another flow table in the pipeline.
14 Chapter2. Background
2. In case of a match on one or more entries, the match selected is the one with the highest priority value. The procedures specified for this case are:
(a) Update counters.
(b) Execute the instruction present in this entry. This instruction may update the action set, update metadata, and execute actions.
(c) Forward the packet to a table in the pipeline or to an output port.
3. If the packet is sent to an output port, the action set is executed, and the packet is queued for output.
Figure 2.6: Packet flow through an OpenFlow switch [5].
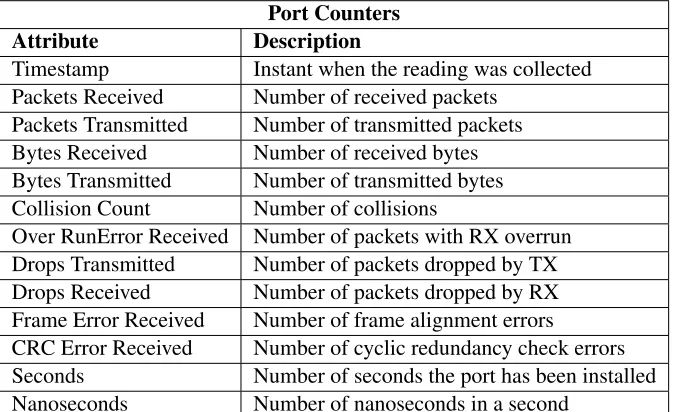
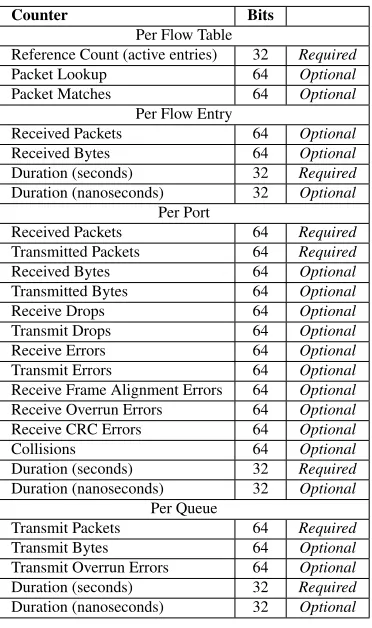
Counters are an important component of a flow table. They are available for each flow table, flow entry, port, queue, group, etc. The OpenFlow 1.4 specification defines a set of counters, but a switch is not required to support them all (Table 2.1).
The scope of this research is located in the application layer (Figure 2.2), more specifically in traffic engineering. The next section provides an overview of this application.
2.1.2
Tra
ffi
c Engineering
2.1. Software-DefinedNetworking 15
Counter Bits
Per Flow Table
Reference Count (active entries) 32 Required
Packet Lookup 64 Optional
Packet Matches 64 Optional Per Flow Entry
Received Packets 64 Optional Received Bytes 64 Optional Duration (seconds) 32 Required Duration (nanoseconds) 32 Optional
Per Port
Received Packets 64 Required Transmitted Packets 64 Required Received Bytes 64 Optional Transmitted Bytes 64 Optional
Receive Drops 64 Optional
Transmit Drops 64 Optional Receive Errors 64 Optional Transmit Errors 64 Optional Receive Frame Alignment Errors 64 Optional Receive Overrun Errors 64 Optional Receive CRC Errors 64 Optional
Collisions 64 Optional
Duration (seconds) 32 Required Duration (nanoseconds) 32 Optional
Per Queue
Transmit Packets 64 Required Transmit Bytes 64 Optional Transmit Overrun Errors 64 Optional Duration (seconds) 32 Required Duration (nanoseconds) 32 Optional
Table 2.1: List of counters.
SDN traffic engineering can benefit from SDN characteristics to help solve its problems, which can be divided into flow management, fault tolerance, topology update, and traffic anal-ysis and characterization [2]. Each of these topics presents several issues, including the ones depicted in Figure 2.7.
According to the basic operation of packet flow management described in Section 2.1.1, if a packet does not match any entry in the flow table other than the table-miss, this packet can be directed to the controller. This is usually the case for the first packet of every new flow [3]. In this case, the controller sends a forwarding entry to be installed in the flow table so that all subsequent packet of this flow can be forwarded without interacting with the control plane. If the network traffic presents a high number of new flows, significant overhead can result in the controller and in the data plane. The flow management component of TE should address this issue by balancing the load between switches and controllers.
16 Chapter2. Background
Figure 2.7: Scope of traffic engineering [2].
new entries will be added to the flow table of the affected switches.
The topology function update manages planned changes such as updating network policy rules instead of component failure. The controller dynamically configures the new global pol-icy rules. This task must maintain the consistency of polpol-icy rules across switches because during this update, packets may be handled by different rules in different switches. Moreover, during the update, some packets may be dropped or delayed, causing poor network perfor-mance. Updating topology is even harder for a large network because it must be accomplished in near real time.
Traffic analysis plays an especially critical role in detecting network or link failures and predicting link congestion or bottleneck. Monitoring tools are the basic elements of this critical task. To achieve good monitoring, three aspects are important [17]:
1. Network parameter design and monitoring technologies
• Network parameters are values that reflect current network status. The choice of these parameters is a precondition for good network management. Three types of parameters are essential for monitoring: i)Network topology parameters represent the number of nodes, link bandwidth, connections structures, and port status; ii) Network trafficparameters represent the number or speed of the packets that cross forwarding devices; and iii) Network performance parameters represent per-flow metrics such as throughput, delay, packet loss, etc. [19].
2.2. BigData 17
• Several SDN measurement systems use traditional IP network traffic methods, ran-domly sampling local packets to obtain traffic statistics.
3. Traffic analysis and prediction
• The goal is to identify anomalous traffic and analyze the possible presence of net-work congestion. The data provided will help improve traffic scheduling and man-agement.
This thesis focuses on monitoring technologies, generic measurement framework and traffic analysis.
2.2
Big Data
The term Big data refers to various types of large and unstructured datasets that cannot be processed with conventional data processing systems in a reasonable time [37]. Size is the first characteristic used to understand big data [38], but it is not the only one. Laney [39] suggested three dimensions to characterize big data: Volume, Variety, andVelocity(Three V’s). Volume refers to the huge amount of data produced by applications. Variety relates to the presence different data formats in a dataset. Different technologies enable the use of structured data (spreadsheets, relational databases), unstructured data (text, images, audio, video), and semi-structured data (XML). Velocity refers to the speed at which data are generated and analyzed. In addition to these three dimensions, other V’s are also associated with big data: Veracity, Variability, andValue[38]. Veracity (introduced by IBM) refers to the presence of imprecise and uncertain data in some sources. Variability refers to the different flow rates of data. Value (introduced by Oracle) expresses the concept that data received in their original form generally presents low value relative to their volume.
2.2.1
Processing of Streaming Big Data
Batch and real-time are two types of data processing for big data. Choosing the more suit-able type of processing for a specific application depends on the type and sources of data, the processing time needed, and whether immediate action is required [40]. Real-time processing involves continuous input, processing, and output of data and is needed when immediate action must be taken based on the processed data.
18 Chapter2. Background
and financial transactions. For these types of applications, response time and throughput are critical. This means that most streaming Big Data applications have real-time requirements.
According to Stankovic et al. [41] there are eight misconceptions in real-time data man-agement, of which one of the most important is ”real-time computing is fast computing”. Fast processing does not mean that real-time constraints are satisfied. Moreover, the meaning of ”real-time processing” depends on the application. For some applications, real time means milliseconds, whereas for others, it means microseconds [42].
According to Shahrivari [43] the term ”real-time” in Big Data is more related to interactivity than to millisecond response. Real-time query processing in a Big Data environment should return results in the order of seconds or minutes, as opposed to batch jobs that usually finish in hours or days.
The monitoring method proposed in this thesis provides results in order of seconds, and, therefore it can be considered as providing monitoring results in real-time.
2.2.2
MapReduce
MapReduce is a programming paradigm for processing large volumes of data [6, 27, 44] in parallel. The idea behind MapReduce is to distribute the data and the processing among several nodes for horizontal scalability. According to the name, the MapReduce model contains two phases:
• Map phase. In this phase, multiple map jobs read blocks of data and process them to produce key-value (hK,Vi) pairs. Several map jobs can be executed to generate interme-diatehK,Vipairs.
• Reduce phase. In this phase, reducer jobs read thehK,Vipairs generated from multiple map jobs and aggregate or group them by key, producing the final output.
In the MapReduce flow (Figure 2.8), the data to be processed are first divided into splits, and the master node assigns these splits to map workers’ nodes. Each worker processes its own splits to generate intermediate files withhK,Vipairs. The reduce workers, driven by the master node, process the intermediate hK,Vipairs according to their reduce functions to provide the final output.
Figure 2.9 shows how to perform a word count on a sequence of words using MapReduce. The goal is to find and count the number of occurrences of unique words in the sequence.
2.2. BigData 19
Figure 2.8: MapReduce flow [6].
the tuples with the same key to the corresponding reducer (R1...R4). Now each reducer has a list of unique keys with their corresponding values and adds all the values to get the final result. The final result is provided in the output file.
Figure 2.9: MapReduce example (Adapted from [7]).
20 Chapter2. Background
whereas Spark keeps them in memory. This difference suggests the use of Hadoop for batch processing and Spark for real-time processing. Spark can also be used for stream processing using a framework called Spark Streaming. Spark streaming processes stream data in batches, where every batch contains the messages that arrived over the previous micro-batch period. Spark and Spark streaming processing are the basis of the MapReduce approach presented in this research.
2.2.3
Lambda Architecture
The Lambda Architecture (LA) is a Big Data system composed of a series of layers [8]. The idea behind the LA is to build a system that can process and produce different views of the data. A system built based on the LA can process stream and batch data. The LA consists of three layers: the speed layer, the batch layer, and the serving layer, as shown in Figure 2.10.
The speed layer receives a stream of data, processes them, and updates the real-time views. The speed layer performs incremental processing, does not keep historical records of the data, and processes the incoming data using stream processing platforms. In contrast, the batch layer repeatedly processes all the available data in the master dataset. Hence, when a batch job starts, the entire set of data in the master dataset will be reprocessed. The idea is that the next job will automatically process the data that do not arrive on time to be processed by the current job. As a result, each batch job replaces all the batch views. The serving layer stores the views produced by batch processing on the master dataset. The query processor collects data from the real-time and batch views to reply to users’ queries.
The speed layer and the batch layer have different processing requirements, i.e. the speed layer processes a small amount of data with quick response, whereas the batch layer processes a large amount of data (historical data) with slower response. Consequently, they require dif-ferent technologies to match their processing requirements. The serving layer demands tech-nology for storing a large volume of data and producing a quick response to users’ queries. The LA, being a design for Big Data processing, allows the use of various processing and storing technologies.
2.3
Summary
2.3. Summary 21
Figure 2.10: Lambda architecture (Adapted from [8]).
Chapter 3
Literature Review
This chapter presents research studies related to this thesis, which are divided into two cate-gories: Traffic monitoring and Traffic matrix estimation.
3.1
Tra
ffi
c Monitoring
For traditional IP networks, monitoring techniques such as NetFlow [45] and sFlow [46] are available. NetFlow, developed by Cisco, delivers statistics about individual IP flows by main-taining a flow cache that tracks statistics for each flow. It provides detailed data about each flow, such as source and destination IP addresses, byte count, packet count, and port number. sFlow uses time-based sampling to estimate the number of packets and bytes in each flow by multiplying the number of sampled packets and bytes by the sampling ratio.
Many traffic monitoring tools have been proposed for OpenFlow networks. OpenNet-Mon [19] was developed to determine whether end-to-end QoS requirements are met and to enable TE applications to compute appropriate paths. It is implemented as a module inside the SDN controller and polls edge switches to collect flow statistics at an adaptive rate to determine throughput, packet loss, and delay. OpenNetMon uses an adaptive rate for switch polling.
FlowSense [47] proposed a passive monitoring method by which the network informs the application of performance changes instead of polling the switches on demand. To achieve a low communication overhead, FlowSense uses PacketIn and FlowRemoved messages to estimate per-flow link utilization. FlowSense works best in networks with small flows.
Lavanya et al. [48] proposed a measurement framework where OF switches match packets against a small set of rules and update the counters for the highest-priority match. These rules are dynamically updated by the controller to identify large traffic aggregates quickly. Their solution programmed the switches to handle all incoming packets, to reduce controller overhead.
3.1. TrafficMonitoring 23
Planck [49], which is a network measurement architecture, used port mirroring to collect network traffic information at 280µs-7ms timescales on a 1 Gbps commodity switch and 275µ s-4ms timescales on a 10 Gbps commodity switch. Port mirroring enables traffic monitoring by replicating the traffic going to an output port to a designated monitor port. Planck configured the switch such that the traffic going to multiple output ports was replicated to each monitor port and was used to drive a TE application to reroute congested flows in milliseconds.
Chowdhury et al. [50] proposed Payless, a monitoring framework for SDN. Payless was designed to use the OpenFlow controller’s northbound API to collect flow statistics from the controller. To avoid continuous polling of switches for traffic statistics by the controller, Payless proposed a flow statistics collection algorithm that polls the switches at variable frequency. Payless sends, on average, 6.6 monitoring messages per second, in contrast with 13.5 messages per second for periodic polling. This algorithm achieves accuracy as high as continuous polling with lower network overhead. Furthermore, Payless provides a RESTful API for developing network monitoring applications. This API provides interfaces for collecting flow statistics at different levels (flow, packet, and port). The overhead imposed by Payless is low compared to controller overhead.
OpenSample [51] leverages sFlow packet sampling to provide near real-time measurements of both network load and individual flows. OpenSample captures packet header samples and uses TCP sequence numbers from these packets to reconstruct flow statistics. At the same time, OpenSample uses the packet samples to estimate port utilization.
OpenSketch [52] proposes a three-stage data plane pipeline for SDN. A measurement li-brary for automatic data plane configuration is built. This lili-brary enables the development of new stream algorithms to monitor flows in commodity switch components.
An available bandwidth measurement application was proposed by Megyesi et al. [18]. Their application can travel the network topology and track bandwidth utilization over net-work links. As a result of this procedure, the application can calculate the available bandwidth between any two points in the network. By periodically polling the SDN controller, the appli-cation can calculate the current load on each link.
24 Chapter3. LiteratureReview
in a NoSQL database.
Sinha et al. [53] proposed an on-line per-flow and per-port monitoring and measuring ap-proach to provide packet loss statistics in SDN. This study included experiments that monitored flows between two pairs of origin-destination hosts, unlike the present study that monitors traf-fic between all host origin-destination pairs in the topology.
Su´arez-Varela and Barlet-Rois [54] presented a scalable flow-based monitoring solution for OF switches like NetFlow/IPFIX. Two sampling methods were designed to reduce both controller overhead and the number of entries in the flow tables. One basic difference between their solution and the present one is that the approach proposed here monitors ports instead of flows and does not use sampling methods.
SDN-Mon [55] was developed to monitor flows and free the controller from monitoring activity, enabling the controller to insert more general forwarding rules with wildcards in the switch. SDN-Mon contains two modules: a controller-side module, and a switch-side module. The controller-side module enabled flexible monitoring in the SDN controller. The switch-side module provided components to handle the monitoring functionality in the switches.
Su´arez-Varela and Barlet-Rois [22] presented a flow monitoring and classification solution for OF switches. Their flow monitoring system uses a sample-based approach. A set of entries are installed in the switch to enable identification of the traffic to be sampled. When a packet arrives in the switch, a match operation is performed to check whether the packet is in one of the per-flow monitoring entries. If it matches, the packets and byte counters are updated. Su´arez-Varela and Barlet-Rois [56] also presented an alternative monitoring method based on matching on ports for switches with no support for IP masks with suffixes. Their method consisted of installing a set of entries in the switch to enable direct discrimination of the traffic to be sampled. Consequently, only the first packets of these flows are sent to the controller, and the controller installs reactive specific flow entries to sample these flows.
Hartung and K¨orner [57] proposed SOFTmon, a traffic monitoring application that could provide charts and statistics up to flow level. SOFTmon supports flow monitoring only for the network layer, which means that a flow needs to have valid IPV4 entries in the source and destination addresses as well as Ethernet source and destination addresses to become a selectable item in SOFTmon.
Hendriks et al. [58] also used a per-flow statistical measurement approach. They evaluated the quality of measurements of OF devices from multiple vendors to show that it was imprac-tical to deploy the OF device measurement-based approach in a network containing devices from multiple vendors.
3.1. TrafficMonitoring 25
packet sampling, finds suspiciously large flows. The counting stage uses the flow table count-ing method to determine the truly large flows among the suspicious ones.
Afek et al. [60] developed a packet sampling mechanism and algorithms to detect large flows with a good and practical trade-offbetween switch and controller traffic. Their paper presented various methods to sample packets in an SDN switch that could be used indepen-dently of the large flow detection algorithm. The sample methods define the rate for creating counting rules in the switches and the rate for sampling packets from the switches.
Tahaei et al. [21] proposed an architecture to pull statistics using local controllers and for-ward them to an upper-layer application to aggregate counters and model a universal flow measurement in the network. According to their design, several controllers connect to the OF devices, and these controllers install wildcards for all requested flows in a single group. After-wards, aggregated pull requests are used to collect statistics and send them to a coordinator for aggregation of network traffic.
Frunza et al. [61] developed and implemented a monitoring tool for SDN. Their monitoring station is not part of the SDN topology, i.e., it does not connect to the SDN controller, but rather is part of a traditional TCP/IP network. The monitoring station sends requests for statistics messages directly to the OF switch and receives the requested data through a tunnel. In this case, the monitoring station is acting as an SDN controller in the sense that the sent messages are OF messages and not API messages.
Rezende et al. [62] proposed SDNMon to monitor the data plane and to improve topology information at the control plane. The goal of SDNMon is to provide bandwidth and latency at two granularity levels, Per-Portand Per-Flow. SDNMon is implemented as an extension module of the SDN controller. Based on the network topology, SDNMon exploit threads to collect selected port and flow statistics and uses two monitoring approaches: (i) the sFlow pro-tocol and (ii) a polling mechanism. SDNMon enables the implementation of other monitoring approaches through aMonitoring Interface.
Cheng et al. [63] proposed a compressive traffic monitoring method to collect real-time load information on network links in hybrid SDN. The idea behind their proposal was to col-lect the traffic information for a small subset of essential links and then to estimate the traffic information for the remaining links. They initially showed that traffic information in all links could be represented by what they called basic links. They created a method to identify the basic links in a network. Once the basic links had been identified, the next step was to connect the basic links to SDN switches and collect their traffic information from the SDN controller.
26 Chapter3. LiteratureReview
that discovers the network topology, (ii) a monitoring module that, based on the network topol-ogy provided by the previous module, monitors the bandwidth and link delay of each network link, and (iii) a scheduling module that, based on the statistics collected by the monitoring module, performs multi-path routing of delay-sensitive traffic based on QoS metrics.
Shen [65] proposed a monitoring application, called SDN-monitor, to monitor selected OF switches with the aim of reducing resource consumption. His solution provides an algorithm divided into two phases. The first phase, the monitoring point selection phase, selects the switches to monitor by scanning all switches in the network and counting their flows. The algorithm sorts the switches in descending order according to their number of flows. Iteratively, the algorithm selects the switches with the highest number of flows, which collectively cover more flows. At the end of this process, the algorithm removes the covered flows from the unselected switches. The second phase, the flow re-routing phase, tries to combine the switches with the lowest re-routing cost to re-route the flows covered by the selected switches.
Wang and Su [66] proposed FlexMonitor, a flexible monitoring framework. FlexMonitor was implemented as an SDN controller module and contains four modules. The first module interprets requests from the upper applications and chooses an appropriate monitoring strategy based on application needs. The second module carries out monitoring tasks by deploying specific monitoring strategies in the network. The third module collects monitoring data from the network or hosts using various monitoring approaches. The last module aggregates the raw monitoring data coming from the previous module. FlexMonitor provides the following monitoring strategies: switch selection, OD host pair selection, and event definition.
Madanapalli et al. [67] designed and implemented a solution for detecting and monitoring elephant flows. Their solution contains three stages, of which the first one monitors traffic flows. The traffic flow monitoring stage is designed to be a ”bump-in-the-wire”1 on the mon-itored link. A software inspection engine receives the packets that need to be inspected, thus protecting the SDN controller from overload, and the software inspection engine performs link monitoring.
Cohen and Moroshko [68] proposed a sampling-on-demand monitoring framework that enables the SDN controller to establish the sampling rate of each flow at every switch. The network operator sets this rate according to the monitoring goal. The proposed framework consists of three components. The first component, the Sampling Management Module, is deployed as an SDN controller module. The OF switches host the second component, which is theSampling Module. The third component is aCollecting Serverlocated in the network to collect and process the sampled packets. Their framework defines a new OF message called
3.1. TrafficMonitoring 27
OFPT RATE MOD, which is sent by theSampling Management Moduleto the switches. This message informs the switch of the sampling rate for each flow. TheSampling Moduledeployed in the switches samples the flows based on the specified rate, and theCollecting Servercollects and processes the sampled packets.
Wang et al. [69] proposed Woodpecker, a system to detect and mitigate link-flooding attacks in SDN. To locate congested links, Woodpecker installs flow rules as measurement triggers in the OF switches. When a packet crosses the OF switch, the counters are updated, and the switch computes the byte rate of some specified flows based on the counter values. When the flow values activate the triggers, the switch sends a message to the controller.
Tsai et al. [70] proposed an adaptive flow measurement method to monitor SDN-based cellular core networks. Their proposed method starts observing the appearance and expiration of flows, and a table keeps track of the active flows. The next operation groups flows by their polling frequency, which can be set to static or dynamic. A log collector sends queries to collect flow status at a specific polling frequency and stores the retrieved data in a database. Lastly, a flow analyzer arranges and processes the stored data to provide useful information.
Tangari et al. [71] presented a self-adaptive and decentralized framework for resource mon-itoring in SDN. The framework defines a set of Local Managers (LMs), distributed over the network, with each LM monitoring a set of OF switches using theMonitoring Module(MM). Monitoring applications use the MM to add new monitoring requirements and to receive the measurement results. The MM uses a self-tuning adaptive monitoring approach to collect statistics from the switches. The goal of adaptive monitoring is to achieve a good trade-off be-tween accuracy and resource consumption by continuously adapting the timeT, i.e., the time between two consecutive measurements. The MM also stores the collected data in RAM and a database and provides a synchronization interface for the LM exchange messages.
CA Technologies [72] and ExtraHop [73] provide commercial SDN monitoring systems. The description of the features of their products provides a list of functionalities briefly high-lighting some of the main monitoring components of the applications. The available documen-tation does not provide enough details to perform a comparison on how their products collect and generate the statistics on network resource utilization.
28 Chapter3. LiteratureReview
performed in a variety of distinct ways. One of the main problems with this approach is the paucity of the results provided. The proposed algorithms cannot deliver monitoring at a fine-grained level, and the results do not provide many insights into network performance. Usually, one specific value is provided, such as throughput, link delay, or packet loss.
To overcome these problems, this research study has proposed a novel method for monitor-ing network traffic based on Big Data techniques. The proposed method establishes a process to collect counter data, store and process them to produce network statistics, and persist the obtained statistics.
One of the main benefits of Big Data techniques is that, unlike previous efforts that usually selected the resources to be monitored, the proposed approach focusses on collecting statistics from all active devices in the network. In this differentiated approach, once these statistics have been collected, a fine-grained statistical analysis of network resources, such as the ratio of each port to the switch load and the throughput capacity used on each port, path, and switch, is provided. This route-level aggregation provides an estimate of the network traffic matrix. All these throughput utilizations are estimated every three seconds; no other method has proven to be able to provide this information within this time constraint. Big Data streaming processing tools are used to provide near real-time statistics, which, to the best of our knowledge, is the first attempt to use this technology to generate this aggregation level.
This research study also identified that the values generated by previous monitoring appli-cations were not used for traffic analysis, which provides a variety of information that can help to identify problems such as traffic congestion and trends. This research study also proposes a novel method for traffic analysis based on Big Data batch processing to scrutiny network resources utilization based on historical data.
3.2
Tra
ffi
c Matrix Estimation
For traditional IP networks, several approaches have been used to estimate TM. Soule et al. [74] created a state space model to capture temporal and spatial correlations between a pair of hosts and Kalman Filters used to estimate and predict TMs. Xie et al. [75] proposed a Sequential Tensor Completion algorithm (STC) to recover missing Internet traffic data and also proposed a Reshape-Align scheme [25] to reshape inconsistent traffic matrices and align these matrices to form a tensor. Papagiannaki et al. [26] proposed a distributed measurement scheme based on limited use of flow measurement data and discussed the topic of traffic matrix estimation using direct measurement. They outlined the computation, communication, and storage overheads to generate traffic matrices at different granularity levels.
3.2. TrafficMatrixEstimation 29
the concept of flowset(an arbitrary set of flows) to overcome the scalability challenges faced when measuring a large number of flows. ProgME can dynamically re-program the definitions of flow set based on user queries and can derive the traffic matrix. Guo et al. [77] proposed a framework to optimize the routing over multiple TMs in a hybrid SDN network. The basic idea was to cluster historical TMs and calculate the weight coefficient of every representative TM. After the weight coefficient calculation, an expected TM was calculated that combine the representative TM and the optimized OSPF weights over the expected TM.
The OF specification defines some flow counters that can be used to increase the accuracy of the TM estimate. Tootoonchian et al. [78] presented OpenTM, a traffic matrix estimator for OF networks. OpenTM was implemented as an application for the SDN controller to monitor active flows by polling the switches periodically. Their work also explored different algorithms for choosing which switch to query.
Yu et al. [79] proposed DCM, a per-flow monitoring system. DCM is based on bloom filters [80] and uses three steps to process packets in the data plane. The first step matches a packet with a wildcard monitor rule. The second step, called the admission bloom filter, represents the set of flows to be monitored, but does not have wildcard rules. The last step determines the corresponding monitoring actions for the flows in the admission bloom filter.
Polverini et al. [81] addressed the improvement of traffic matrix estimation. They developed a valid criterion based on the flow spread parameter, which is a way to find a subset of traffic to be measured to improve TM estimation. The flow spread parameter was used to characterize the weight of each flow traffic measurement in the TM estimation enhancement. Polverini et al. [82] also investigated an approach in which OF switches were introduced into a traditional IP network to understand how the new capabilities of these OF switches affected traffic matrix estimation. Their work showed that enhanced estimation accuracy was obtained by introducing only a few OF switches performing simple tasks.
Tian et al. [83] proposed a new framework for TM estimation in an SDN-based Ip network. Their work shows that if a flow’s traffic can be derived from other flows in the network, adding a new entry for this flow for traffic measurement does not provide new information about the TM. Consequently, their traffic measurement scheme guarantees that when a controller selects a source-destination flow for measurement, the traffic for this flow cannot be derived from the existing flows in the flow table, improving the efficiency of the flow table.
![Figure 2.2: Basic SDN architecture [2].](https://thumb-us.123doks.com/thumbv2/123dok_us/1906320.1249719/22.612.162.431.207.410/figure-basic-sdn-architecture.webp)
![Figure 2.4: Basic OpenFlow architecture (Adapted from [4]).](https://thumb-us.123doks.com/thumbv2/123dok_us/1906320.1249719/24.612.167.428.173.420/figure-basic-openflow-architecture-adapted-from.webp)
![Figure 2.6: Packet flow through an OpenFlow switch [5].](https://thumb-us.123doks.com/thumbv2/123dok_us/1906320.1249719/26.612.162.428.270.470/figure-packet-ow-openflow-switch.webp)
![Figure 2.9: MapReduce example (Adapted from [7]).](https://thumb-us.123doks.com/thumbv2/123dok_us/1906320.1249719/31.612.98.539.76.291/figure-mapreduce-example-adapted-from.webp)
![Figure 2.10: Lambda architecture (Adapted from [8]).](https://thumb-us.123doks.com/thumbv2/123dok_us/1906320.1249719/33.612.203.427.68.356/figure-lambda-architecture-adapted-from.webp)