PRACTICAL ALGORITHMS TO FOCUS B-SCAN GPR IMAGES: THEORY AND APPLICATION TO REAL DATA
C. Ozdemir, S. Demirci, and E. Yigit
Department of Electrical-Electronics Engineering Mersin University
Ciftlikkoy, Mersin, 33343, Turkey
Abstract—It is well known in B-scan ground penetrating radar (GPR) imagery that the underground scatterers generally exhibit defocused, hyperbolic characteristics. This is mainly due to the data collection scheme and the finite beam width of the main lobe of the GPR antenna. To invert this undesirable effect and obtain focused images, various migration or focusing algorithms have been developed. In this paper, we survey the performance of our recent focusing algorithms, namely; hyperbolic summation (HS) and frequency-wavenumber (w-k) based synthetic aperture radar (SAR) focusing. The practical usage of these focusing methods were tested and examined on both simulated and measured GPR data of various buried targets. The simulation data set is obtained by a physical optics shooting and bouncing ray (PO-SBR) technique code. Measurements were taken by a stepped frequency continuous wave (SFCW) radar set-up. Scattered C-band field data were measured from a laboratory sand box and from outdoor soil environment. The proposed focusing methods were then applied to the B-scan GPR images to enhance the resolution quality within these images. The resultant GPR images obtained with the proposed algorithms demonstrate enhanced lateral resolutions.
1. INTRODUCTION
positions on a straight scan by moving the antenna(s) on top of the ground surface and looking downward. During this process, a transmit-receive phenomenon occurs at each of these observation positions and then the recorded data is combined to produce a two-dimensional (2-D) space-time GPR image.
In a typical B-scan image, the scatterers manifest themselves as hyperbolic curves and therefore, depict undesired lowresolution features. The reason of having hyperbolic signatures is due to the fact that data is collected by a finite beam-width antenna while moving along a straight path. Such an image construction may be sufficient when the aim is only to detect the targets. In most situations; however, the indicative information about the location, shape, and size of the targets is required [2]. Therefore, the hyperbolic behaviors in these GPR images are often desired to be translated to focused, localized signatures. Various focusing or migration techniques have been developed to solve this problem and therefore to increase the spatial resolution of GPR images [3–7]. These are; diffraction summation [3], phase-shift migration [4], finite-difference migration [5], Kirchhoff wave-equation migration [6] and frequency-wavenumber (f
-k) migration [7]. These methods were generally originated from seismic imaging and have been widely used for the focusing of GPR data.
Synthetic aperture radar (SAR) based focusing techniques [8– 10] have also been applied to GPR data in recent years [11–13]. Among these, the frequency-wavenumber (w-k) domain SAR focusing method [8] was derived from the seismic basedf-kmigration and has been essentially used for the focusing of SAR data [9]. Because of the similarity of data recording scheme between GPR and SAR, it has been shown that GPR data can also be focused by using this type of a SAR-based method. In [11], for example, the method is compared with the original seismic based f-k method for real GPR imageries. In [12, 13] the method is applied to different real GPR images to increase the cross-range (or horizontal) resolution.
For a specific GPR application (type of radar, homogeneity of the medium, frequency, antenna type etc.), the appropriate migration method has to be selected and tested on the real data. In this paper, we investigate the performance of our recent GPR focusing methods namely, the Hyperbolic Summation (HS) [14], and w-k
focusing technique [13] uses two-dimensional (2-D) Fourier transforms of the data and involves Fourier space interpolation. We apply and test these methods on the B-scan GPR images of various buried metallic objects. The resultant focused images are presented by evaluating the strengths and advantages of each algorithm.
The paper is organized as follows. In the next section, we shortly reviewrelated imaging techniques used in GPR systems. In Section 3, the procedures of the focusing methods are explained and their brief formulations are given. Then, the simulation and measurement results are presented in Section 4 for comparison. The simulated output images and measured output images from indoor laboratory and outdoor soil environment are presented in this section. Additionally, the output focused images are compared and the applicability of each method is discussed. In the final section, work is concluded and some issues regarding the effectiveness of both methods are discussed.
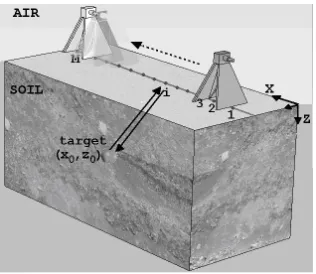
Figure 1. Geometry of monostatic GPR problem.
2. IMAGING TECHNIQUES IN GPR SYSTEMS
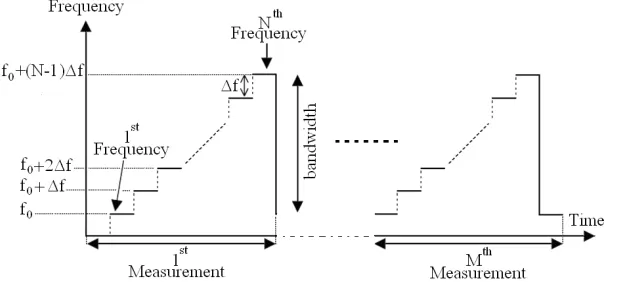
with frequency increments of ∆f, the frequency of thenth sample in the received array is found as;
fn=f0+ (n−1)·∆f n= 1,2, . . . , N (1)
In the A-scan process, the back-scattered electric field signal of a point scatterer which has ad distance from the origin is given in frequency domain as;
ES(f) =ρ·exp
−j4πfn v d
n= 1,2, . . . , N (2)
where v is the velocity of the EM wave in the propagation medium and ρ is the complex amplitude of the scattered electric field of the point target. For a homogeneous and lossless medium, it is obvious thatv=c/√εr, wherecis the speed of the light and εr is the relative electric permittivity of the medium. This signal can also be represented in terms of the wavenumber kas;
ES(k) =ρ·exp(−jk(2d)) (3)
wherek is a wavenumber vector and is given byk= 2πf /v.
Figure 2. Implementation of a SFCW radar.
In order to obtain the 2-D position information of the targets, a B-scan has to be performed. This is achieved by collecting a series of A-scan on a horizontal survey line of the earth surface as illustrated in Figure 1. When the radar antenna moves along a synthetic aperture
X, the magnitude and the phase of the EM scatterings are recorded at each discrete point in the synthetic aperture. 2-D B-scan rawdata is usually acquired in frequency domain and therefore is represented as
3. GPR FOCUSING ALGORITHMS
In this section, we present the brief review of HS andw-kdomain SAR focusing algorithms that we developed recently [13, 14].
3.1. Hyperbolic Summation (HS) Focusing Algorithm
This method is based on the knowledge that a point scatterer in a constant-wave-speed (homogeneous) medium produces a hyperbolic pattern in the space-time domain. To invert this process, it is desired to collapse this hyperbola onto a single point in the spatial domain (horizontal distance as a function of depth). Since the recorded data
ES(x, f) relies on the frequency domain, the 1-D Inverse Fourier Transform (IFT) can be readily applied to transform the data into an image in the space-time domain. Assuming that antenna is very close to air-ground surface and the ground medium is homogeneous, the space-time GPR data can easily be converted to space-space GPR data by applying the simple time-space translation formula z = v·t. Here,v is the velocity of the medium, tis time andz is depth. Under these assumptions, for a position of the antenna at some location in synthetic apertureX, the distance from the antenna to a buried object located at (x0, z0) can be found via the Pythagorean theorem as;
Z =
z2 0+
X−x2 0
(4)
This is in fact the equation of a hyperbola along theZ-axis. The actual location of the object is at the apex of the hyperbola. Noting that a B-scan GPR image is composed of the summation of finite number of hyperbolas that correspond to different point scatterers, it is possible to resolve these points by applying the steps in [14]. The resulted imaging equation which maps a hyperbola in the original image into a focused data point at (xi, zi) is given in terms of the root-mean-square (rms) value as follows;
{rms@(xi, zi)}=
|ES(x)|2.ES∗(x)2
M =
1 √
M
M
m=1
|ES(x)|2 (5)
3.2. Frequency-Wavenumber (w-k) Domain SAR Focusing Algorithm
We consider the 2-D scanning geometry of Figure 1 where the antenna moves along aX synthetic aperture. Then, the received E-field for P
point targets each with an associated reflectivity and located at (xi, zi) can be written from Eqn. (3) as follows;
ES(x, w) = P
i=1
ρie−j2
w v
√ z2
i+(x−xi)2 (6)
Here, frequency f in Eqn. (3) is replaced with w = 2πf for the convenience of nomenclature. Applying 1-D Fourier Transform (FT) to
ES(x, w), from spacexto spatial frequency (Doppler wavenumber)kx, the w-k domain representation of the scattered data can be obtained as follows;
E(kx, w) = P i=1 ρi ∞ −∞
e−j2wv
√ z2
i+(x−xi)2ejkxxdx (7)
Then, by interpolatingES(kx, w) onto akx−kz mesh, 2-DES(kx, kz) data is acquired. Afterwards, the finalized focused GPR image can be obtained by transforming the data from (kx, kz) domain to (x, z) domain via belowequation:
e(x, z) = 1 (2π)2
∞ −∞ ∞ −∞
ES (kx, kz)ej(kxx+kzz)dkxdkz (8)
Here, e(x, z) is the focused GPR image in the spatial-spatial domain after thew-kdomain SAR algorithm. The details of the algorithm can be found in [13] and will not be repeated here.
4. SIMULATION AND MEASUREMENT RESULTS OF THE FOCUSING METHODS
In this section, we present the results of the focusing algorithms tested with simulated and measured data and compare the performance of both algorithms.
4.1. Simulation Results of the Algorithms
(a) (b)
(d) (c)
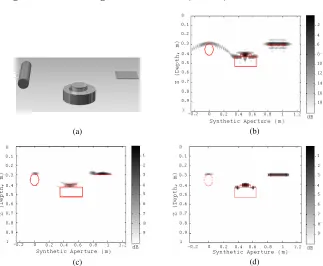
Figure 3. Simulation images of the buried objects. (a) CAD viewof the targets. (b) Original GPR image. (c) Focused GPR image after the HS method, (d) Focused GPR image after the w-k domain SAR method.
the HS and w-k domain SAR focusing algorithms, we got the new focused images as shown in Figure 3(c) and Figure 3(d), respectively. It is clear from the resultant images that both algorithms produce successful results in focusing hyperbolic behaviors.
4.2. Measurement Results 4.2.1. Laboratory Measurements
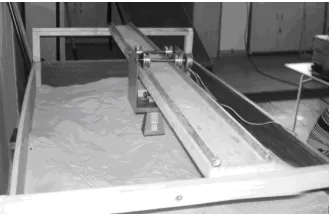
We have constructed an experimental set-up as shown in Figure 4 to acquire real B-scan measurements. We built a large wooden pool with a size of 190 cm×100 cm×80 cm filled with homogeneous, dry sand material whose dielectric constant is almost constant around 2.4 between 4 to 8 GHz. We have assembled a SFCW radar configuration with the help of Agilent E5071B ENA vector network analyzer (VNA) and different C-band pyramidal rectangular horn antennas. The measured data from the VNA was recorded to a computer via GPIB port.
Figure 4. Laboratory measurement set-up.
bistatic mode is chosen, the scattered field data viaS21 measurements was recorded to the computer.
(a) (b)
(d) (c)
Figure 5. Images obtained after laboratory measurements. (a) Geometrical viewof the buried objects. (b) Original GPR image of two metal pipes (bistatic case). (c) Focused GPR image after the HS method (d) Focused GPR image after thew-k domain SAR method.
The space-time GPR image was obtained simply by taking the IFT of the measuredS21data along the frequency axis, and converted to space-depth image by changing the coordinates withz=v·t. Since the dielectric constant of medium is almost constant around 2.4 at our frequencies of interest, the speed of the EM wave was taken as
v = c/√2.4. Since the antenna was positioned very close to ground level, EM wave traveled inside the sand for most of the trip time. Therefore, the above approximation about the speed of the wave seems to be reasonable.
most of the energy could penetrate into the sand thanks to bistatic configuration. Hence, we are able to sense the scattering from the bottom of the pool as well. Besides, scatterings from the pipes manifest the well-known parabolic pattern that is notable seen in the image. Also, the scattering mechanism as the EM wave travels around the perimeter of the pipes can also be observed in Figure 5(b).
After applying the HS algorithm, we obtained the focused image as depicted in Figure 5(c). It is fairly seen from the figure that the scattered energies are more concentrated around the true location of the pipes. It is also prominent that there exist some ghost image tails towards upward directions around the targets. This phenomenon occurs when the tails of a hyperbolic template pass over some true image locations for the pixels that are located in upper regions. If this is the case, the energy under this hyperbolic template is added to give a particular energy value although there is no scatterer present on this particular pixel location. These ghost image regions are unavoidable in our HS method that can be regarded as the weakness of the method. After applying the w-k domain SAR method, we obtained the newfocused GPR image as shown in Figure 5(d). As seen from the figure, the algorithm produces well focused images of the buried objects. Although the buried pipes are close to each other, they are isolated and clearly distinguished in the output focused image of the algorithm. The pipes are observed at their true spatial locations and strong scattering mechanisms from the top and the bottom of each pipe are clearly visible.
Figure 6. Real soil GPR measurement.
4.2.2. Outdoor Real Soil Measurements
A water-filled-plastic object with a cross section of 6 cm×6 cm and a height of 25 cm was buried flat at (x = 20 cm, z = 15 cm). A metal pipe with 7 cm in diameter and 33 cm in length was put flat at (x = 68 cm, z = 18 cm). Lastly, a metal plate with 7 cm×7 cm dimensions was buried horizontally at (x= 115 cm,z= 20 cm). During the experiments, the length of synthetic aperture was chosen as 134 cm to have a total of 68 discrete spatial points. The frequency of VNA was varied with 0.8 MHz increments, ranging from 0.8 GHz to 5 GHz. The space-time image was obtained simply by taking the 1-D IFT of the measured frequency diverse S11 data and is shown in Figure 7(b). As expected, the image is defocused around the buried objects and the intensive scattering phenomenon from air-ground intersection can be easily seen around att= 16 ns. After applying our HS andw-kdomain SAR focusing algorithms, the images of the buried three objects are acquired as seen in Figures 7(c) and (d), respectively.
It is clearly seen from the Figure 7(c) that the HS method well focuses the image around the true location of the targets. This is especially evident from the signatures of the pipe object. Also the metal plate has a backscattering intensity level that is comparable to the scattering from the air ground intersection. Therefore, it can be stated that the performance of the HS focusing technique is good enough to enhance the energy levels of the targets. By comparing the Figure 7(c) with the Figure 7(b), it is also distinguished that the signatures of the water-void is almost separated from the air ground interface.
After applying the w-k domain SAR method, the signatures of the targets are well concentrated around the exact locations of the objects as shown in Figure 7(d). It can be seen that the images of all three objects are separated from the air-ground interface. Also the horizontal resolution is well enhanced when compared with the image in Figure 7(b).
4.3. Comparison of the Algorithms
(a) (b)
(d) (c)
Figure 7. Images after real soil measurements (a) Geometry of the buried objects (b) Original GPR image of the buried objects; (c) Focused GPR image after the HS method (d) Focused GPR image after the w-k domain SAR method.
does not take these effects into account can give suboptimal results for inhomogeneous mediums. This fact is clearly evident from the simulated and measured output images of the HS method given in Figure 3(c) and Figure 7(c), respectively. We observe from these figures that while the HS method gives satisfactory focusing results for homogenous mediums, it has defocusing problems for real soil environment that is usually inhomogeneous. On the other hand, the
5. CONCLUSION
In this work, we have compared the effectiveness of two particular GPR focusing techniques; Hyperbolic Summation (HS) focusing and
w-k domain SAR focusing. The implementations of the algorithms were reviewed and both algorithms were tested on both simulation and measurement data. Application of proposed algorithms on the simulated data provides very well focused images. The horizontal resolutions of the simulated targets are satisfactorily improved for both methods. Then, the algorithms were tested on real data of indoor and as well as outdoor GPR experiments. Various objects at different locations were buried into the soil and their C-band GPR data were acquired by the help of a SFCW radar. By applying the methods to the measured rawB-scan data, it is seen that the methods provide different focusing performances. It can be stated thatw-kdomain SAR method better focuses the target signatures than the HS method, especially for real soil mediums. It is observed that HS method exhibits some focusing difficulties related to the inhomogeneity of the soil medium. It is also remarkable thatw-kdomain SAR algorithm is more efficient in terms of the computation time. For a future work, the algorithms can be tested on extremely inhomogeneous and wet soil conditions and can also be compared with other different focusing techniques.
ACKNOWLEDGMENT
This work is supported by the Scientific and Research Council of Turkey (TUBITAK) under grant no: EEEAG-104E085. The authors are grateful to Mersin Trakya Cam A.S. for providing sand material and Department of Mechanical Engineering of Mersin University for providing laboratory facilities for the conducted experiments.
REFERENCES
1. Daniels, D. J., Surface-Penetrating Radar, The Institution of Electrical Engineers (IEE), London, UK, 1996.
2. Capineri, L., P. Grande, and J. A. G. Temple, “Advanced image-processing technique for real-time interpretation of ground-penetrating radar images,”Int. J. Imaging Systems Tech., Vol. 9, No. 1, 51–59, 1998.
4. Gazdag, J., “Wave equation migration with the phase-shift method,”Geophysics, Vol. 43, 1342–1351, 1978.
5. Claerbout, J. F. and S. M. Doherty, “Downward continuation of moveout-corrected sesimograms,” Geophysics, Vol. 37, 741–768, 1972.
6. Schneider, W. A., “Integral formulation for migration in two and three dimensions,”Geophysics, Vol. 43, 49–76, 1978.
7. Stolt, R. H., “Migration by Fourier transform,” Geophysics, Vol. 43, 23–48, 1978.
8. Cafforio, C., C. Prati, and F. Rocca, “SAR data focussing using seismic migration techniques,”IEEE Trans. Geosci. Remote Sensing, Vol. 27, 194–207, 1991.
9. Soumekh, M., “A system model and inversion for synthetic aperture radar imaging,” IEEE Trans. Image Processing, Vol. 1, 64–76, 1992.
10. Gunawardena, A. and D. Longstaff, “Wave equation formulation of synthetic aperture radar (SAR) algorithms in the time-space domain,”IEEE Trans. Geosci. Remote Sens., Vol. 36, No. 6, 1995– 1999, 1998.
11. Gilmore, C., I. Jeffrey, and J. LoVetri, “Derivation and comparison of SAR and frequency-wavenumber migration within a common inverse scalar wave problem formulation,”IEEE Trans. Geosci. Remote Sens., Vol. 44, No. 6, 1454–1461, 2006.
12. Anxue, Z., J. Yansheng, W. Wenbing, and W. Cheng, “Experimental studies on GPR velocity estimation and imaging method using migration in frequency-wavenumber domain,”
Proceedings ISAPE, 468–473, Beijing, China, August 15–18, 2000. 13. Yigit, E., S. Demirci, C. Ozdemir, and A. Kavak, “A synthetic aperture radar-based focusing algorithm for B-scan ground penetrating radar imagery,”Microw. Opt. Tech. Letters, Vol. 49, 2534–2540, 2007.
14. Ozdemir, C., S. Demirci, E. Yigit, and A. Kavak, “A hyperbolic summation method to focus B-scan ground penetrating radar images: An experimental study with a stepped frequency system,”
Microwave Opt. Tech. Letters, Vol. 49, No. 3, 671–676, 2007. 15. Chew, W. C., Waves and Fields in Inhomogeneous Media, 2nd
edition, IEEE Press, NewYork, 1995.