Western University Western University
Scholarship@Western
Scholarship@Western
Electronic Thesis and Dissertation Repository
8-4-2015 12:00 AM
The Effects of Volatile Fatty Acids on the Performance of
The Effects of Volatile Fatty Acids on the Performance of
Microbial Electrolysis Cells
Microbial Electrolysis Cells
Nan Yang
The University of Western Ontario Supervisor
Dr. George Nakhla
The University of Western Ontario Co-Supervisor Dr. Hisham Hafez
The University of Western Ontario
Graduate Program in Civil and Environmental Engineering
A thesis submitted in partial fulfillment of the requirements for the degree in Master of Engineering Science
© Nan Yang 2015
Follow this and additional works at: https://ir.lib.uwo.ca/etd
Part of the Environmental Engineering Commons
Recommended Citation Recommended Citation
Yang, Nan, "The Effects of Volatile Fatty Acids on the Performance of Microbial Electrolysis Cells" (2015). Electronic Thesis and Dissertation Repository. 3145.
https://ir.lib.uwo.ca/etd/3145
This Dissertation/Thesis is brought to you for free and open access by Scholarship@Western. It has been accepted for inclusion in Electronic Thesis and Dissertation Repository by an authorized administrator of
Electrolysis Cells
(Thesis format: Integrated Article)
by
Nan Yang
Graduate Program in Civil and Environmental Engineering
A thesis submitted in partial fulfillment
of the requirements for the degree of
Master in Engineering Science
The School of Graduate and Postdoctoral Studies
The University of Western Ontario
i
Abstract
This study investigated the performance of microbial electrolysis cells (MECs) fed with three
common fermentation products: acetate, butyrate, and propionate. Each substrate was fed to
the reactor for three consecutive-batch cycles. The results showed high current densities for
acetate, but low current densities for butyrate and propionate (maximum values were 6.0 ±
0.28, 2.5 ± 0.06, 1.6 ± 0.14 A/m2, respectively). Acetate also showed a higher coulombic efficiency of 87 ± 5.7 % compared to 72 ± 2.0 and 51 ± 6.4 % for butyrate and propionate,
respectively. This paper also revealed that acetate could be easily oxidized by anode respiring
bacteria in MEC, while butyrate and propionate could not be oxidized to the same degree. The
utilization rate of the substrates in MEC followed the order: acetate > butyrate > propionate.
The ratio of suspended biomass to attached biomass was approximately 1:4 for all the three
substrates.
Keywords
ii
Co-Authorship Statement
Dr. George Nakhla and Dr. Hisham Hafez provided supervision and guidance to the research
project.
Chapter 3: Impact of Volatile Fatty Acids on Microbial Electrolysis Cell Performance
Nan Yang, Hisham Hafez, George Nakhla
My contributions are as follows:
Design and execution of the experimental testing program
Analysis and interpretation of the findings
Writing the paper
iii
To my beloved parents for their support,
my boyfriend, Minchao, for his accompany and endless love,
iv
Acknowledgments
I would like to express my deepest appreciation and respect to my advisors’ Dr. George Nakhla
and Dr. Hisham Hafez for their constant guidance and support. I am deeply touched by Dr.
Nakhla’s enthusiasm for student training and his way of encouraging his students to think. Dr.
Nakhla is very well-known for his continuous-flow strive to maintain high standards and
pushing his student to think critically, which was very crucial to develop my potential, and for
which I am deeply indebted. Without his encouragement and pushes, I could not have achieved
the utmost of my potential. Dr. Hisham Hafez also offered me a lot of help throughout my
master studies. I am grateful for his kindness and support.
I would like to express my sincere gratitude to Dr. Elsayed Elbeshbishy and Bipro Dhar for
their help during the start-up of the reactors. I would also like to thank my colleague and good
friends, especially Medhvi Gupta, Noha Nasr, Maritza Gomez-Flores, Chinaza Akobi, Basem
Haroun, Joseph Donohue, Nael Yasri, Zhenqi Wang, Kai Li, Xiaoguang Liu, Mingu Kim,
Manoli Kyriakos. They are always so kind, helpful, and cheerful. I feel very lucky to be one
of this wonderful team. Last but not least, I would like to thank my family, my boyfriend, and
v
Table of Contents
Abstract ... i
Co-Authorship Statement... ii
Acknowledgments... iv
Table of Contents ... v
List of Tables ... viii
List of Figures ... ix
Nomenclature ... xi
Chapter 1 ... 1
Introduction ... 1
1.1 Background ... 1
1.2 Research Objectives ... 2
1.3 Research Contributions ... 3
1.4 Thesis Organization ... 3
1.5 References ... 3
Chapter 2 ... 5
Literature Review... 5
2.1 Introduction ... 5
2.2 Materials ... 7
2.2.1 Anode ... 7
2.2.2 Cathode ... 9
2.2.3 Membrane ... 10
2.3 Microorganisms ... 18
2.4 Modification of MEC design ... 20
2.4.1 Multi-electrode ... 20
vi
2.4.3 Up-flow continuous-flow system ... 27
2.4.4 Biocathode ... 29
2.5 Combined process ... 30
2.6 Pilot-scale continuous-flow microbial electrolysis cell ... 31
2.7 Discussion ... 32
2.7 Reference... 33
Chapter 3 ... 41
Impact of Volatile Fatty Acids on Microbial Electrolysis Cell Performance ... 41
3.1 Introduction ... 41
3.2 Materials and methods ... 45
3.2.1 Reactor set-up ... 45
3.2.2 MEC inoculation and operation ... 47
3.2.3 Analytical methods ... 48
3.2.4 Calculations... 49
3.3 Results and discussion ... 51
3.3.1 Effects of substrate on current density and hydrogen production rate ... 51
3.3.2 Effects of substrate on hydrogen recovery and energy efficiency ... 54
3.4 Conclusion ... 63
3.5 References ... 65
Chapter 4 ... 71
Conclusions and Recommendations ... 71
4.1 Conclusions ... 71
4.2 Recommendations ... 73
Appendices ... 75
Appendix A ... 76
vii
A.2 MEC fabrication ... 77
A.3 Pretreatment method ... 80
A3.1. Carbon fiber pretreatment (3 days in series) ... 80
A3.2. Membrane pre-treatment ... 81
A.4 Medium preparation ... 82
Appendix B. Calculation summary ... 84
viii
List of Tables
Table 2.1 -- Components and performance of two-chamber MECs in continuous-flow mode
... 15
Table 2.2 -- Components and performance of single chamber MECs in continuous-flow mode ... 17
Table 2.3 -- Components and performance of MEC with gas-phase cathode in continuous-flow mode ... 24
Table 3. 1 -- Summary of current densities and removal efficiencies by different authors using acetate, butyrate and propionate ... 44
Table 3. 2 -- Comparison of key parameters reported in literatures versus data obtained in this study ... 57
Table 3.3 -- COD data for each cycle ... 60
Table 3.4 -- COD mass distribution ... 60
ix
List of Figures
Figure 2.1 –The development of continuous-flow MECs during the past years based on the
number of journal papers being published. The total number of articles is based on “Scopus”
search using “microbial electrolysis cell” as key word in July 2015, while the number of
continuous-flow articles is further limited to “continuous” as refined key word. ... 7
Figure 2.2 – Proton transfers from anode to cathode by negative charges through AEM (left)
and hydroxide transfers from cathode to anode through AEM (right). ... 12
Figure 2.3 – Schematic of three EET mechanisms used by ARB: (a) direct electron transfer,
(b) an electron shuttle, and (c) a solid conductive matrix (Torres et al., 2009) ... 18
Figure 2.4 – (A) Schematic (top view) and (B) photograph of the 2.5 L scale-up
continuous-flow microbial electrolysis cell containing 8 half graphite brush anodes and 8 stainless steel
mesh cathodes: (a) gas bag, (b) power sources, (c) fluid pump, and (d) substrate feed tank.
(Rader et al., 2010)... 20
Figure 2.5 – Diagram of a continuous-flow MEC setup. (Tartakovsky et al., 2009) ... 21
Figure 2.6 – Design of up-flow biocatalyzed electrolysis reactor (UBER). Left: Schematic
diagram of the system. Right: Laboratory scale reactor for NB reduction (Wang et al., 2012)
... 27
Figure 2.7 – Schematic diagram of the SRB-biocathode MEC. (Luo et al., 2014) ... 29
Figure 2.8 – The structure of anaerobic baffled reactor combining with microbial electrolysis
cells. (Ran et al., 2014) ... 30
Figure 3.1 -- a – Schematic illustration of a typical two-chamber MEC with an anion
exchange membrane (AEM); b – Picture of connecting the anode chamber (1), anode
electrode (2), membrane (3), cathode chamber (4), cathode electrode (5), and non-conductive
polyethylene (6) together ... 46
Figure 3.2 – The changes of current densities with different substrates, including: start-up
x
10), and acetate-fed cycle (11). The COD of cycle 1 to 4 are 1600 mg/L, and for cycle 5 to 11
are 800 mg/L. ... 52
Figure 3.3 – The average current densities and hydrogen production rates in MEC fed with
different substrates ... 54
Figure 3.4 – The coulombic efficiencies (CE), cathodic hydrogen recoveries and overall
hydrogen recoveries in MEC fed with different substrates ... 55
Figure 3.5 – The relationship of CD/HPR (current density/hydrogen production rate) and
cathodic hydrogen recoveries in MEC fed with different substrates ... 56
Figure 3.6 – The changes of hydrogen yields (YH2), energy efficiencies with only electric
input (ηE), and energy efficiencies including both electric input and the energy content in
substrate (ηE+S) in MEC fed with different substrates ... 59
Figure A2.1 -- Anode preparation: materials used for anode (left) and wrapping around the
anode electrode with carbon fiber (right). ... 77
Figure A2.2 -- Pretreatment of the anode in the fume hood: a) 1st day with nitric acid (1N); b) 2nd day with acetone (1N); c) 3rd day with ethanol (1N) ... 77
Figure A2.3 -- (a) Membrane after pretreatment: 24 hours at 40oC in 5% NaCl solution (b) Cathode (left), membrane (middle) and anode (right) (c) Brushing Vaseline onto rubber to prevent leaking (d) Connecting the anode chamber, anode electrode, membrane, cathode electrode and cathode chamber together ... 78
Figure A2.4 – (a) Picture of connecting the anode and cathode electrode to the power supply
(b) A resister is connected in series with anode and cathode (c) Set-up picture of the MEC
system ... 79
xi
Nomenclature
ABR Anaerobic baffled reactor
AEM Anion exchange membrane
ARB Anode respiring bacteria
BEAMR Bio-electrochemically assisted microbial reactor
BES Bioelectrochemcial system
CEM Cation exchange membrane
COD Chemical oxygen demand
DPRB Dissimilatory perchlorate reducing bacteria
EET Extracellular electron transfer
HER Hydrogen evolution reaction
HRT Hydraulic retention time
MECs Microbial electrolysis cells
MFCs Microbial fuel cells
PEM Proton exchange membrane
SCOD Soluble chemical oxygen demand
SRB Sulfate reducing bacteria
UASB Up-flow anaerobic sludge bed
UBER Up-flow biocatalyzed electrolysis reactor
1
Chapter 1
Introduction
1.1 Background
Hydrogen potentially plays a key role in sustainable energy production. It can be recovered
by dark fermentation of organic material rich in carbohydrates, but a major fraction of organic
matter remains in the form of volatile fatty acids (VFAs) (Liu et al., 2005).
Theoretically, 12 moles of hydrogen can be extracted from 1 mole of glucose, if the
complete conversion reaction to hydrogen is taken into account (Eq. (1)). However, in practice,
only less than 33% of the theoretical hydrogen production can be achieved, since part of the
original substrate remains as acetate (Eq. (2)) and some of the organic matter is used for biomass
synthesis. Moreover, organic intermediates also act as electron scavengers, which lead to the
production of other fermentation products such as propionate, butyrate, lactate, formate and
alcohols. In case the butyrate fermentation pathway is established, the conversion efficiency is
reduced to 2 mol H2/mol glucose (Eq. (3)) (Gioannis et al., 2013). Further utilization of these
volatile fatty acids to produce more hydrogen is very promising.
𝐶6𝐻12𝑂6 + 6𝐻2𝑂 → 12𝐻2 + 6𝐶𝑂2 (1)
𝐶6𝐻12𝑂6 +2𝐻2𝑂 → 4𝐻2 + 2𝐶𝑂2 + 2𝐶𝐻3𝐶𝑂𝑂𝐻 (2)
𝐶6𝐻12𝑂6 → 2𝐻2 + 2𝐶𝑂2 + 𝐶𝐻3𝐶𝐻2𝐶𝐻2𝑂𝑂𝐻 (3)
To achieve a higher conversion of a substrate to hydrogen, an addition to fermentation to
achieve a higher hydrogen yield is the process of electrohydrogenesis using microbial electrolysis
2
Recently, combining dark fermentation with MECs seems to be very promising. Some
researches use dark fermentation effluent as the MEC influent or combine dark fermentation with
MEC/MFC together. As the main end products from dark fermentation, VFAs have a vital impact
on the performance of MECs. Currently, most MECs use acetate as the benchmark substrate
Acetate and butyrate proved to be easily degradable, whereas propionate exhibited
pseudo-recalcitrant behavior in a continuous-flow two-chamber MEC (Escapa et al., 2013).
In this study, a two chamber microbial electrolysis cell (MEC) was used to oxidize acetate,
butyrate and propionate individually, and the effects of different substrates on the performance of
MEC were assessed.
1.2 Research Objectives
The main goal of this study was to further explore the use of dark fermentation effluent
comprising VFA mixtures in MECs. The specific objectives are as follows:
To clear the contradiction in the literature regarding the relative biodegradability of
butyrate and propionate in MECs.
To further explore the use of dark fermentation effluent in MECs.
To assess the impact of VFAs on MEC performance.
To establish the relationship between attached biomass and suspended biomass for
butyrate and propionate in MEC.
To compare the impact of initial concentration of chemical oxygen demand (COD) on
3
1.3 Research Contributions
Even though a handful of literature studies investigated the performance of MECs with
different VFAs, there is a contradiction in the literature regarding the relative biodegradability of
butyrate and propionate in MECs. In this research, a comprehensive comparison of the effects of
acetate, butyrate, and propionate on MEC is undertaken. Furthermore, for the first time the
relationship between attached biomass and suspended biomass for butyrate and propionate in MEC
has been established.
1.4 Thesis Organization
This thesis includes four chapters and two appendices, which confirm to the “integrated
article” format as outlined in the Thesis Regulation Guide by the School of Graduate and
Postdoctoral Studies (SGPS) of the University of Western Ontario. The thesis consists of the
following chapters:
Chapter 1 -- presents the general background, research objectives, and research contributions
Chapter 2 – presents a literature review on MEC materials, configurations, and performances
Chapter 3 – discusses the effects of different VFAs on the performance of MEC
Chapter 4 – recommendations for future work based on the literature review and the results of
this study
1.5 References
1. Escapa, A., Lobato, A., García, D., Morán, A. 2013. Hydrogen production and COD elimination
rate in a continuous-flow microbial electrolysis cell: The influence of hydraulic retention time and
4
2. Gioannis, G.D., Muntoni, A., Polettini. R.P. 2013. A review of dark fermentative hydrogen
production from biodegradable municipal waste fractions. Waste Management. 33, 1345-1361.
3. Logan, B.E., Call, D., Cheng, S., 2008. Microbial electrolysis cells for high yield hydrogen gas
production from organic matter. Environ. Sci. Technol. 42,23-8631.
4. Liu, H., Cheng, S., Logan, B.E. 2005. Production of electricity from acetate or butyrate using a
5
Chapter 2
Literature Review
2.1 Introduction
In recent years, bioelectrocatalysis using microorganisms as catalysts for
bioelectrochemcial system (BES) has become very promising for wastewater treatment and
removal of various contaminants via electrobiochemical reactions (Wang et al., 2012). In a BES,
organic compounds such as acetate, glucose, volatile fatty acids, protein, domestic wastewater,
etc. and inorganic compounds such as sulfide (Rabaey et al., 2006) are oxidized at the anode. At
the cathode, reduction of oxygen or other electron acceptors such as nitrate, nitrobenzene,
perchlorate, sulfate occurs. The bioanode, at which microorganisms convert the chemical energy
in organic matter to electrical energy, forms the basis of most BESs (Sleutels et al., 2013). These
systems are referred to as Microbial Fuel Cells (MFCs) when electricity is produced or Microbial
Electrolysis Cells (MECs) when electrical energy is added to the chamber.
In MFCs, bacteria growing on the anode, oxidize organic matter and release carbon dioxide
and protons into solution and electrons to the anode. The cathode is sparged with air to provide
dissolved oxygen for the reactions of electrons, protons and oxygen at the cathode, with a wire
(and load) to complete the circuit and produce power (Logan, 2008a).
When oxygen is present at the cathode, current can be produced, but without oxygen,
current generation is not spontaneous. However, when applying a voltage (>0.2V in theory) to the
system, hydrogen gas is produced at the cathode through the reduction of protons (Logan et al.,
2008b). In MECs, the anode-respiring bacteria (ARB), such as Geobacter Shewanella,
6
conductive anode where they oxidize organic compounds and transfer the electrons through an
external electrical circuit to the cathode (Lee et al., 2010). The electrons reach the cathode and
react with water to produce H2. This system has previously been named as bio-electrochemically
assisted microbial reactor (BEAMR) or a biocatalyzed electrolysis cell. Because the standard
potential of the organics (e.g. Eacetate = -0.28 V) is more positive than for H2 (EH2 = -0.41 V), and
also due to energy losses, electric power supply must be added into the reactor. The typical range
of applied voltage is 0.6 V to 1.2 V (Logan, 2008a).
To date, MECs as a new technology to produce bio-fuels and degrade wastewater have
been extensively reviewed. These include a brief overview of recent advances in research on
electrochemically active bacteria, MEC materials and design, as well as a critical review of high
hydrogen yield from various feedstock (Liu et al., 2010), an overview of cathode material and
catalysts suitable for generating hydrogen in microbial electrolysis cell (Kundu et al., 2013), and
a review of the substrates used in microbial electrolysis cells (MECs) for producing sustainable
and clean hydrogen gas (Kadier et al., 2014).
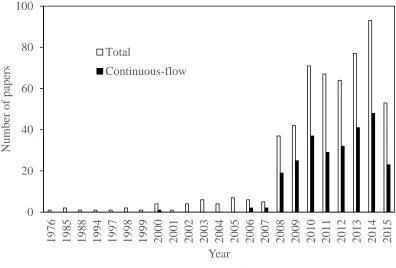
However, a comprehensive review of research on continuous-flow MEC, which is very
important for scaling up, is still lacking. The development of continuous-flow MECs during the
past years based on the number of journal papers being published is shown in Figure 2.1. The
number of continuous-flow papers was very low before the year of 2008. The continuous-flow
studies increased from 19 in 2008 to 48 in 2014. The ratio of continuous-flow to total papers
published on MECs also increased with time, from 33% in 2006 to 52% in 2014. Furthermore the
modification of MECs for continuous-flow wastewater treatment, their advantages and challenges
7
Figure 2.1 –The development of continuous-flow MECs during the past years based on the
number of journal papers being published. The total number of articles is based on “Scopus” search using “microbial electrolysis cell” as key word in July 2015, while the number of
continuous-flow articles is further limited to “continuous” as refined key word.
2.2 Materials
2.2.1 Anode
Almost all the research in MECs has utilized carbon-based materials for the anode, except
for bio-cathode MECs because the microorganisms are grown on the cathode instead of anode.
The carbon-based anodes are so popular because of their good conductivity, biocompatibility, low
over-potentials and relatively low cost (Logan et al., 2008).
Common materials in laboratory scale MECs operated in continuous-flow mode include
carbon felt (Sleutels et al., 2013; Tartakovsky et al., 2009), carbon mesh (Cusick et al., 2014),
carbon brush (Cui et al., 2012; Wang et al., 2012), carbon fiber (Dhar et al., 2013), graphite felt 0
20 40 60 80 100
1976 1985 1988 1994 1997 1998 1999 2000 2001 2002 2003 2004 2005 2006 2007 2008 2009 2010 2011 2012 2013 2014 2015
Num
ber
of pape
rs
Year Total
8
(Jeremiasse et al., 2010), graphite granules (Gusseme et al., 2012), graphite powder (Thrash et al.,
2007) and graphite fiber (Lee & Rittmann, 2009).
Ammonium treatment of carbon electrodes have become a widely applicable method for
increasing the performance of both MFCs and MECs by facilitating the attachment of
microorganism and increasing electron transfer to the anode surface area (Cheng & Logan, 2007).
Optimal heat treatment in the laboratory for the brush anodes was reported as 450°C for 30 min
(Wang et al., 2009). The advantages of this treatment are: (1) to a faster start-up, (2) higher current
densities. The aforementioned advantages are attributed to the more favorable adhesion of
microorganisms to the positively charged anode and to improved electron transfer to the
chemically modified surface (Cheng et al., 2007). However, at full-scale, the cost of heat
pre-treatment appears be a challenge.
Wang et al. (2010) have demonstrated that the electricity output and conversion of acetate
to hydrogen were increased with a packed bed of graphite granules as electrodes. A graphite rod
was inserted in the bed as a current collector. Titanium or stainless steel is always served as the
current collector when the carbon materials are in fiber or brush form.
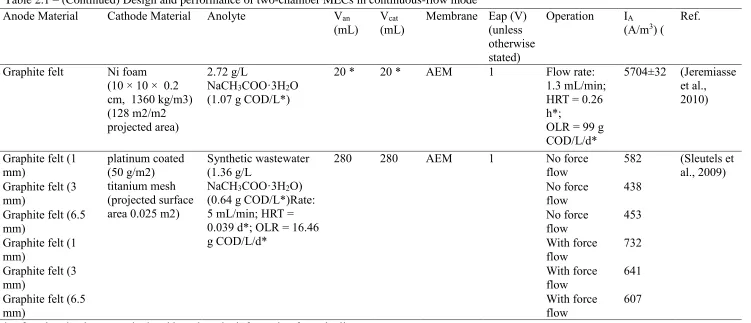
Porous electrodes such as graphite felt also have the potential to generate higher volumetric
current densities due to the high specific surface area. Sleutels et al. (2009) studied the effect of
mass and charge transport on current densities using three thicknesses (1, 3, 6.5 mm) of graphite
felt anode. A spacer material (64% open; PETEX 07-4000/64, Sefar BV, Goor, The Netherlands)
with a total thickness of 4 mm was placed between the anode and the membrane, so that the anolyte
was forced to flow perpendicular to the felt. The aforementioned researchers found that without
9
current density. This was because in thicker types of felt the substrate was limiting microbial
growth in deeper parts of the felts. With the forced flow, this system reached a high current density
of 16.4 A m-2 and a hydrogen production rate of 5.6 m3 m-3 d-1 at an applied voltage of 1 V with a 50 mM phosphate buffer solution. This research showed that the current densities in porous
electrodes can be improved by the force flow of anolyte through the electrode.
2.2.2 Cathode
Most of the cathode material used in continuous-flow MEC systems are stainless steel mesh
(Dennis et al., 2013; Nam et al., 2014), platinum (Pt) coated with titanium (Sleutels et al., 2013),
nickel (Ni) foam (Jeremiasse et al., 2010), carbon paper or carbon cloth coated with Pt or Ni
(Hrapovic et al., 2010), and graphite granules (Gusseme et al., 2012). When it comes to
biocathodes, carbon materials are always used as the cathode.
Unlike anode materials, plain carbon materials are rarely used as cathode since the
hydrogen evolution reaction (HER) on plain carbon electrodes is very slow, requiring a high
overpotential (-0.42 V at pH 7) to drive hydrogen production (Rozendal et al., 2007; Logan et al.,
2008).
It has been shown in the literature that adding specific chemicals to highly conductive
surfaces can greatly affect electron transfer. Hrapovic et al. (2010) developed a low cost MEC
cathode by Ni electrodeposition onto a porous carbon paper, and evaluated different Ni or Pt
loadings. The aforementioned authors found that at a Ni load of 0.2-0.4 mg cm-2 under acetate non-limiting conditions, hydrogen production could reach 5.4 L L-1 d-1 with a corresponding current density of 5.7 A m-2. This hydrogen production rate was significantly greater than the
10
and Ni alloy or NiW cathodes (Hu et al., 2009). According to the authors, the improved rate of
hydrogen production was due to an optimized Ni load and the high porosity of the gas diffusion
cathodes, which provided a higher surface area for Ni electrodeposition, compared to the solid
metal sheets used by Selembo et al (2009). Moreover, this study proved that Ni is a better catalyst
than Pt in MECs. Manuel et al. (2010) studied the impact of the catalyst load on hydrogen
production rate, and concluded that the chemical deposition of Ni can be successfully employed
for continuous-flow production of hydrogen in a MEC.
Instead of using Ni as a deposited catalyst onto carbonaceous materials, Jeremiassa et al.
(2010) investigated the nickel as the cathode, because of its low electrical resistivity, availability,
stability in highly alkaline solutions, low price, and reported a hydrogen production as high as 50
m3 m-3 d-1 and a current density of 22.8 ± 0.1 A m-2 with electrical energy input of 2.6 KWh m-3 H2.
Despite its success in fed-batch MEC and MFC studies, stainless steel have not been
studied in continuous-flow studies.
2.2.3 Membrane
A membrane can be used to separate the chamber where microorganisms degrade the
substrate from the one where hydrogen evolves (Logan et al., 2008). The advantages of applying
the membrane are minimization of hydrogen losses by anodic bacteria and in the liquid, and
prevention of hydrogen gas from mixing with carbon dioxide in the anode, while its disadvantages
are the increase in potential losses associated with the membrane, and the reduction of energy
11
Cation exchange membranes (CEMs) have been used in several studies with limited
success since cations, such as Na+, K+, NH
4+, Ca2+ and Mg2, can be transported more efficiently
than protons through the membrane (Rozendal et al., 2006; Zhao et al., 2006). The reason is that
the pH of the substrate in MEC is close to 7, which means only about 10-4 mM of protons are present in the anode chamber, orders of magnitude lower than the typical cations concentrations
(Rodendal et al., 2007).
If H+ cannot be effectively transported across a CEM, then the pH cannot be effectively
balanced in an MEC. A possible solution to the pH gradient associated potential losses is the
application of an anion exchange membrane (AEM) instead of a CEM. Rozend et al. (2007)
discovered that the AEM is better capable of preventing the pH gradient across the membrane than
the CEM (CEM ΔpH = 6.4; AEM ΔpH = 4.4). Consequently, the pH gradient associated potential
losses were lower in the AEM configuration (CEM 0.38V; AEM 0.26 V). Sleutels et al. (2013)
also made a comparison between AEM and CEM configurations, as shown in Table 2.1. At
steady-state operation, a current density of 10.2 A m-1 (909 A m-3) at an applied voltage of 1.0 V was produced in the AEM, compared to 7.2 A m-2 (643 A m-3) for the CEM (Sleutels et al., 2013). The difference between the current densities was due to the lower resistance for transport of ions
through the membrane for the AEM configuration compared to the CEM configuration (Sleutels
et al., 2013).
There are two theories for the proton transfer mechanism in the literature. Logan et al.
(2008a) found that an AEM can allow proton conduction via negatively charged species such as
phosphate anions that can be added at high concentration. However, on the other hand, Rozendal
et al. (2007) discovered that in an AEM, electroneutrality is achieved by the transport of anions
12
cathode is not produced from the reduction of protons, but from the reduction of water that diffuses
through the membrane from the anode to the cathode (Rozendal et al., 2007).The two
aforementioned transfer mechanisms are depicted in Figure 2.2.
In order to study the effect of membrane on MEC performances, Tartakovsky et al. (2009)
constructed two gas-phase cathode MECs operating in continuous-flow mode, one with a proton
exchange membrane (PEM, Nafion 117), and the other without membrane. The absence of PEM
reduced the internal resistance form 27 Ω to 19 Ω. At an acetate loading rate of 4 g LA-1 d-1 (i.e., 4
g per day per liter of anode), hydrogen production rates of 1.0-1.3 LSTP LA-1d-1, and 6.1-6.5 LSTP
LA-1d-1 were obtained in MEC with membrane and MEC without membrane, respectively. These
values are comparable with the hydrogen production rate of 1 L LA-1d-1 observed in a MEC
equipped with a PEM (Rozendal et al., 2007) and a rate of 3 L LA-1d-1 observed in a single chamber
membrane-free MEC (Call & Logan, 2008b). Single-chamber membrane-free MECs were
designed by Hu et al. (2008) and successfully produced hydrogen from organic matter using one Figure 2.2 – Proton transfers from anode to cathode by negative charges through
13
mixed culture (using local domestic wastewater as the inoculum) and one pure culture (
Shewanella oneidensis MR-1). At an applied voltage of 0.6V, this system with a mixed culture
achieved a hydrogen production rate of 0.53 m3 day-1 m-3 with a current density of 9.3 A m-2 at neutral pH and 0.69 m3 d-1 m-3 with a current density of 14 A m-2 at pH 5.8 (Hu et al., 2008). The current hydrogen production rates in the pure culture system were much lower than those with
mixed culture systems. The performance of single chamber MECs under continuous-flow mode is
shown in Table 2.2.
Lee et al. (2009) found that the longer the hydraulic retention time (HRT), the higher the
COD removal efficiency, but that corresponded to a lower current density. This illustrated that the
feeding mode, either batch or continuous mode, has a big impact on the performance of MECs.
The higher hydraulic retention time leads to a lower organic loading rate. The following equations
depict the relationship between organic loading rate and current density.
1 𝑚𝑜𝑙 𝑒− = 8 𝑔 𝐶𝑂𝐷 (1)
1 𝑚𝑜𝑙 𝑒− = 96485 𝐶 (2)
𝑂𝑟𝑔𝑎𝑛𝑖𝑐 𝑙𝑜𝑎𝑑𝑖𝑛𝑔 𝑟𝑎𝑡𝑒 (𝑂𝐿𝑅) = 𝑔 𝐶𝑂𝐷 𝑚3𝑑 =
1𝑚𝑜𝑙 𝑒− 8 𝑚3𝑑 =
96485 𝐶
8𝑚386400𝑠= 0.14
𝐴 𝑚3 (3)
From equations (1) and (2), the relationship between organic loading rate and current
density in continuous-flow MEC could be derived. Equation (3) illustrates that the organic loading
rate is proportional to the current density in an MEC. Even though, in practice, there are other
factors that can affect the aforementioned ratio of OLR to current density, generally higher organic
14
decreased from 1630 to 1470 A m-3, when the organic loading rate decreased from 16.3 to 4.02 g COD L-1d-1 (Lee et al., 2009).
Operating MECs in continuous-flow mode has become increasingly popular since 2008,
because it can achieve better performance than batch MECs. For example, hydrogen production
rate was 5.4 L d-1 L-1 under acetate non-limiting conditions in a Ni cathode MEC operating in continuous-flow mode, compared to 2.3 L d-1 L-1 under batch mode operation (Hrapovic et al., 2010). Moreover, coulombic efficiency increased from 45% to 86% upon changing the operational
mode from batch to continuous-flow in a dual-chamber H-type MEC (Torres el al., 2007). Villano
et al. (2012) also demonstrated a remarkable increase in current generation from 18 mA to 120
mA when the MEC was switched from batch to continuous-flow mode. The aforementioned
studies suggest that the feeding regime has a big impact on the MEC performance.
In a batch mode MEC, the substrate is added at the beginning of each cycle, and the
MEC is fed when the current density drops significantly. Thus in batch mode, the ARBs are
operating at viable substrate concentrations, which at times could be limiting growth. However in
the continuous-flow mode MEC, the soluble COD fed into the reactor can be controlled by the
hydraulic retention time, or organic loading rate, which lead to a non-substrate limiting condition
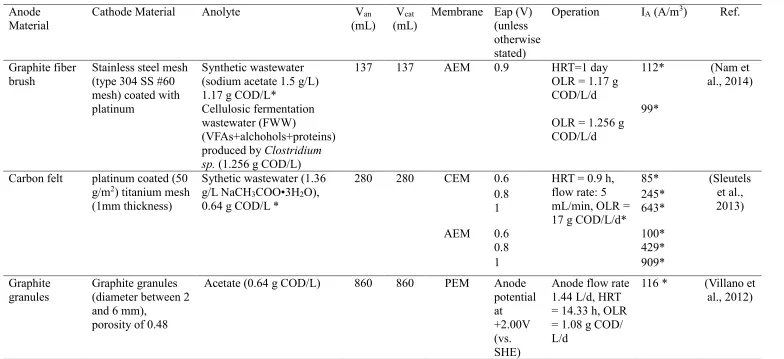
15
Table 2.1 -- Design and performance of two-chamber MECs in continuous-flow mode Anode
Material
Cathode Material Anolyte Van
(mL)
Vcat
(mL)
Membrane Eap (V) (unless otherwise stated)
Operation IA (A/m3) Ref.
Graphite fiber brush
Stainless steel mesh (type 304 SS #60 mesh) coated with platinum
Synthetic wastewater (sodium acetate 1.5 g/L) 1.17 g COD/L*
137 137 AEM 0.9 HRT=1 day
OLR = 1.17 g COD/L/d
OLR = 1.256 g COD/L/d
112* (Nam et
al., 2014)
Cellulosic fermentation wastewater (FWW)
(VFAs+alchohols+proteins) produced by Clostridium sp. (1.256 g COD/L)
99*
Carbon felt platinum coated (50 g/m2) titanium mesh
(1mm thickness)
Sythetic wastewater (1.36 g/L NaCH3COO•3H2O),
0.64 g COD/L *
280 280 CEM 0.6 HRT = 0.9 h,
flow rate: 5 mL/min, OLR = 17 g COD/L/d*
85* (Sleutels et al., 2013)
0.8 245*
1 643*
AEM 0.6 100*
0.8 429*
1 909*
Graphite
granules Graphite granules (diameter between 2 and 6 mm),
porosity of 0.48
Acetate (0.64 g COD/L) 860 860 PEM Anode potential at
+2.00V (vs. SHE)
Anode flow rate 1.44 L/d, HRT = 14.33 h, OLR = 1.08 g COD/ L/d
16
Table 2.1 – (Continued) Design and performance of two-chamber MECs in continuous-flow mode Anode Material Cathode Material Anolyte Van
(mL) V(mL) cat Membrane Eap (V) (unless otherwise stated)
Operation IA
(A/m3) ( Ref.
Graphite felt Ni foam (10 × 10 × 0.2 cm, 1360 kg/m3) (128 m2/m2 projected area)
2.72 g/L
NaCH3COO·3H2O
(1.07 g COD/L*)
20 * 20 * AEM 1 Flow rate: 1.3 mL/min; HRT = 0.26 h*;
OLR = 99 g COD/L/d*
5704±32 (Jeremiasse et al., 2010)
Graphite felt (1 mm)
platinum coated (50 g/m2) titanium mesh (projected surface area 0.025 m2)
Synthetic wastewater (1.36 g/L
NaCH3COO·3H2O)
(0.64 g COD/L*)Rate: 5 mL/min; HRT = 0.039 d*; OLR = 16.46 g COD/L/d*
280 280 AEM 1 No force
flow
582 (Sleutels et al., 2009) Graphite felt (3
mm)
No force flow
438
Graphite felt (6.5 mm)
No force flow
453
Graphite felt (1 mm)
With force flow
732
Graphite felt (3 mm)
With force flow
641
Graphite felt (6.5 mm)
With force flow
607
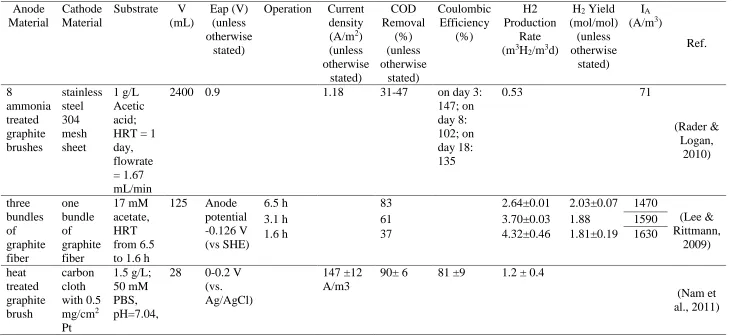
17
Table 2.2 -- Design and performance of single chamber MECs in continuous-flow mode
Anode Material
Cathode Material
Substrate V (mL)
Eap (V) (unless otherwise
stated)
Operation Current density (A/m2) (unless otherwise stated) COD Removal (%) (unless otherwise stated) Coulombic Efficiency (%) H2 Production Rate (m3H2/m3d)
H2 Yield
(mol/mol) (unless otherwise
stated)
IA
(A/m3)
Ref. 8 ammonia treated graphite brushes stainless steel 304 mesh sheet 1 g/L Acetic acid; HRT = 1 day, flowrate = 1.67 mL/min
2400 0.9 1.18 31-47 on day 3:
147; on day 8: 102; on day 18: 135
0.53 71
(Rader & Logan, 2010) three bundles of graphite fiber one bundle of graphite fiber 17 mM acetate, HRT from 6.5 to 1.6 h
125 Anode potential -0.126 V (vs SHE)
6.5 h 83 2.64±0.01 2.03±0.07 1470
(Lee & Rittmann,
2009)
3.1 h 61 3.70±0.03 1.88 1590
1.6 h 37 4.32±0.46 1.81±0.19 1630
heat treated graphite brush carbon cloth with 0.5 mg/cm2 Pt 1.5 g/L; 50 mM PBS, pH=7.04,
28 0-0.2 V (vs. Ag/AgCl)
147 ±12
A/m3
90± 6 81 ±9 1.2 ± 0.4
18
2.3 Microorganisms
Most forms of respiration involve a soluble compound (e.g. oxygen, nitrate, and sulfate) as
an electron acceptor; nevertheless, some microorganisms are able to respire solid electron
acceptors (metal oxides, carbon, and metal electrodes) in order to obtain energy (Torres et al.,
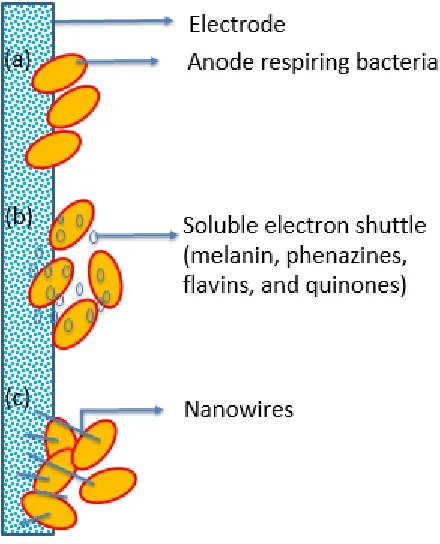
2009). Extracellular electron transfer (EET), which refers to electron transport to the surface of the
solid electron acceptor, is now the most acceptable explanation of how microorganisms respire
using a solid electron acceptor. Researchers have discovered three distinct EET mechanisms,
which are shown in Figure 2.3. The first mechanism presents direct electron transfer between
electron carriers in the bacteria and the solid electron acceptor (Torres et al., 2009). The second
mechanism occurs in the presence of a soluble electron shuttle, which is a compound (e.g. melanin,
phenazines, flavins, and quinones) that carries electrons between the bacteria and the electrode by
diffusive transport (Newman & Kolter,, 2000; Turick et al.,2002; Hernandez et al., 2004; von
Canstein et al., 2008). The third mechanism proposes a solid component (cellular pili as nanowires)
that is part of the extracellular biofilm matrix and is conductive for electron transfer from the
19
Figure 2.3 – Schematic of three EET mechanisms used by ARB: (a) direct electron transfer, (b)
soluble electron shuttle, and (c) cellular pili as nanowires.
Liu et al. (2008) studied the community analysis of an MEC and observed that
Pseudomonas spp. and Shewanella spp. existed on the anode. However, because MECs operate
under completely anaerobic conditions, both the obligate anaerobic bacteria, such as
exoelectrogenic Geobacter spp., and nonexoelectrogenic fermentative (or methanogenic
microorganisms) are promoted.
Usually, researchers enrich the bacterial community for a working MFC. The advantages
of this procedure are: (1) ensuring biofilm formation on the anode, (2) preselecting an
exoelectrogenic community for MECs operation. Moreover, the biofilm can be scraped from the
20
containing exoelectrogenic community (presumably displaced from the anode) can be used as an
inoculum.
Methanogenesis could be a problem in MECs, because high concentrations of hydrogen
gas favors the growth of hydrogenotrophic methanogens, which reduces hydrogen gas production
and contaminates the gas with methane. Three methods can be applied to suppress the growth of
methanogens, including: (1) lowering the environment pH by using a medium solution (pH 5.8)
containing phosphate buffer, (2) exposing the cathode to air for 15 min when the methane content
in the headspace was higher than 5%, (3) boiling the anodes from MFCs for 15 min before placing
them in MECs (Hu et al., 2008).
2.4 Modification of MEC design
2.4.1 Multi-electrode
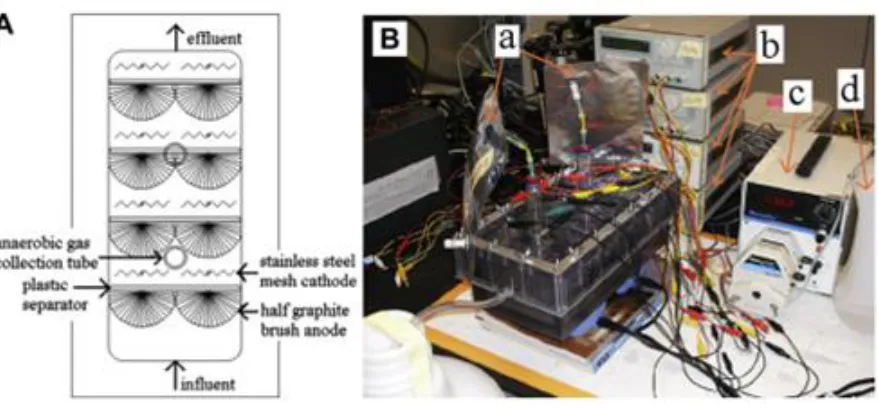
In order to examine the scalability of a multi-electrode MEC, Rader et al (2010) constructed
a 2.5 L single chamber MEC containing 8 separate electrode pairs made of graphite fiber brush
anodes pre-acclimated in MFC using acetate, and 304 stainless steel mesh cathodes (64 m2 m-3)
under continuous-flow conditions, as shown in Figure 2.4. A voltage of 0.9 V was applied across
each pair of electrodes using four separate power supplies. The liquid volume was controlled at ~
2.4 L to allow a headspace in the reactor for collection and analysis in the tubes. The MEC was
operated with a continuous-flow substrate flow at a flowrate of 1.67 mL min-1, a hydraulic retention
time (HRT) of 1 day, with acetic acid concentration of 1 g L-1. The maximum current was 181 mA
(1.18 A m-2 cathode surface area; 74 A m-3) with a maximum hydrogen production of 0.53 L L-1 d -1 in three days of operation. Current production remained almost steady (days 3-18), but the gas
composition dramatically shifted over time. The methane production increased from 0.049 L L-1
21
remained above 100% until day 17, with a maximum energy efficiency of 144% on day 3.
The maximum observed current density in the aforementioned study of 1.18 A m-2 is lower
than the current density achieved by Selembo et al (2009), of 4.6 A m-2, despite the use of the
similar electrode architecture due to two reasons: namely the use of plastic separators between the
electrodes, which may have inhibited proton diffusion from the anode to cathode, and a larger
electrode spacing.
Figure 2.4 – (A) Schematic (top view) and (B) photograph of the 2.5 L scale-up continuous-flow
microbial electrolysis cell containing 8 half graphite brush anodes and 8 stainless steel mesh
cathodes: (a) gas bag, (b) power sources, (c) fluid pump, and (d) substrate feed tank. (Rader et
al., 2010)
3.4.2 Gas-phase Cathodes
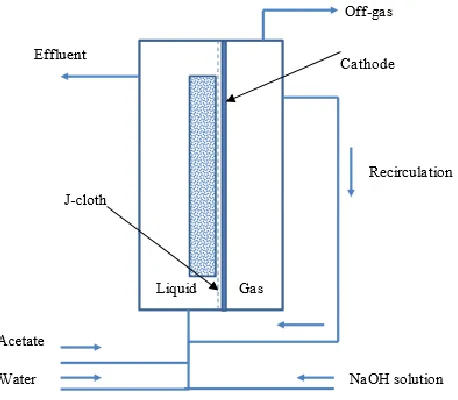
Tartakovsky et al (2009) developed a membrane-less continuous-flow microbial
electrolysis cell with a gas-collection cathode, as shown in Figure 2.5. This MEC was constructed
22
the performance of the MEC with a proton exchange membrane (PEM) and without PEM, and
also examined the effect of voltage on hydrogen production. The absence of PEM reduced the
internal resistance from 27 Ω to 19 Ω. At an acetate loading rate of 4 g LA-1 d-1, hydrogen
production rates of 1.0-1.3 LSTP LA-1d-1, and 6.1-6.5 LSTP LA-1d-1 were obtained in MEC with
membrane and MEC without membrane, respectively. These values are comparable with hydrogen
production rate of 1 L LA-1d-1 observed in a MEC equipped with a PEM (Rozendal et al., 2007)
and a rate of 3 L LA-1d-1 observed in a single chamber membrane-free MEC (Call & Logan, 2008).
Hydrogen production rate increased in response to the increase in voltage, at applied voltage
between 0.4 and 1.0 V. At an applied voltage of 1 V, a power input of 2 Wh L-1-H2, a hydrogen
yield of 3.9 mol mol-1-acetic acid, and a current density of 4.7 A m-2 was achieved.
Figure 2.5 – Diagram of a continuous-flow MEC setup. (Modified from Tartakovsky et al., 2009)
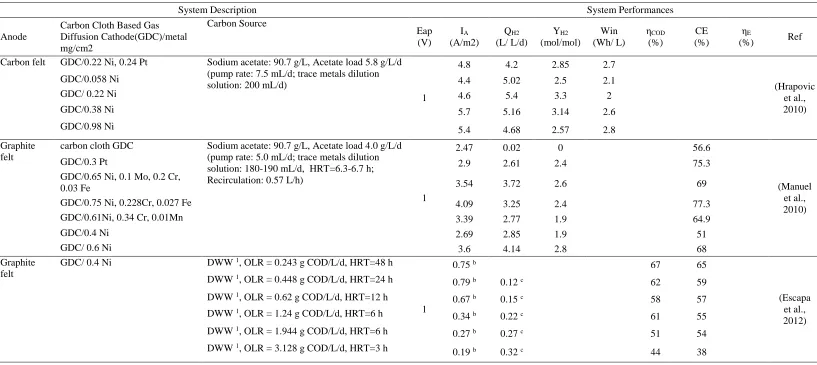
This MEC design was also used by Escapa et al. (2012) to test the effect of organic loading
23
wastewater, as shown in Table 2.3. A graphite felt anode and a Ni-based gas diffusion cathode
with a Ni load of 0.4 mg cm-2 cathode were used. J-cloth with a thickness of 0.7 mm was also used
in this MEC. At an organic loading rate of 441 mg LA-1 d-1 and applied voltage of 0.75 V, a
maximum of COD reduction of 76% was achieved in this reactor. H2 only evolved at organic
loading rates between 448 mg LA-1 d-1 and 1994 mg LA-1 d-1 at an applied voltage of 1 V. Hydrogen
production rate as a function of the organic loading rate fit a Monod-type model, with a maximum
hydrogen production constant of 0.462 L LA-1 d-1 and a half saturation coefficient of 1342 mg LA -1 d-1, and proved to be highly dependent on the influent COD.
The main advantage of this design is that hydrogen produced in the liquid chamber can be
directly released to the gas collection chamber due to lower mass transfer resistance compared
with the gas transfer through a liquid phase. The challenges of this design could be the cathode
leaking or flooding, and due to the absence of membranes, hydrogen could easily crossover from
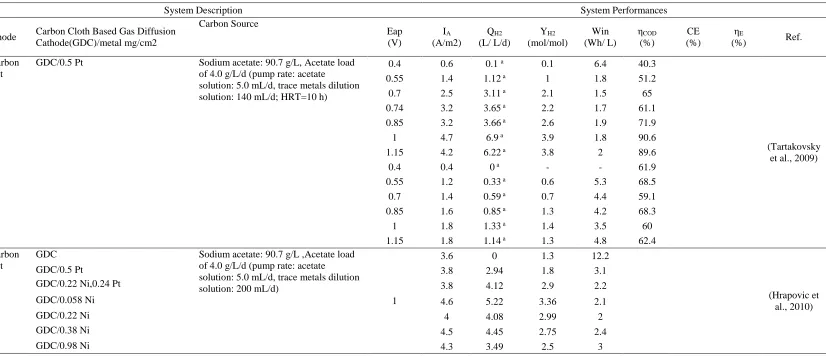
24 Table 2.3 Design and performance of MEC with gas-phase cathode in continuous-flow mode
System Description System Performances
Anode Carbon Cloth Based Gas Diffusion Cathode(GDC)/metal mg/cm2 Carbon Source Eap (V) IA (A/m2) QH2 (L/ L/d) YH2 (mol/mol) Win (Wh/ L) ηCOD (%) CE (%) ηE
(%) Ref.
Carbon felt
GDC/0.5 Pt Sodium acetate: 90.7 g/L, Acetate load of 4.0 g/L/d (pump rate: acetate
solution: 5.0 mL/d, trace metals dilution solution: 140 mL/d; HRT=10 h)
0.4 0.6 0.1 a 0.1 6.4 40.3
(Tartakovsky et al., 2009)
0.55 1.4 1.12 a 1 1.8 51.2
0.7 2.5 3.11 a 2.1 1.5 65
0.74 3.2 3.65 a 2.2 1.7 61.1
0.85 3.2 3.66 a 2.6 1.9 71.9
1 4.7 6.9 a 3.9 1.8 90.6
1.15 4.2 6.22 a 3.8 2 89.6
0.4 0.4 0 a - - 61.9
0.55 1.2 0.33 a 0.6 5.3 68.5
0.7 1.4 0.59 a 0.7 4.4 59.1
0.85 1.6 0.85 a 1.3 4.2 68.3
1 1.8 1.33 a 1.4 3.5 60
1.15 1.8 1.14 a 1.3 4.8 62.4
Carbon felt
GDC Sodium acetate: 90.7 g/L ,Acetate load of 4.0 g/L/d (pump rate: acetate
solution: 5.0 mL/d, trace metals dilution solution: 200 mL/d)
1
3.6 0 1.3 12.2
(Hrapovic et al., 2010)
GDC/0.5 Pt 3.8 2.94 1.8 3.1
GDC/0.22 Ni,0.24 Pt 3.8 4.12 2.9 2.2
GDC/0.058 Ni 4.6 5.22 3.36 2.1
GDC/0.22 Ni 4 4.08 2.99 2
GDC/0.38 Ni 4.5 4.45 2.75 2.4
25
Table 2.3 – (Continued) Design and performance of MEC with gas-phase cathode in continuous-flow mode
System Description System Performances
Anode
Carbon Cloth Based Gas Diffusion Cathode(GDC)/metal mg/cm2 Carbon Source Eap (V) IA (A/m2) QH2 (L/ L/d) YH2 (mol/mol) Win (Wh/ L) ηCOD (%) CE (%) ηE
(%) Ref
Carbon felt GDC/0.22 Ni, 0.24 Pt Sodium acetate: 90.7 g/L, Acetate load 5.8 g/L/d (pump rate: 7.5 mL/d; trace metals dilution solution: 200 mL/d)
1
4.8 4.2 2.85 2.7
(Hrapovic et al., 2010)
GDC/0.058 Ni 4.4 5.02 2.5 2.1
GDC/ 0.22 Ni 4.6 5.4 3.3 2
GDC/0.38 Ni 5.7 5.16 3.14 2.6
GDC/0.98 Ni 5.4 4.68 2.57 2.8
Graphite felt
carbon cloth GDC Sodium acetate: 90.7 g/L, Acetate load 4.0 g/L/d (pump rate: 5.0 mL/d; trace metals dilution solution: 180-190 mL/d, HRT=6.3-6.7 h; Recirculation: 0.57 L/h)
1
2.47 0.02 0 56.6
(Manuel et al., 2010)
GDC/0.3 Pt 2.9 2.61 2.4 75.3
GDC/0.65 Ni, 0.1 Mo, 0.2 Cr,
0.03 Fe 3.54 3.72 2.6 69
GDC/0.75 Ni, 0.228Cr, 0.027 Fe 4.09 3.25 2.4 77.3
GDC/0.61Ni, 0.34 Cr, 0.01Mn 3.39 2.77 1.9 64.9
GDC/0.4 Ni 2.69 2.85 1.9 51
GDC/ 0.6 Ni 3.6 4.14 2.8 68
Graphite felt
GDC/ 0.4 Ni DWW 1, OLR = 0.243 g COD/L/d, HRT=48 h
1
0.75 b
67 65
(Escapa et al., 2012) DWW 1, OLR = 0.448 g COD/L/d, HRT=24 h
0.79 b 0.12 c 62 59
DWW 1, OLR = 0.62 g COD/L/d, HRT=12 h
0.67 b 0.15 c 58 57
DWW 1, OLR = 1.24 g COD/L/d, HRT=6 h
0.34 b 0.22 c 61 55
DWW 1, OLR = 1.944 g COD/L/d, HRT=6 h
0.27 b 0.27 c 51 54
DWW 1, OLR = 3.128 g COD/L/d, HRT=3 h
26
Table 2.3 – (Continued) Design and performance of MEC with gas-phase cathode in continuous-flow mode
System Description System Performances
Anode Carbon Cloth Based Gas Diffusion Cathode(GDC)/metal mg/cm2
Carbon Source Eap (V) IA (A/m2) QH2 (L/ L/d) YH2 (mol/mol) EI (Wh/ L) ηCOD (%) CE (%) ηE
(%) Ref. Graphite
felt
GDC/ 0.4 Ni SWW 2, OLR = 6.4 g COD/L/d, HRT = 8 h
0.6
0.15 b 131.3 7.8
(Escapa et al., 2013)
0.8 0.58 b 18.7 107.6
1 0.98 b 23.3 94.3
SWW 2, OLR = 6.4 g COD/L/d, HRT=10 h
0.6 0.20 b 10.9 129.9
0.8 0.64 b 14.5 106.8
1 1.28 b 23.2 96.2
SWW 2, OLR = 6.4 g COD/L/d, HRT=12 h
0.6 0.23 b 6.9 127
0.8 0.76 b 16.1 106.4
1 1.42 b 24.5 97
a. calculated based on idea gas low, converted from data got at 273 K to 273.15 K b. data read from the figure in the paper
c. calculated based on the Monod equation provided in the paper DWW 1. domestic wastewater range from 391 to 486 mg/L COD
27
2.4.3 Up-flow continuous-flow system
Wang et al. (2012) developed a new membrane-free bioelectrochemical system, a
membrane-free named, biocatalyzed electrolysis reactor (UBER), where the influent
flows upwards through the cathode chamber that served primarily to mitigate inhibition
of ARB, as depicted in Figure 2.6. The aforementioned authors used carbon brush as the
anode, which was fixed on the upper portion of the reactor, and graphite granules as the
cathode, which was 2 cm below the anode chamber. To ensure even distribution of
up-flow fluid, two plates with even distribution holes were installed at the top and bottom of
the reactor. They used this reactor to reduce nitrobenzene (Rodriguez et al., 2002) with
acetate as the sole electron donor and carbon source. Nitrobenzene (NB) was efficiently
removed (>99%) with aniline as the major product (>80%) in the cathode. The aniline
can be degraded in natural ecosystems or wastewater treatment system under aerobic or
denitrifying condition (Alexandra De et al., 1994). The nitrobenzene removal rate was
3.5 mol m-3 d-1.The molar ratio of NB removed to acetate consumed varied from 4.3 ± 0.4 to 2.3 ± 0.1 mol mol-1, 3-6 times higher than the theoretical value. Additional energy
28
Figure 2.6 – Design of up-flow biocatalyzed electrolysis reactor (UBER). Left:
Schematic diagram of the system. Right: Laboratory scale reactor for NB reduction
(Wang et al., 2012)
Cui et al. (2012) also used the UBER to evaluate the reduction efficiency of azo
dyes and assess the effects of hydraulic retention time on decolourization efficiency of
azo dyes. Azo dyes were efficiently removed (94.8 ± 1.5%) at an HRT of 2 h and a loading
rate of 780 g of alizarin yellow r (AYR) m-3 d-1. The two main reductive products of azo
dyes, phenylenediamine and 5-aminosalicylic acid, were subsequently oxidized in their
lab scale aerobic biological oxidation reactor to simple acids and alcohols.
These results indicate the feasibility of the UBER as a single reactor with anodic
biological and cathodic electrochemical functions. The biggest advantage of this design
is the mitigation of toxicity to the electrogenic microorganism on the anode, since before
29
toxic forms in the lower cathode chamber. The greatest challenge of this reactor was
bacterial migration from the anode to the cathode caused by the lack of membrane. Even
though the migration rate is slow, further research needs to be conducted to examine
whether the biocathode could enhance the performance of this system.
2.4.4 Biocathode
Luo et al. (2014) studied a two-chamber MEC with sulfate reducing bacteria (SRB)
biocathode to explore the potential of treating sulfate-rich wastewater and evaluated batch
and continuous-flow performance. The schematic design of the aforementioned system is
shown in Figure 2.6. To acclimate the SRB, domestic wastewater was used as inoculum
and fed with sulfate medium in anaerobic batch reactors. The autotrophic SRB was
considered to be dominant in the wastewater when sulfate removal rate was stable. The
cathode chamber was filled with 1 g L-1 of sodium acetate medium while the catholyte
consisted of 100 mg L-1 sulfate medium. In the continuous-flow mode, the current density
reached 50 A m-3, and the sulfate reduction rate reached 5.81 ± 0.38 mg d-1 nearly 11 times
that of the fed-batch operation.
Figure 2.7 – Schematic diagram of the SRB-biocathode MEC. (Modified from Luo et al.,
30
Thrash et al (2007) also studied biocathodes by introducing dissimilatory
perchlorate reducing bacteria (DPRB) to the anode. They investigated the reduction of
perchlorate, which is a very stable contaminant, in the cathodic chamber of a bioelectrical
reactor. Both pure culture of DPRB and natural DPRB populations were tested in this
experiment. The results showed that Dechloromonas and Azospira species in the pure
culture of DPRB readily reduced 90 mg L-1 perchlorate in this system with
2,6-anthraquinone disulfonate (AQDS) as a mediator. When a natural microbial community
was inoculated into the fed-batch bioelectrical reactor, a novel DPRB, strain VDY, was
isolated which readily reduced perchlorate in a mediator-less reactor. In the
continuous-flow up-continuous-flow mode, perchlorate removal efficiency reached 95% at a perchlorate loading
rate of 60 mg L-1 day-1. These results demonstrated the potential for application of
bioelectrical reduction for the treatment of perchlorate contamination.
2.5 Combined processes
The anaerobic baffled reactor (ABR) a series of up-flow anaerobic sludge bed
(UASB) reactors may potentially play an important role in wastewater treatment. Ran et
al. (2014) developed a new process to enhance the stability and efficiency of ABR by
combining it with MECs, as shown in Figure 2.8. The lab scale ABR (3.46 L) was divided
into four equal compartments by vertical baffles. The anode and cathode were fixed in
the last three compartments with an applied voltage of 0.9 V and an HRT of 24 h. The
influent COD ranged from 1200 mg L-1 to 3500 mg L-1 with glucose as substrate. This
combined reactor generated both methane and hydrogen, with the hydrogen fraction of
biogas in the first compartment of 20.7% and methane content of 98.8%, 93.6% and 70.1%
31
Figure 2.8 – The structure of anaerobic baffled reactor combining with microbial
electrolysis cells. (Modified from Ran et al., 2014)
2.6 Pilot-scale continuous-flow microbial electrolysis cell
A pilot-scale (1,000 L) continuous-flow microbial electrolysis cell was
constructed and tested for current generation and COD removal with winery wastewater
(Cusick et al., 2011). The reactor contained 144 electrode pairs in 24 modules with applied
voltage of 0.9 V. The anode were made of heat treated graphite fiber brushes, and the
cathode were stainless steel mesh. SCOD removal efficiency reached 62% at an HRT of
1 day. The maximum current density reached 7.4 A m-3 after 100 days, with a maximum
gas production rate of 0.19 ± 0.04 L L-1 d -1, containing 86% of methane.
Heidrich et al. (2014) operated a 100 L MEC for 12 month fed with raw domestic
wastewater at ambient temperatures ranging from 1 °C to 22 °C, producing an average of
0.6 L d-1 of hydrogen. The MEC reactor contained 6 individual electrolysis cell and were
32
corresponding to a hydraulic retention time of 1 day with an influent COD ranging
between 147 and 1976 mg L-1. The aforementioned authors found that there was a
reduction in the total volume of hydrogen produced throughout the period, from July to
December, an average of 0.8 L d-1 of hydrogen was produced, while from December to
June, an average of 0.4 L d-1 hydrogen production was achieved. COD removal efficiency
was highly variable, sometimes reaching over 60%, sometimes lower than 30%. The
aforementioned authors also found that to maintain the MEC working in ambient
temperature, microbial cultures from the local wastewater treatment plant should be used
as the seed since they were already adapted to the ambient temperatures.
The two main challenges of the scaled-up process are the slow start-up time,
requiring as long as 60 days for the exoelectrogenic biofilm to develop and grow on the
anode, and the low hydrogen production.
2.7 Summary
Microbial electrolysis cell (MEC) is a very promising technology, since it can
convert organic waste to hydrogen with only a small energy input. There are several
parameters that can affect the performance of the MEC, such as the materials being used
(e.g., anode, cathode, and membrane); the MEC configuration; substrate composition; the
applied voltage; the controlled anode potential; as well as the feeding mode (batch or
continuous mode). Carbon, low price metals, and anion exchange membrane are widely
used materials for anode, cathode and membrane, respectively. While traditionally MECs
have been run in a fed-batch mode, the application of the MEC to operate in
continuous-flow mode has become very popular, which includes combining MEC with other
wastewater treatment processes, increasing number of anode electrodes to increase the
33
chamber, etc. The continuous-flow mode can help MEC achieve better performance than
batch mode since the organic loading rate can be controlled to preclude substrate
limitations.
Running the MECs in continuous-flow mode is a fundamental step for the
scalability of MEC technology. The main challenge for MECs scaling up is to achieve
higher hydrogen production rate with lower energy input. To overcome the challenge and
commercialize the MEC technology will require the development of effective ARBs,
efficient cathode electrode materials, minimization of the internal losses which refers to
the modification of the MEC architecture, and also integration of different wastewater
treatment processes with MECs.
2.7 Reference
1. Alexandra De, M., O'Connor, O.A., Kosson, D.S. 1994. Metabolism of aniline under
different anaerobic electron-accepting and nutritional conditions. Environ. Toxicol.
Chem., 13, 233-239.
2. Call, D., Logan, B.E. 2008. Hydrogen production in a single chamber microbial
electrolysis cell lacking a membrane. Environ. Sci. Technol., 42, 3401-3406.
3. Cheng, S., Logan, B.E. 2007. Ammonia treatment of carbon cloth anodes to enhance
power generation of microbial fuel cells. Electrochem. Commun., 9, 492-496.
4. Cui, D., Guo, Y.-Q., Cheng, H.-Y., Liang, B., Kong, F.-Y., Lee, H.-S., Wang, A.-J.
2012. Azo dye removal in a membrane-free up-flow biocatalyzed electrolysis reactor
34
5. Cusick, R.D., Ullery, M.L., Dempsey, B.A., Logan, B.E. 2014. Electrochemical
struvite precipitation from digestate with a fluidized bed cathode microbial electrolysis
cell. Water Res., 54, 297-306.
6. Cusick, D.R., Bryan, B., Parker, D.S., Merrill, M.D., Mchanna, M., Diely, P.D., Liu,
G., Logan, B.E., 2011. Performance of a pilot-scale continuous flow microbial
electrolysis cell fed winery wastewater. Bioenergy and Biofuels., 89, 2053-2063.
7. Dennis, P.G., Guo, K., Imelfort, M., Jensen, P., Tyson, G.W., Rabaey, K. 2013. Spatial
uniformity of microbial diversity in a continuous bioelectrochemical system. Bioresour.
Technol., 129, 599-605.
8. Dhar, B.R., Gao, Y., Yeo, H., Lee, H.-S. 2013. Separation of competitive
microorganisms using anaerobic membrane bioreactors as pretreatment to microbial
electrochemical cells. Bioresour. Technol., 148, 208-214.
9. Escapa, A., Gil-Carrera, L., García, V., Morán, A. 2012. Performance of a continuous
flow microbial electrolysis cell (MEC) fed with domestic wastewater. Bioresour.
Technol., 117, 55-62.
10. Escapa, A., Lobato, A., García, D., Morán, A. 2013. Hydrogen production and COD
elimination rate in a continuous flow microbial electrolysis cell: The influence of
hydraulic retention time and applied voltage. Environmental Progress & Sustainable
Energy, 32, 263-268.
11. Gorby, YA., Yamina, S., Mclean JS et al. 2006. Electrically conductive bacterial
nanowires produced by Shewanella oneidensis strain MR-1 and other microorganisms. P.
35
12. Gusseme, B.D., Soetaert, M., Hennebel, T., Vanhaecke, L., Boon, N., Verstraete, W.
2012. Catalytic dechlorination of diclofenac by biogenic palladium in a microbial
electrolysis cell. Microbial biotechnology, 5, 396-402.
13. Hernandez, ME., Kappler, A, Newman, DK., 2004. Phenazines and other redox-active
antibiotics promote microbial mineral reduction. Appl. Environ. Microb. 20, 921-928.
14. Hrapovic, S., Manuel, M.-F., Luong, J., Guiot, S., Tartakovsky, B. 2010.
Electrodeposition of nickel particles on a gas diffusion cathode for hydrogen production
in a microbial electrolysis cell. Int. J. Hydrogen Energy, 35, 7313-7320.
15. Hu, H., Fan, Y., Liu, H. 2008. Hydrogen production using single-chamber
membrane-free microbial electrolysis cells. Water Res. 42, 4172-4178.
16. Hu, H., Fan, Y., Liu, H. 2009. Hydrogen production in single-chamber tubular
microbial electrolysis cells using non-precious-metal catalysts. Int. J. Hydrogen Energy,
34, 8535-8542.
17. Jeremiasse, A.W., Hamelers, H.V., Saakes, M., Buisman, C.J. 2010. Ni foam cathode
enables high volumetric H 2 production in a microbial electrolysis cell. Int. J. Hydrogen
Energy, 35, 12716-12723.
18. Kadier, A., Simayi, Y., Kalil, M.S., Abdeshahian, P., Hamid, A.A. 2014. A review of
the substrates used in microbial electrolysis cells (MECs) for producing sustainable and
36
19. Kundu, A., Sahu, J.N., Redzwan, G., Hashim, M. 2013. An overview of cathode
material and catalysts suitable for generating hydrogen in microbial electrolysis cell. Int.
J. Hydrogen Energy, 38, 1745-1757.
21. Lee, H.-S., Rittmann, B.E. 2009. Significance of biological hydrogen oxidation in a
continuous single-chamber microbial electrolysis cell. Environ. Sci. Technol., 44,
948-954.
22. Lee, H.-S., Vermaas, W.F., Rittmann, B.E. 2010. Biological hydrogen production:
prospects and challenges. Trends Biotechnol., 28, 262-271.
23. Liu, W., Wang, A., Ren, N., Zhao, X., Liu, L., Yu, Z., Lee, D., 2008.
Electrochemically assisted biohydrogen production from acetate. Energy Fuels. 22,
159-163
24. Liu, H., Hu, H., Chignell, J., Fan, Y. 2010. Microbial electrolysis: novel technology
for hydrogen production from biomass. Biofuels, 1, 129-142.
25. Logan, B.E., 2008a. Microbial Fuel Cells. John Wiley and Sons, Inc., Hoboken, New
Jersey.
26. Logan, B.E., Call, D., Cheng, S., Hamelers, H.V., Sleutels, T.H., Jeremiasse, A.W.,
Rozendal, R.A. 2008b. Microbial electrolysis cells for high yield hydrogen gas
production from organic matter. Environ. Sci. Technol., 42, 8630-8640.
27. Luo, H., Fu, S., Liu, G., Zhang, R., Bai, Y., Luo, X. 2014. Autotrophic biocathode for
high efficient sulfate reduction in microbial electrolysis cells. Bioresour. Technol., 167,
37
28. Manuel, M.-F., Neburchilov, V., Wang, H., Guiot, S., Tartakovsky, B. 2010.
Hydrogen production in a microbial electrolysis cell with nickel-based gas diffusion
cathodes. J. Power Sources, 195, 5514-5519.
29. Nam, J.-Y., Tokash, J.C., Logan, B.E. 2011. Comparison of microbial electrolysis
cells operated with added voltage or by setting the anode potential. Int. J. Hydrogen
Energy, 36, 10550-10556.
30. Nam, J.Y., Yates, M.D., Zaybak, Z., Logan, B.E. 2014. Examination of protein
degradation in continuous flow, microbial electrolysis cells treating fermentation
wastewater. Bioresour. Technol., 171, 182-186.
30. Newman DK, Kolter R., 2000. A role for excreted quinones in extracecullar electron
transfer. Nature. 405, 94-94.
31. Rabaey, K., Van de Sompel, K., Maignien, L., Boon, N., Aelterman, P., Clauwaert,
P., De Schamphelaire, L., Pham, H.T., Vermeulen, J., Verhaege, M. 2006. Microbial fuel
cells for sulfide removal. Environ. Sci. Technol. 40, 5218-5224.
32. Rader, G.K., Logan, B.E. 2010. Multi-electrode continuous flow microbial
electrolysis cell for biogas production from acetate. Int. J. Hydrogen Energy, 35,
8848-8854.
33. Ran, Z., Gefu, Z., Kumar, J.A., Chaoxiang, L., Xu, H., Lin, L. 2014. Hydrogen and
methane production in a bio-electrochemical system assisted anaerobic baffled reactor.