293 | P a g e
PREDICTION OF CORONARY ARTERY DISEASE
USING GENETIC ALGORITHM BASED FEATURE
SELECTION AND RANDOM FOREST CLASSIFIER
Varuna S
1, Revathi K
2, Nagamani T
31,2,3
Assistant Professor, Department of Computer Science and Engineering,
Bannari Amman Institute of Technology,(India)
ABSTRACT
Coronary Artery Disease (CAD) is one of the most prevalent diseases, which can lead to disability and sometimes even death. Diagnostic procedures of CAD are typically invasive, although they do not satisfy the required accuracy. Hence machine learning methods can be used, so that diagnosis can be made faster and with improved accuracy. There are many features that need to be taken into consideration for any disease prediction, which increases the processing time. Hence feature selection mechanisms can be used to reduce the number of features and then the diagnosis can be made. The first step involves feature selection done using Genetic Algorithm (GA) and the second step involves classification which is done using Random Forest (RF) classifier.
Keywords–Coronary Artery Disease, Genetic Algorithm, Machine Learning, Random Forest
Classifier
I. INTRODUCTION
Coronary Artery Disease (CAD) has become one of the most commonly occurring diseases in the world and has increasing trend in its incidence in future [1]. CAD occurs when the fatty deposits block the blood flow to the heart in the coronary arteries. CAD has multi-factorial causes with many of the risk factors influenced by lifestyle. Although it has now become a much familiar disease, the death rate is high due to the lack of awareness among the people. Generally the patients neglect the symptoms at earlier stage and they only consult medical experts when those symptoms become severe. But the treatment gets complicated at a later stage and sometimes due to the severity of the disease, the patients die before getting proper medication.
294 | P a g e
A large number of features can surpass the number of instances themselves [3]. This can increase the risk of taking redundant or correlated attributes into account which can lead to lower classification accuracy. Many researchers have attempted to solve the problems of data reduction in the diagnosis of CAD. Babaoglu et al. [4] performed data reduction by using principal component analysis (PCA). Rajeswari [5] used the Artificial Neural Network (ANN) to reduce features in the improvement of accuracy. The process of data reduction can also be done by selecting the features that affect the performance of the diagnosis of CAD. Zuo et al. [6] used a feature selection algorithm based on Markov Blanket and information gain to classify the syndrome of CAD. Khemphila and Boonjing [7] used information gain for feature selection and ANN to classify the heart disease. The results reported in these studies indicate that feature selection can improve the accuracy and computational efficiency. The research work shows that feature selection done with Genetic Algorithm (GA) can improve the performance in the diagnosis of CAD.The main objective of our work is to diagnose CAD with reduced number of attributes. Fourteen attributes are involved in predicting heart disease. But these attributes are reduced to seven attributes by using Genetic Algorithm (GA). Subsequently classifiers [8] like Naive Bayes, C4.5, Support Vector Machine, Multi-Layer Perceptron and Decision Tree [9] are used in the diagnosis of heart disease after feature selection and their results are compared. People are prone to making mistakes during analysis when trying to correlate multiple features. This makes it strenuous for them to find solutions to certain problems. Hence Machine Learning (ML) can be successfully applied to such problems, which can improve the efficiency of systems.
II.RELATED WORKS
An extension of Naive Bayes for robust classifications for small datasets is One Dependency Augmented Naïve Bayes classifier (ODANB) and Naive Credal Classifier 2 (NCC2) [10]. The NCC2 classifier extracts or discovers hidden information that could answer complex queries in predicting heart attack.
Classification techniques are useful for XML documents to read and understand the coded information. Since XML contains metadata in forms of tags and attributes, it has major advantage over HTML or Plain text. Considering various datasets decision tree classification algorithm [11] gives the best accuracy in a minimum span of time.
On a comparative study of four feature selection techniques namely decision tree algorithm, BayesNet, k-Nearest Neighbor and ANN [12] the classified instance of decision tree algorithm gives efficient results. On comparing the Weighted Support Vector Machine (WSVM) [13] to a standard SVM and other SVMs shows that WSVM outperforms the existing approaches in terms of F-measure and useful for relaxing the class-imbalance problem. The SVM enables us to pay more attention to instances in the overlapped region, i.e., near the decision boundary. With WSVM, the accuracy of classification is given more attention. Whereas the misclassified objects are not easy to classify a large dataset using Bounded Support Vector (BSV)[14] or Support Vector(SV).
295 | P a g e
of part Himalayan area have been constructed and validated. This technique gives better result than the ensemble methods in less number of iterations.C4.5 [16] gives better accuracy with small values. For Multi-Objective Evolutionary Algorithm, the C4.5 decision tree algorithm acts as a base classifier in wrapper approach is used for searching the parameters. This proposal has been contrasted versus several state-of-the-art solutions on imbalanced classification [17] showing excellent results in both binary and multi-class problems.
III. METHODOLOGY
3.1.Dataset Description
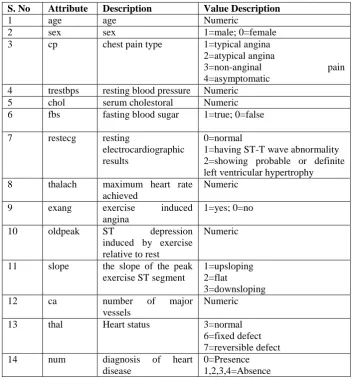
The data set is taken from the UCI Machine Learning Repository [18]. The system is trained and tested using Cleveland datasets. While the databases have 76 raw attributes, only 14 of them are literally used.
S. No Attribute Description Value Description
1 age age Numeric
2 sex sex 1=male; 0=female
3 cp chest pain type 1=typical angina
2=atypical angina
3=non-anginal pain
4=asymptomatic 4 trestbps resting blood pressure Numeric
5 chol serum cholestoral Numeric
6 fbs fasting blood sugar 1=true; 0=false
7 restecg resting
electrocardiographic results
0=normal
1=having ST-T wave abnormality 2=showing probable or definite left ventricular hypertrophy 8 thalach maximum heart rate
achieved
Numeric
9 exang exercise induced
angina
1=yes; 0=no
10 oldpeak ST depression
induced by exercise relative to rest
Numeric
11 slope the slope of the peak exercise ST segment
1=upsloping 2=flat
3=downsloping
12 ca number of major
vessels
Numeric
13 thal Heart status 3=normal
6=fixed defect 7=reversible defect
14 num diagnosis of heart
disease
0=Presence 1,2,3,4=Absence
Table 1 Features of the dataset
296 | P a g e
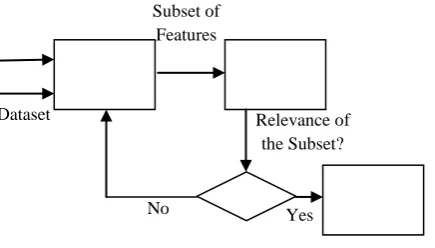
3.2.Data Flow Diagram
Fig. 1 Data Flow Diagram
The system design illustrates the finding of best method for correctives of coronary artery disease. The steps are adorned below.
Initially the raw medical dataset is taken from the UCI Machine Learning Repository. A subset of features is selected using Genetic Algorithm in the next step.
The selected features are given as input to the classification algorithm.
Finally the random forest classifier is used to find the meticulous result with minimum span time.
3.3.Feature Selection using Genetic Algorithm
Feature selection is the process of selecting a subset of related attributes that are used for further processing. The main purpose of feature selection is to avoid large number of features which in turn increases the accuracy. Feature selection is mainly used for removing irrelevant features in the dataset.
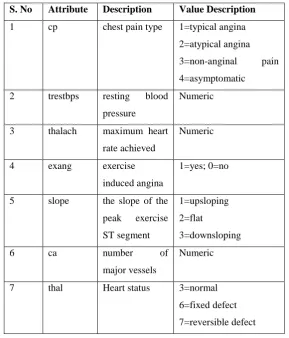
Fig. 2 Feature Selection Process
The procedure for generation allows, in every iteration, to generate a subset of attributes that will be evaluated in the second step of the selection procedure. There are various methods for subset generation like Breath First Search, random search, Depth First Search and hybrid search. Here we use genetic search for subset selection. According to the evaluation criteria used in the selection process of attributes, we can distinguish between wrapper approaches and filter approaches. Wrapper Approaches use the classification accuracy rate as evaluation criteria [20]. Filter Approaches use an evaluation function based on the characteristics of the dataset, regardless of any classification algorithm, to select certain attributes or a subset of attributes [21][22]. A GA wrapped Naïve Bayes approach is used as the evaluation criterion for feature selection. By the end of this phase, 7 features are selected from a set of 14 features in the original dataset.
Yes Subset of
Features
Relevance of the Subset? Dataset
No
Input Dataset
Genetic Algorithm
Reduced Dataset
Random Forest
297 | P a g e
S. No Attribute Description Value Description1 cp chest pain type 1=typical angina 2=atypical angina 3=non-anginal pain 4=asymptomatic 2 trestbps resting blood
pressure
Numeric
3 thalach maximum heart rate achieved
Numeric
4 exang exercise
induced angina
1=yes; 0=no
5 slope the slope of the peak exercise ST segment
1=upsloping 2=flat
3=downsloping
6 ca number of
major vessels
Numeric
7 thal Heart status 3=normal
6=fixed defect 7=reversible defect
Table 2 Features Selected using GA wrapped Naïve Bayes approach
3.4 Classification using Random Forest
The Random Forest (RF) algorithm [23] has become very popular for pattern recognition in omics-scale data, mainly because RF provides two aspects that are very important for data mining: high prediction accuracy and information on variable importance for classification. The prediction performance of RF compares well to other classification algorithms [24] such as SVM [25, 26], ANN [27,28], Bayesian classifiers [29,30], logistic regression [31], k-Nearest-Neighbours [32] and decision trees. SVM and RF are arguably the most widely used classification techniques in the Life Sciences.
The advantages of Random Forest are: Produces high accuracy for many datasets. Runs efficiently on large databases.
Gives estimates of what variables are important in the classification.
It has an effective method for estimating missing data and maintains accuracy when a large proportion of the data are missing.
298 | P a g e
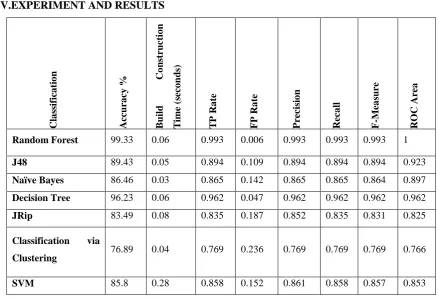
Table 3 provides the results obtained from various classification techniques.Accuracy - Percentage of test set tuples that are correctly classified
(1) Build Time - Time taken to generate the rules.
TP Rate - Sensitivity in some fields measures the proportion of actual positives which are correctly identified. FP Rate - Reducing the false positive rate improves the performance of the system.
Precision -Fraction of relevant instances among the retrieved instances
Recall - Fraction of relevant instances that have been retrieved over total relevant instances in the image F-Measure - A consolidation of precision and recall are the F-measure
(2)
ROC Area- ROC analysis provides tools to select possibly optimal models and to discard suboptimal ones independently from (and prior to specifying) the cost context or the class distribution
It is observed that Random Forest classifier provides greater accuracy when compared with other classification techniques. Even though the time required to build the model is not least for Random Forest, it consumes lesser build time than most other classification algorithms.
IV.EXPERIMENT AND RESULTS
Cla ss if ica tio n Acc ura cy % B uil d Co ns truct io n T ime ( sec o n ds ) T P Ra te F P Ra te P re cisi o n Rec a ll F -M ea sure RO C Are a
Random Forest 99.33 0.06 0.993 0.006 0.993 0.993 0.993 1
J48 89.43 0.05 0.894 0.109 0.894 0.894 0.894 0.923
Naïve Bayes 86.46 0.03 0.865 0.142 0.865 0.865 0.864 0.897
Decision Tree 96.23 0.06 0.962 0.047 0.962 0.962 0.962 0.962
JRip 83.49 0.08 0.835 0.187 0.852 0.835 0.831 0.825
Classification via
Clustering 76.89 0.04 0.769 0.236 0.769 0.769 0.769 0.766
SVM 85.8 0.28 0.858 0.152 0.861 0.858 0.857 0.853
299 | P a g e
V.CONCLUSION
An integration of GA wrapped Naïve Bayes approach with Random Forest classifier is used for the prediction of Coronary Artery Disease. Feature selection is applied for the 14 features from the original dataset, from which 7 features are selected. The selected features were given to seven classification algorithms namely random forest, J48, naïve bayes, decision tree, JRip, classification via clustering and SVM. In this paper, it is identified that Random Forest classifier surpasses other classification algorithms in terms of accuracy, build time, true positive rate, false positive rate, precision, recall, F-measure and ROC area.
REFERENCES
[1] Pal, Debabrata, K. M. Mandana, Sarbajit Pal, Debranjan Sarkar, and Chandan Chakraborty, Fuzzy expert system approach for coronary artery disease screening using clinical parameters, Knowledge-Based
Systems, 36, 2012, 162-174.
[2] Setiawan, Noor Akhmad, Dwi Wahyu Prabowo, and Hanung Adi Nugroho, Benchmarking of feature selection techniques for coronary artery disease diagnosis, Information Technology and Electrical
Engineering (ICITEE), 2014 6th International Conference on. IEEE, 2014.
[3] Mokeddem, Sidahmed, Baghdad Atmani, and Mostéfa Mokaddem, Supervised feature selection for diagnosis of coronary artery disease based on genetic algorithm, arXiv preprint arXiv:1305.6046, 2013. [4] I. Babaolu, O. Fndk, and M. Bayrak, Effects of principle component analysis on assessment of coronary
artery diseases using support vector machine, Expert Systems with Applications, 37(3), 2010, 2182–2185. [5] K. Rajeswari, V. Vaithiyanathan, and T. R. Neelakantan, Feature Selection in Ischemic Heart Disease
Identification using Feed Forward Neural Networks, Procedia Engineering, 41, 2012, 1818–1823.
[6] X. Zuo, P. Lu, X. Liu, Y. Gao, Y. Yang, and J. Chen, An improved feature selection algorithm based on Markov blanket, In Biomedical Engineering and Informatics (BMEI), 3, 2011, 1645–1649.
[7] A. Khemphila and V. Boonjing, Heart Disease Classification Using Neural Network and Feature Selection,
In Systems Engineering (ICSEng),2011, 406–409.
[8] Kesavaraj, G., and S. Sukumaran, A study on classification techniques in data mining, Computing,
Communications and Networking Technologies (ICCCNT), 2013 Fourth International Conference on. IEEE,
2013.
[9] Patel, S. B., Yadav, P. K., & Shukla, D. D, Predict the diagnosis of heart disease patients using classification mining techniques, IOSR Journal of Agriculture and Veterinary Science (IOSR-JAVS), 4(02), 2013, 61-64.
[10] K.Srinivas , B.Kavita Rani, Dr. A.Govardhan, Applications of Data Mining Techniques in Healthcare and Prediction of Heart Attacks , International Journal on Computer Science and Engineering, 2(2), 2010, 250-255.
[11] Megha Gupta and Naveen Aggarwal, Classification techniques Analysis, NCCI 2010 -National Conference
300 | P a g e
[12] Coussement, Kristof, Stefan Lessmann, and Geert Verstraeten, A comparative analysis of data preparationalgorithms for customer churns prediction: A case study in the telecommunication industry, Decision
Support Systems, 95, 2017, 27-36.
[13] Lee, Wonji, Chi-Hyuck Jun, and Jong-Seok Lee, Instance categorization by support vector machines to adjust weights in AdaBoost for imbalanced data classification, Information Sciences, 381, 2017, 92-103. [14] Khemchandani, Reshma, and Suresh Chandra, Twin Support Vector Machines (TWSVM) for
Classification, Twin Support Vector Machines, Springer International Publishing, 2017, 43-62.
[15] Pham, Binh Thai, Dieu Tien Bui, Indra Prakash, and M. B. Dholakia, Hybrid integration of Multilayer Perceptron Neural Networks and machine learning ensembles for landslide susceptibility assessment at Himalayan area (India) using GIS, Catena, 149, 2017, 52-63.
[16] Fernández, Alberto, Cristobal José Carmona, Marıa José del Jesus, and Francisco Herrera, A Pareto Based Ensemble with Feature and Instance Selection for Learning from Multi-Class Imbalanced Datasets, International Journal of Neural Systems, 2017.
[17] Krell, Mario Michael, Nils Wilshusen, Anett Seeland, and Su Kyoung Kim, Classifier transfer with data selection strategies for online support vector machine classification with class imbalance, Journal of Neural
Engineering, 14(2), 2017, 025003.
[18] Newman, D.J, Hettich, S, Blake C.L, Merz, C.J, UCI repository of machine learning databases,
Department of Information and Computer Science, University California Irvine, 1998.
[19] Zhu, W, Zeng, N, Wang, N, Sensitivity, specificity, accuracy, associated confidence interval and roc analysis with practical SAS implementations, NESUG Proceedings: Health Care and Life Sciences, Baltimore, Maryland, 2010.
[20] R.Kohavi and G. John., Wrappers for feature subset selection, Artificial Intelligence, 1997, 273–324. [21] He, Xiaofei, Deng Cai, and Partha Niyogi., Laplacian score for feature selection, In Proceedings of the
Advances in Neural Information Processing Systems NIPS 05, Vancouver, Canada, 2005, 507–514.
[22] Talavera L, Feature selection as a preprocessing step for hierarchical clustering, In Proceedings of the 16th
International Conference on Machine Learning ICML 99, Bled, Slovenia, 1999, 433–443.
[23] Breiman Leo, Random Forests, Machine Learning, 45(1), 2001, 5-32.
[24] Verikas, Antanas, Adas Gelzinis, and Marija Bacauskiene, Mining data with random forests: A survey and results of new tests, Pattern Recognition, 44(2), 2011, 330-349.
[25] Boser BE, Guyon IM, Vapnik VN, A training algorithm for optimal margin classifiers, In: Proceedings of
the fifth annual workshop on Computational learning theory, ACM, 1992, 144-52.
[26] Cortes C, Vapnik , Support-vector networks, Machine Learning, 20(3), 1995, 273-97.
[27] McCulloch WS, Pitts W. A, Logical calculus of the ideas immanent in nervous activity, The bulletin of
mathematical biophysics, 5(4), 1943, 115-33.
[28] Rumelhart DE, Hinton GE, Williams RJ, Learning representations by back-propagating errors, Cognitive
modelling, 5(3), 1988, 1.
[29] Friedman N, Geiger D, Goldszmidt M, Bayesian network classifiers, Machine Learning, 29(2-3), 1997, 131-63.
301 | P a g e
[31] Kleinbaum DG, Kupper LL, Chambless LE, Logistic regression analysis of epidemiologic data: theory andpractice, Communications in Statistics-Theory and Methods, 11(5), 1982, 485-547.
[32] Fix, Evelyn, and Joseph Lawson Hodges, Discriminatory analysis-nonparametric discrimination: consistency properties, International Statistical Review/Revue Internationale de Statistique,