Scholarship@Western
Scholarship@Western
Electronic Thesis and Dissertation Repository
9-4-2014 12:00 AM
Dietary Sodium and Hypertension Status: A Quantitative Study
Dietary Sodium and Hypertension Status: A Quantitative Study
Exploring Older Adults’ Food Purchasing and Consumption
Exploring Older Adults’ Food Purchasing and Consumption
Behaviour
Behaviour
Asma Aktar
The University of Western Ontario
Supervisor Dr. Alan Salmoni
The University of Western Ontario
Graduate Program in Health and Rehabilitation Sciences
A thesis submitted in partial fulfillment of the requirements for the degree in Master of Science © Asma Aktar 2014
Follow this and additional works at: https://ir.lib.uwo.ca/etd
Part of the Dietetics and Clinical Nutrition Commons
Recommended Citation Recommended Citation
Aktar, Asma, "Dietary Sodium and Hypertension Status: A Quantitative Study Exploring Older Adults’ Food Purchasing and Consumption Behaviour" (2014). Electronic Thesis and Dissertation Repository. 2410.
https://ir.lib.uwo.ca/etd/2410
This Dissertation/Thesis is brought to you for free and open access by Scholarship@Western. It has been accepted for inclusion in Electronic Thesis and Dissertation Repository by an authorized administrator of
Behaviour
(Thesis format: Integrated-Article)
by
Asma, Aktar
Graduate Program in Health and Rehabilitation Science
A thesis submitted in partial fulfillment of the requirements for the degree of
Master of Science
The School of Graduate and Postdoctoral Studies The University of Western Ontario
London, Ontario, Canada
ii
Objectives: The purpose of the study was to investigate the relation between hypertension (HTN) status and the amount of sodium purchased and consumed by community dwelling older adults. The secondary objective was to compare their adherence with the DASH dietary pattern according to hypertension status.
Method: A dietary survey of 30 community dwelling older adults was conducted. The amount of daily sodium purchased and consumed, DASH score and DASH adherence were compared between the hypertensive and normotensive older adults using grocery receipts and 24-hour dietary recall. Participants’ knowledge, concern and behaviour regarding dietary sodium were also assessed using a researcher administered study questionnaire.
Result: There was no significant difference in both the amount of sodium purchased (p = 0.07) and consumed (p = 0.61) by the older adults with and without hypertension. Older adults with HTN had significantly lower DASH scores (DASH score = 1.8) than those without HTN (DASH score = 4.3) (p < 0.001), with only 6.3% of HTN adults considered as DASH accordant. Participants’ knowledge and concern regarding dietary sodium did not show any meaningful relationship with the amount of sodium purchased and consumed.
Conclusion: This study implied a need for more established guidelines regarding reduction of sodium content of processed, pre-packaged and restaurants foods in the Canadian food supply. The need for further involvement of health professionals regarding dietary modification to prevent and manage hypertension in addition to greater public health effortsis also apparent from the findings of the study.
iii
My sincere gratitude goes to the people whose support and direction made my
dissertation possible.
First and foremost, I would like to express sincere gratitude to my supervisor, Dr. Alan Salmoni, for giving me the opportunity to work on my desired project. I am thankful to him for guiding and challenging my thinking throughout my master’s program and
dissertation process. I greatly appreciate his suggestions and continuous encouragement
throughout the process.
My deepest thanks go to my other committee members, Dr. Danielle Battram and Dr.
Colleen O’Connor for their continued insight and guidance in improving the finished
product.
My sincere appreciation goes to Dr. Michelle Mottola not only for allowing me to work
in her lab but also for inspiring me through her affectionate support.
I am also very grateful to the older adults who participated in this research, their
unconditional dedication made this dissertation possible.
I am especially grateful to my parents, Akter Jahan & Reaz Uddin Ahmed, for their unconditional love, prayers and contribution towards my many years of education.
Finally, I would like to thank my husband for constantly encouraging me towards
achieving higher education.
Asma Aktar
iv
ABSTRACT ... ii
ACKNOWLEDGMENTS ... iii
TABLE OF CONTENTS ... iv
LIST OF TABLES ... vii
LIST OF FIGURES ... viii
CHAPTER 1 Introduction... 1
CHAPTER 2 Literature Review ... 5
2.1 Hypertension ... 5
2.2 Aging and Increased Risk of Hypertension ... 5
2.3 Dietary Sodium and Hypertension ... 7
2.4 Sources of Sodium in the Canadian Diet ... 9
2.5 Canadian Guidelines for Hypertension Management ... 10
2.6 Research Investigating Knowledge, Concern and Behaviours Related to Sodium 12 2.7 Food Label Use by Canadians ... 13
2.8 Food Purchasing and Consumption Behaviour of Older Adults ... 15
CHAPTER 3 Scope of Research ... 19
v
4.1 Introduction ... 21
4.2 Methods ... 24
4.2.1 Participants ... 24
4.2.2 Instruments and Procedure ... 25
4.2.3 Statistical analyses ... 29
4.3 Results ... 30
4.3.1 Participant characteristics ... 30
4.3.2 Knowledge and concern ... 31
4.3.3 Food purchasing behaviour ... 33
4.3.4 Food purchasing patterns (from food receipts) ... 37
4.3.5 Hypertension status and food consumption ... 38
4.4 Discussion ... 41
4.5 Recommendations ... 51
4.6 Conclusion ... 52
References ... 53
Appendix ... 61
vi
Appendix C: Participant Eligibility Questionnaire ... 63
Appendix D: Letter of Information and Consent Form ... 64
Appendix E: Certificate of Ethics Approval ... 68
Appendix F: Food Item Specification Form ... 69
Appendix G: 24 Hour Dietary Recall ... 70
Appendix H: Interview Questionnaire ... 71
vii
Table 4.1: Nutrient Targets for DASH Score ... 28
Table 4.2: Descriptive characteristics of participants (n=30) ... 30
Table 4.3: Knowledge of sodium intake as a health issue and sources of sodium by
hypertensive group ... 32
Table 4.4: Average intake of DASH target nutrients by hypertension status. ... 39
Table 4.5: Percentage of participants meeting DASH-accordant nutrient intake by
hypertension status. ... 40
Table 4.6: The mean sodium (Na) purchased (mg/1000 kcal/d) in relation to the use of
viii
Figure 2.1: Percentage of Canadians self-reporting that they have high blood pressure, by
age group and sex, household population aged 12 or older ... 6
Figure 4.1: Frequency of reading the NFT for different nutrients by the hypertensive and
normotensive groups. Participants (n=30) reported their frequency of reading
NFT on a 0 to 4 scale. ... 34
Figure 4.2: Regular actions taken by the participants to reduce salt/sodium intake.
Participants (n=18) reported taking regular actions were allowed to report more
than one action. ... 36
Figure 4.3: Percentage contribution of major food groups to the total sodium purchased
CHAPTER 1
INTRODUCTION
Hypertension or high blood pressure is a condition in which the blood vessels have
persistently raised pressure. Blood pressure is considered to be raised or high, when the
systolic blood pressure is equal to or above 140 mm Hg and/or the diastolic blood
pressure is equal to or above 90 mm Hg (WHO, 2013). It is considered the most
significant modifiable risk factor for cardiovascular disease and is identified as the
primary risk factor for mortality around the world (WHO, 2013). Nevertheless, it is not
always taken seriously and often poorly controlled (Petrella and Campbell, 2005; Joffres
et al., 1997).
Hypertension is commonly diagnosed in older males and females. In Canada,
approximately 53.2% of older adults aged 60 to 79 years have been diagnosed with high
blood pressure (Wilkins et al., 2010). Management of hypertension in older adults is
crucial, since age is one of the leading risk factors for hypertension and older people are
more susceptible to suffer from the complications of hypertension. Although
non-pharmacological management of hypertension can treat milder forms of hypertension,
these strategies are often overlooked in the elderly population (Lionakise et al, 2012). In
management of hypertension dietary sodium is a key dietary element to control.
Therefore, the current study intended to address the food purchasing and consumption
behaviour of community dwelling older adults living in London, Ontario in the context of
Sodium is an essential nutrient needed to regulate blood volume and proper cell function
(National Institute of Health (NIH), 2013). However, most Canadians consume far more
than the amount needed for good health as well as the recommended intake levels
(Tanase et al., 2011). Epidemiological, experimental and review studies have repeatedly
established a causal relationship between excess sodium intake, elevated blood pressure,
and subsequent cardiovascular disease ( Cook et al., 2007; Elliott et al., 1996; Geleijnse
et al., 2003; He and MacGregor, 2002; Kesteloot and Joossens, 1988; Sacks et al., 2001).
It is evident from several randomized controlled trials that a reduction of dietary sodium
can lower arterial blood pressure (Sacks et al., 2001; He and MacGregor, 2002; Whelton
et al., 1998). Thus, scientific findings and clinical guidelines recommend dietary sodium
reduction among people with and without hypertension in order to treat hypertension
prior to any pharmaceutical interventions (Hackam et al., 2013). However, maintaining a
sodium restricted diet is neither simple to achieve nor easy to maintain for hypertensive
individuals (Luft et al., 1997).
It has been estimated that the prevalence of hypertension would lower by 30% if the
sodium intake of Canadians could be brought down to 1840 mg/day from the current
average intake of 3400 mg/d (Joffres et al., 2007; Penz et al., 2008). To achieve a
population-level sodium reduction in Canada, Health Canada’s Working Group on
Dietary Sodium Reduction has suggested a voluntary sodium reduction approach along
with other strategies (Sodium Working Group (SWG), 2010). Since the approach is
voluntary, it is possible that only a few food manufacturers and food service outlets
hypertension need to make lower sodium choices while purchasing foods at the grocery
or other food stores.
Convenience has become one of the biggest factors that drives Canadian consumers’
food choices (Agriculture and Agri-Food Canada, 2010). The aging population of Canada
is embracing convenience options to reduce the effort involved in cooking and maximize
their free time (Agriculture and Agri-Food Canada, 2010). In order to meet the present
consumer demands, convenience foods are often available in the market. These foods are
usually higher in sodium, sugar, and fats with little nutritional value (Fischer et al., 2009).
In fact, 77% of sodium in the Canadian diet comes from processed foods (Garriguet,
2007) . Hence, food choice, which is usually a part of food purchasing behaviour, plays a
vital role in the process of achieving and maintaining a low sodium diet.
In addition to lowering dietary sodium intake, the Canadian Hypertension and Education
Program (CHEP) recommends the DASH (Dietary Approaches to Stop Hypertension)
diet plan for both hypertensive patients and normotensive individuals at increased risk of
developing hypertension (Dasgupta et al., 2014). The DASH diet emphasizes fruits,
vegetables, low-fat dairy products, dietary and soluble fibre, whole grains and protein
from plant sources, and foods that are reduced in saturated fat and cholesterol. Previous
research showed that the combination of the DASH diet and reduced sodium intake have
the greatest effect on blood pressure (Sacks et al., 2001). Although a growing body of
evidence has established the role of a DASH diet in lowering blood pressure; to our
knowledge, no study was conducted in Canada to examine the adherence to this diet
In this regard, the current study investigated the association between hypertension status
and the amount of sodium purchased and consumed by the older adults with and without
hypertension. To better understand their consumption behaviour, the study also evaluated
the older adults’ adherence with the DASH diet (i.e. their intake of nine different
nutrients that are important for hypertension management). The study also explored the
older adults’ knowledge, concern and behaviour regarding dietary sodium to find possible
relationships among these parameters and the sodium content of food products they
CHAPTER 2
LITERATURE REVIEW
2.1
Hypertension
As defined by WHO, hypertension or high blood pressure is a condition in which the
blood vessels have persistently raised pressure. The force of blood pushing against the
walls of the blood vessels (arteries) as it is pumped by the heart creates blood pressure.
The higher the pressure the harder the heart has to pump. A blood pressure of 120 mm Hg
when the heart beats (systolic) and a blood pressure of 80 mm Hg when the heart relaxes
(diastolic) are considered as normal adult blood pressure (WHO, 2013). Blood pressure is
considered to be raised or high, when the systolic blood pressure is equal to or above 140
mm Hg and/or the diastolic blood pressure is equal to or above 90 mm Hg (WHO, 2013).
It is the most significant modifiable risk factor for cardiovascular disease and is identified
as the primary risk factor for mortality around the world (WHO, 2009). It is estimated
that 7.5 million deaths per year (13% of all deaths) around the world is caused by
hypertension (WHO, 2009). Nevertheless, it is not always taken seriously and often
poorly controlled (Joffres et al., 1997; Petrella & Campbell, 2005).
2.2
Aging and Increased Risk of Hypertension
The prevalence of hypertension has been found to be higher in older Canadians (over 65
older adults aged 60 to 79 years have been diagnosed with high blood pressure (Wilkins
et al., 2010). A retrospective population based study involving Canadian adults aged 20
years and older from 1998/99 to 2007/08 found that older women (over 60 years old)
have a higher prevalence than older men (Robitaille et al., 2012). According to a
community-based prospective cohort study among US adults aged 55 to 65 years who
were free of hypertension at baseline, approximately 60% of the population developed
hypertension by age 60, and about 65% of men and about 75% of women had the disease
by age 70 (Vasan et al., 2002). In the same study, it was projected that more than 90% of
normotensive individuals aged 55 to 60 years would develop hypertension over their
lifetime (Vasan et al., 2002).
Figure 2.1: Percentage of Canadians self-reporting that they have high blood pressure, by age group and sex, household population aged 12 or older (Statistics Canada, 2012)
Management of hypertension in older adults is essential because of its higher prevalence
in this demographic group. Moreover, older adults are more susceptible to suffer from the
complications include lower cardiac output, higher peripheral resistance, lower
intravascular volume, and lower renal blood flow (Messerli et al., 1983). Control of high
blood pressure would reduce the risk of several associated diseases including stroke,
coronary heart disease, and cognitive decline in older adults. Although
non-pharmacological management (i.e. weight loss, physical activity, DASH diet plan etc.) of
hypertension can treat milder forms of hypertension, it is often overlooked in the elderly
population (Lionakise et al, 2012). For example, dietary sodium is a key dietary element
to control.
2.3
Dietary Sodium and Hypertension
Epidemiological, experimental and review studies have repeatedly established a causal
relationship between excess sodium intake, elevated blood pressure, and subsequent
cardiovascular disease (Cook et al., 2007; Elliott et al., 1996; Sacks et al., 2001; Sacks &
Compos, 2010; Strazzullo et al., 2009). The causal relationship between sodium intake
and blood pressure across many populations has been established in the multinational
INTERSALT studies (Elliott et al., 1996; Stamler, 1997). The INTERSALT Study was a
standardized, epidemiologic study of a large sample size aged 20 to 59 years from 32
countries around the world. The study showed a significant, positive, independent linear
association between dietary sodium, measured by 24-hour urinary sodium excretion, and
systolic blood pressure (Stamler, 1997). It is evident from several randomized controlled
trials that a reduction of dietary sodium can lower arterial blood pressure (He and
MacGregor, 2002; Sacks et al., 2001; Whelton et al., 1998). A randomized controlled
during a control diet (typical American diet) on blood pressure found that sodium
reduction from high (150 mmol/day) to intermediate level (100 mmol/d) reduced the
systolic blood pressure by 2.1 mm Hg (Sacks et al., 2001). Moreover, dietary sodium
reduction from intermediate (100 mmol/d) to low level (50 mmol/d) caused additional
reduction of systolic blood pressure by 4.6 mm Hg (Sacks et al., 2001).
The Canadian Community Health Survey (CCHS) provided information on current
sodium intake of Canadians (Garriguet, 2007). Although some sodium is needed to
regulate blood volume and proper cell function, Canadians of all ages consume more than
twice the recommended Adequate Intake (AI) level of 1500 mg/day (Fischer et al., 2009;
Garriguet, 2007; Tanase et al., 2011). The results from the survey indicated that over 85%
of men and 60% of women aged 19 to 70 years had sodium intakes in excess of the
recommended Tolerable Upper Intake Level (UL = 2300 mg/d) beyond which health
risks increase (Garriguet, 2007). The average intake of sodium among Canadian adults is
reported to be 3400 mg/day which far exceeds the UL (Health Canada, 2012). Higher
health risks are associated with a sodium intake above the UL. The need for effective
control of sodium intake is evident.
In Canada, it has been suggested that almost 30% of hypertension cases occur because of
excess dietary sodium (Joffres et al., 2007). It is estimated that if the prevalence of
hypertension is reduced by 30%, annually 23,500 cardiovascular events would be
prevented (Joffres et al., 2007; Penz et al., 2008). Consequently, if hypertension could be
controlled Canada would reduce a huge amount of its annual health care costs (Joffres et
2.4
Sources of Sodium in the Canadian Diet
Both Canadian children and the adult population consume unhealthy levels of sodium due
to the types of food they eat at home and in restaurants (Tanase et al., 2011). Salt is the
primary source of sodium in our diet with other sources being food additives like
monosodium glutamate, sodium bicarbonate (baking soda) etc. The major proportion of
sodium in the Canadian diet is added to food during processing (Garriguet, 2007).
Processed foods, including restaurant and fast foods, are a major source of sodium in our
diet. It has been estimated that approximately 77% of sodium in our diet comes from
processed foods, 12% occurs naturally in foods, 6% is added at the table, and 5% is
added during cooking (Brown et al., 2009; Garriguet, 2007; Mattes and Donnelly, 1991)
The Canadian Community Health Survey (CCHS), Cycle 2.2, Nutrition (2004) identified
the major food groups that contribute to dietary sodium in Canadian diets. Processed
meats, breads, some canned foods, cheeses, breads, cereals, sauces, pickled foods,
commercial rice or pasta mixes and condiments are reported to be the common sources of
sodium in our diet (Health Canada, 2007; Fischer et al., 2009).
To achieve a population-level sodium reduction in Canada, Health Canada’s Working
Group on Dietary Sodium Reduction has suggested a voluntary sodium reduction
approach, an education and awareness strategy, and research and surveillance (Sodium
Working Group, 2010). A voluntary approach would be successful if all the food
manufacturers and food service outlets agreed to lower sodium in their food so that
consumers do not need to choose between low and high sodium foods (Barr, 2010).
need to make informed choices according to their health conditions when purchasing and
consuming food products.
2.5
Canadian Guidelines for Hypertension Management
The Canadian Hypertension Education Program (CHEP) provides evidence-based
recommendations for prevention, diagnosis and treatment of hypertension. For
prevention and treatment, guidelines for health behaviour management including physical
exercise, weight management, dietary recommendations, alcohol consumption, sodium
intake and stress management are documented (Dasgupta et al., 2014). To reduce blood
pressure, CHEP recommends to reduce dietary sodium intake toward 2000 mg (5 g of salt
or 87 mmol of sodium) per day (Dasgupta et al., 2014).
According to CHEP, the DASH diet is recommended for both hypertensive patients and
normotensive individuals at increased risk of developing hypertension (Hackam et al.,
2013; Dasgupta et al., 2014). The DASH diet emphasizes fruits, vegetables, low-fat dairy
products, dietary and soluble fibre, whole grains, and protein from plant sources
(National Institute of Health (NIH), 2006). Overall, the DASH diet emphasizes the foods
rich in nutrients (i.e. potassium, magnesium, calcium) that help lower blood pressure
levels (Houston and Harper, 2008). This dietary pattern is similar to the Eating Well with
Canada’s Food Guide (Health Canada, 2011; NIH, 2006).
Randomized controlled trials have established that the DASH diet can significantly lower
systolic blood pressure in hypertensive patients (Moore et al., 2001; Sacks et al., 2001;
DASH diet and reduced sodium intake have the greatest effect on blood pressure (Sacks
et al., 2001). For instance, a randomized controlled trial examined the effects of three
level of sodium (150 mmol/d, 100 mmol/d, and 50 mmol/d) and two dietary patterns
(control diet and DASH diet) on blood pressure among 412 participnats. The study found
that reducing sodium intake from 150 mmol/d to100 mmol/d while consuming the DASH
diet reduced systolic blood pressure by 1.3 mm Hg. Moreover, reducing sodium intake to
50 mmol/d caused an additional reduction of 1.7 mm Hg blood pressure while on the
DASH diet (Sacks et al., 2001). Other randomized controlled trials investigating the
effects of the DASH diet on blood pressure in subgroups found that the DASH diet
caused greatest reductions in blood pressure among African-Americans, hypertensive and
older individuals (Svetkey, 1999; Vollmer et al., 2001). Although a growing body of
evidence has established the role of a DASH diet in lowering blood pressure, to our
knowledge, no research was conducted to investigate the adherence to this diet among
Canadian hypertensive older adults.
The DASH diet is routinely recommended by the Canadian Health Education Program
and the American Heart Association (AHA) to help control blood pressure of
normotensive and hypertensive individuals (American Heart Association (AHA), 2012;
Hackam et al., 2013). Overall, the DASH diet recommends to choose products which are
either labeled as “low in fat” or “fat-free”, and those stating “reduced sodium”,
“low-sodium”, “unsalted”, or “salt-free” (NIH, 2006). Hence, food choice, which is usually a
part of food purchasing behaviour, plays a vital role in the process of achieving and
2.6
Research Investigating Knowledge, Concern and Behaviours
Related to Sodium
The above discussion suggests that dietary sodium reduction is an important measure for
hypertension management and that food selection is a vital part when it comes to
lowering sodium intake. In order to make the lower sodium food choices, it is important
that consumers have the knowledge related to sodium, its sources, recommended levels of
daily intake and food label comprehension. A random-digit-dial telephone survey study
was conducted to explore Ontario residents’ knowledge related to dietary sodium. The
study revealed that the majority of the participants were aware of the health issues related
to excessive sodium intake (Papadakis et al., 2010). However, a large proportion of them
were not able to identify many of the popular foods in the mainstream Canadian diet that
are high in sodium (Papadakis et al., 2010). Moreover, these food products were reported
to be consumed very frequently by the consumers. Thus, this gap in knowledge suggests
that it could be possible that consumers are making higher sodium food choices without
knowing.
A recent national survey conducted in Canada found that 67.0% of respondents were
concerned about dietary sodium and 59.3% were taking action to reduce sodium intake
(Arcand et al., 2013). However, the above studies did not verify their findings with actual
sodium consumption and adherence with sodium recommendations through dietary
intake or sodium excretion data. Moreover, the studies were based on self-reported data.
Previous literature on dietary behaviours suggest that respondents could be susceptible to
responses (Hebert et al., 1995; Miller et al., 2008). Therefore, the current study sought to
investigate older adults’ food selections related to sodium by using food purchasing
receipts data and dietary intake besides assessing their knowledge, concern and
behaviour.
2.7
Food Label Use by Canadians
In Canada, consumers can obtain nutrition information from the mandatory Nutrition
Facts Table (NFT) which can be found in almost all the pre-packaged foods. The NFT
identifies the amount of 13 core nutrients including sodium in each food product (Health
Canada, 2008a). The NFT provides the amount of nutrients in both grams/milligrams and
% DV (Daily Value). The % DV provides a quick overview of the nutrient profile of a
food item and is helpful for making informed food choices and comparing between
brands (Health Canada, 2008b).
About 60% of Canadian consumers reported “always” or “usually” reading the nutrition
labels on food packages in a survey conducted in 2008 (Health Canada, 2008a). The NFT
and ingredient list were found as the main sources of information to help determine the
nutrient content of a food (Health Canada, 2008a). Although many Canadian consumers
compared nutrition information on food products, only about 20% of them sought
nutrition information when eating out (Health Canada, 2013).
Canadian food products can also provide two types of nutrition claims (i.e. nutrient
content claims and health claims) (Health Canada, 2010). A nutrient content claim
in sodium”). Health claims are defined as “any statement or representation that states,
suggests or implies that a relation exists between a food or component of that food and
health” (Health Canada, 2010). Health claims are used to communicate the health
benefits of specific nutrients. An example of a health claim is “A healthy diet low in
sodium may reduce the risk of hypertension”. However, health claims are not mandatory
in Canada, so not all brands will include one. Previous consumer research reported that
nutrient content and health claims are the least favourite form of information on food
labels. Only 21% and 18% of Canadian consumers, respectively, look for nutrient content
claims and health claims on food labels (Canadian Council of Food and Nutrition, 2008).
However, a recent online survey revealed that Canadian consumers with hypertension are
more willing to purchase a food product with any sodium claim (Wong et al., 2013).
However, only ~ 5-7% of North American products contain a claim that talks about
sodium (Legault et al., 2004; Schermel et al., 2013). Hence, NFT remains as the main
source of information when it comes to choosing a lower sodium product.
In order to make informed food choices, it is important that consumers have the
knowledge related to food label comprehension. However, studies demonstrate that,
despite educational efforts by Health Canada and others, the understanding of nutrition
labelling is not reaching its full potential to assist Canadians in making informed food
2.8
Food Purchasing and Consumption Behaviour of Older Adults
Consumption behaviour involves the food choices made by the individual at the
supermarket (Martin et al., 2006). Household food purchasing behaviour is an important
measure of an individual’s food choices. Food choices can occur in grocery stores,
supermarkets, fast-food places, restaurants, vending machines, and convenience stores.
The term “household food purchasing behaviour” pertains to all the foods and beverages
bought by a household from all types of food stores (French et al., 2008).
To date, three types of measures for food purchasing behaviour have been used most
often in research studies: home food inventories, food and beverage purchase records and
receipts, and Universal Product Code bar code scanning (French et al., 2008). A review
paper comparing three different measures of household food purchasing behaviour
concluded that annotated food purchase receipts over a 2 to 4 week time period is best for
describing household food purchasing behaviour and for tracking changes in food
purchasing patterns over time (French et al., 2008).
Household food purchasing behaviour can be influenced by various factors including age.
Previous studies have investigated food purchasing and consumption behaviour of older
adults in relation to socio-demographic status, food safety and health aspects. Households
with older adults, higher income and higher educated members were found to spend a
bigger proportion of income on fruits and vegetables (Pérez, 2002; Ricciuto et al., 2006).
Studies investigating consumption behaviour of Canadians found similar findings
(Garriguet, 2004; Nesbitt et al., 2008). These studies also found that older adults are less
Nesbitt et al., 2008). On the other hand, other studies found that older adults use different
strategies and approaches while acquiring and preparing food than the younger
population. For instance, sometimes they choose prepared or ready-to-eat meals in order
to ease their food preparation time as well as to prevent dependency regarding meal
preparation (Sidenvall et al., 2001).
In the last decade, the convenience food market has substantially grown in Canada. An
important factor in this growth is the change in Canada’s consumer demographics
(Agriculture and Agri-Food Canada, 2010). For instance, the population of Canada is
aging. The percentage of Canadians aged 65 and older has increased from 8% in 1971 to
14.4% in 2011(Employment and Social Development Canada, 2012). In addition,
Canada’s largest birth cohort, the baby boom generation, began turning 65 in 2011. This
aging population is embracing convenience options to reduce the effort involved in
cooking and maximize their free time (Agriculture and Agri-Food Canada, 2010). In
order to meet the present consumer demands, convenience foods i.e. frozen dinners,
ready-to-eat foods, canned products etc. are often available in the market presently.
However, these prepared or ready-to-eat meals are usually higher in sodium, sugar, and
fats with little nutritional value (Fischer et al., 2009).
Besides nutrition and health consideration, there are several factors (i.e. price/cost,
taste/flavour, freshness, familiarity with the food products, personal preference etc.) that
impact an individual’s food purchasing behaviour (Rolfes et al., 2006; French, 2003;
Piché and Garcia, 2001). Some of these factors may influence an individuals’ food choice
A qualitative descriptive study of 20 heart patients identified lack of knowledge,
interference with socialization and lack of food selection as factors related to
nonadherence to low sodium diet (Bentley et al., 2005).The Indiana University
demonstration project showed that adhering to a sodium-restricted diet was feasible in
50% of hypertensive individuals; nevertheless, it was challenging for those individuals
and required comprehensive steps (Luft et al., 1997). These comprehensive steps for
achieving a long lasting dietary change included knowledge and motivation towards the
changes, regular educational counseling, goal setting, self-monitoring, etc. (Dawyer,
1991; Luft et al., 1997). A recent multicentre observational study investigating adherence
to a low-sodium diet in patients with heart failure found that participants are more likely
to follow a low-sodium diet when their family members also follow the diet (Chung et
al., 2013).
In summary, the Canadian food market offers a variety of prepackaged, canned and
processed foods more often than before which are usually higher in sodium, fat and
sugar, and lower in other nutritional values. Older adults are more likely to buy these
food products to make their food preparation easy and to prevent dependency regarding
meal preparation (Sidenvall et al., 2001). Hence, food choice, which is usually a part of
food purchasing behaviour, plays a vital role in the process of achieving and maintaining
low sodium diet. Although previous studies focused on the knowledge and concern of
Canadian adults regarding dietary sodium reduction and hypertension status, they did not
observe their actual food choice or consumption in relation to sodium. Therefore, the
consumption behaviour in the context of sodium and hypertension status. The secondary
CHAPTER 3
SCOPE OF RESEARCH
Scientific findings and public health organizations recommend dietary sodium reduction
among people with and without hypertension in order to prevent and treat hypertension
prior to any pharmaceutical interventions (Hackam et al., 2013). Although
non-pharmacological management (i.e. weight loss, physical activity, DASH diet plan, etc.) of
hypertension can treat milder forms of hypertension, it is often overlooked in the elderly
population (Lionakise et al, 2012). The Canadian food supply offers a variety of
prepackaged, canned and processed foods more often than before which are usually
higher in sodium, fat and sugar, and lower in other nutritional values (Fischer et al.,
2009). However, the aging population of Canada is embracing these convenience options
to reduce the effort involved in cooking and maximize their free time (Agriculture and
Agri-Food Canada, 2010). Hence, food choice at the grocery store plays a vital role in the
process of achieving and maintaining a low sodium diet. Since both food purchasing and
consumption behaviour reflect an individual’s food choices, the current study
investigated whether having hypertension had an influence on older adults’ food choices
in relation to sodium when purchasing and consuming food. The secondary objective of
this study was to evaluate older adults’ adherence with the DASH diet.
The findings from this comprehensive research will provide valuable insight on older
adults’ knowledge, concern, behaviour in addition to actual purchase and consumption
health educators to design health promotion programs that could be aimed towards
low-sodium food purchasing practices specifically for this demographic segment.
3.1
Research Questions and Objectives
The overall purpose of the current study was to investigate the food purchasing and
consumption behaviour of community dwelling older adults in the context of sodium and
hypertension. The following research questions were addressed:
1. Is there any difference in the amount of daily sodium purchased between
hypertensive and normotensive older adults?
2. Is there any difference in the amount of daily sodium consumed between
hypertensive and normotensive older adults?
3. Is there any difference in the DASH score by hypertension status of older adults?
The research study also examined the following to better understand purchasing and
consumption behaviour:
Knowledge and concern regarding dietary sodium and hypertension,
Sodium reducing behaviour (e.g., regular actions taken by the participants),
CHAPTER 4
FOOD PURCHASING AND CONSUMPTION
BEHAVIOUR OF OLDER ADULTS
4.1
Introduction
Dietary sodium reduction is an important part of dietary self-management of
hypertension. In Canada, almost 30% of the hypertension occurs because of excess
dietary sodium (Joffres et al., 2007). It is estimated that if the prevalence of hypertension
is reduced by 30%, annually 23,500 cardiovascular events would be prevented (Joffres et
al., 2007; Penz et al., 2008). Consequently, Canada would be able to reduce a huge
amount of annual health care costs (Joffres et al., 2007). Although population-wide
dietary sodium reduction would be an effective way to lower the prevalence of
hypertension as well as reduce the annual cost of health care, it is not always taken
seriously and often poorly controlled (Joffres et al., 1997; Petrella & Campbell, 2005).
To achieve a population-level sodium reduction in Canada, Health Canada’s Working
Group on Dietary Sodium Reduction has suggested a voluntary sodium reduction
approach along with other strategies like education and awareness, research and
surveillance (Sodium Working Group (SWG), 2010). If the sodium reduction approach
was mandatory, individuals would not have to compare between brands for a lower
sodium option. However, since the approach is voluntary, it is possible that only a few
products (Barr, 2010). Therefore individuals with hypertension need to make informed
choices when purchasing foods at the grocery or other food stores.
In addition convenience has become one of the biggest factors that drives Canadian
consumers’ food choices (Agriculture and Agri-Food Canada, 2010). Specifically, the
aging population of Canada is embracing convenience options in order to maximize their
leisure time inspite of having cooking skills (Agriculture and Agri-Food Canada, 2010).
In order to meet the present consumer demands, convenience foods (i.e. frozen dinners,
ready-to-eat foods, canned products etc.) are often available in the market. These foods
are usually higher in sodium, sugar, and fats with little nutritional value (Fischer et al.,
2009). In fact, 77% of sodium in the Canadian diet comes from processed foods
(Garriguet, 2007; Mattes and Donnelly, 1991).
As a result, food selection has become an important consideration when it comes to
sodium reduction for hypertensive individuals. However, upon examining the literature,
there was no study investigating the influence of hypertension status on the food choices
of Canadian older adults. Therefore, the purpose of the current study was to investigate
the association between hypertension status and the amount of sodium purchased and
consumed.
Food purchasing behaviour is an important measure of an individual’s daily food choice
and often reflects consumption. Individual’s food choices can occur in grocery stores,
supermarkets, fast-food places, restaurants, vending machines, and convenience stores. In
order to get a bigger picture of an individual’s food choice and dietary quality, it is
purchasing behaviour” pertains to all the foods and beverages bought by a household
from all types of food stores. Household food purchasing behaviour can be measured by
using home food inventories, food and beverage purchase records and receipts, and
Universal Product Code bar code scanning (French et al., 2008). However, a review study
comparing these measures concluded that food purchase receipts with annotation over a 2
to 4 week time period is best for describing household food purchasing behaviour and for
tracking changes in food purchasing patterns over time (French et al., 2008).
In addition to reduction in dietary sodium, the Canadian Hypertension Education
Program (CHEP) recommends a dietary pattern known as Dietary Approach to Stop
Hypertension or DASH diet. This dietary pattern emphasizes fruits, vegetables, low-fat
dairy products, dietary and soluble fibre, whole grains, and protein from plant sources,
and foods that are reduced in saturated fat and cholesterol. The DASH diet is
recommended for both hypertensive patients and normotensive individuals at increased
risk of developing hypertension (Hackam et al., 2013). Randomized controlled trials have
established that the DASH diet can significantly lower systolic blood pressure in
hypertensive patients (Moore et al., 2001; Sacks et al., 2001; Svetkey et al., 1999).
Although a growing body of evidence has established the role of a DASH diet in
lowering blood pressure, in Canada, no study investigated the adherence of this diet
among hypertensive individuals. Therefore, as a secondary objective of the present study,
adherence with DASH nutrient intake was evaluated to better understand older adults’
Therefore, the research study used a convenience sample of community dwelling older
adults to investigate the following research questions:
1. Is there any difference in the amount of daily sodium purchased between
hypertensive and normotensive older adults?
2. Is there any difference in the amount of daily sodium consumed between
hypertensive and normotensive older adults?
3. Is there any difference in the DASH score by hypertension status of older
adults?
In addition, the study explored their knowledge, concern, and behaviour regarding dietary
sodium to better understand the influence of these parameters on the primary findings of
the study. The findings from the study will identify where sodium reduction strategies
should be focussed.
4.2
Methods
4.2.1 Participants
A convenience sample of 30 older adults was recruited from several organizations
(Appendix A) including senior centres, malls and public libraries in London, ON to
participate in the research study. A participant recruitment flyer (Appendix B) was also
distributed at the possible locations where older adults usually gather. However,
food survey in order to minimize bias in participant recruitment regarding sodium
purchases and consumption.
Individuals were included in the study if they were over 65 years old, living
independently within the community, responsible for grocery shopping in their
household, shopping at a grocery store at least once a week and eating at least two main
meals per day at home. The inclusion criteria were created to ensure that the grocery
receipts were representative of what people ate. Individuals who were receiving any
meal-assisted service (e.g., meals on wheels) or showed any indication of cognitive
dysfunction were not eligible to participate in the study.
Participant’s eligibility was determined at the beginning of the recruitment process by
using a set of questions regarding the eligibility criteria (Appendix C). An individuals’
decision to participate in the study was entirely voluntary. All participants signed
informed consent form (Appendix D) before participating. The research protocol was
approved by the University of Western Ontario Research Ethics Board (REB#104368)
(Appendix E).
4.2.2 Instruments and Procedure
Three types of instruments (food receipts, 24-hour recall and an interview) were used to
collect the data from November 2013 to May 2014. However, no data were collected
from Dec 13th to 31st, 2013 to avoid any special-occasion influence on their purchasing
4.2.2.1 Grocery/restaurant receipts
Participants provided all their receipts for food and beverage purchases over a continuous
two week period along with a food item explanation form. The explanation form
(Appendix F) was given to themat thetime of recruitment to write down specifications
of the food items if not clear from the receipts. Participants were also asked to write
down any food purchases for which there was no receipt available (i.e. in case of farmers
market or church bazaar) and to report to the researcher in the case of missing receipts
from any stores. In order to reduce the chance of under-reporting, participants were
encouraged to keep a zip lock bag with a reminder notification for saving the grocery
receipts for the study.
For all the food purchases reflected on the food receipts, information on the food item,
serving size, the amount of sodium (mg) and calories (kcal) per serving size were entered
in Microsoft Excel spreadsheet. This information was collected from the nutrient facts
table of the food items or the fast food/restaurant website (if they had one). After entering
the data, the amount of sodium (mg) per 1000 kcal for each purchase was calculated
(Rankin et al., 1998) in order to make a common unit more representative of daily
consumption. The daily amount of sodium is calculated from the two weeks purchase
data by dividing it by 14.
The food items from the receipts were divided into 11 major food groups: fruits and
vegetables (f&v), breads and breakfast cereals, meat and alternatives, processed meats,
milk and alternatives, cheese, salty snacks (i.e. potato chips), soups (canned), condiments
meals, microwave meals etc.), and fast foods/restaurant foods. The percentage of sodium
contributing to each food group was calculated and the top contributors for both groups
were identified.
4.2.2.2 Multiple 24-hr recalls
Diet history was collected using multiple 24-hr recalls (Appendix G) administered by the
researcher. In order to optimize recall, the five steps of the Automated Multiple-Pass
Method (AMPM) were followed (Health Canada, 2007). The AMPM is an automated
questionnaire designed to optimize a participant’s remembrance of foods eaten in the
preceding 24 hours (Health Canada, 2007). The 24-hour recalls were collected at the
beginning of the 1st week, and the end of the 1st and 2nd week of the data collection
period. This was done to ensure that the food purchases reflected their food consumption.
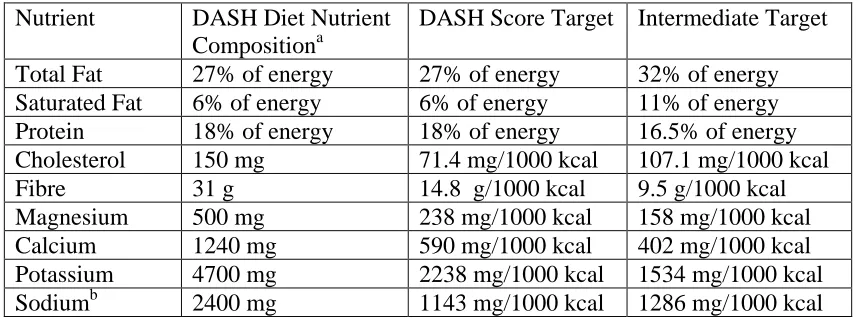
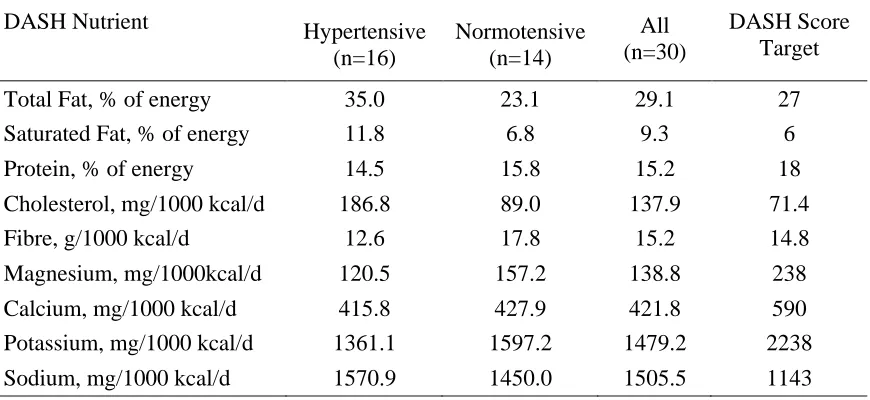
To assess adherence with the DASH diet plan, a DASH-score as suggested by Mellen et
al. (2008) was used. DASH targets for a total of nine nutrients (total fat, saturated fat,
protein, fibre, cholesterol, calcium, magnesium, potassium, and sodium) were identified
for the DASH score. The 24-hr dietary recalls were entered into the ESHA Food
Processor SQL (version 10.11.0.0) to identify the amounts of target nutrients. Then the
percentage contribution of these nutrients to the total energy was calculated. The
maximum DASH score is 9, calculated by summing all the nutrient targets met.
Individuals achieved a score of 1 if they met a DASH nutrient target and a score of 0.5 if
they met a goal intermediate between the DASH goal and the nutrient content of the
Table 4.1). For example, participants scored 1 if they consumed less than 1143 mg/1000
kcal/d of sodium (DASH target for sodium), 0.5 if they consumed more than 1143
mg/1000 kcal/d but less than 1286 mg/1000 kcal/d (intermediate target for sodium) of
sodium and 0 if they consumed more than 1286 mg/1000 kcal/d of sodium. Individuals
scoring a DASH score half of the DASH target (i.e., a DASH score ≥ 4.5) were
considered adherent to the DASH diet (Mellen et al., 2008).
Table 4.1: Nutrient Targets for DASH Score
Nutrient DASH Diet Nutrient Compositiona
DASH Score Target Intermediate Target
Total Fat 27% of energy 27% of energy 32% of energy Saturated Fat 6% of energy 6% of energy 11% of energy Protein 18% of energy 18% of energy 16.5% of energy Cholesterol 150 mg 71.4 mg/1000 kcal 107.1 mg/1000 kcal
Fibre 31 g 14.8 g/1000 kcal 9.5 g/1000 kcal
Magnesium 500 mg 238 mg/1000 kcal 158 mg/1000 kcal
Calcium 1240 mg 590 mg/1000 kcal 402 mg/1000 kcal
Potassium 4700 mg 2238 mg/1000 kcal 1534 mg/1000 kcal Sodiumb 2400 mg 1143 mg/1000 kcal 1286 mg/1000 kcal
a
Based on a 2100-kcal diet.
b
Sodium Target Based on the Sixth Report of the Joint National Committee on Prevention, Detection, Evaluation, and Treatment of High Blood Pressure recommendations (Mellen et al., 2008).
4.2.2.3 Interview Questionnaire
At the end of the second week, a short interview was conducted by the researcher. The
study questionnaire (Appendix H) addressed knowledge, concern and behaviour
pertaining to acquisition and consumption of sodium, actions taken to reduce dietary
sodium on a regular basis, the presence of hypertension and other chronic diseases and
the participant’s demographics. Similar to Shi et al. (2011), hypertension status was
care professional. Those with a response “yes” were considered hypertensive and “no”
were considered normotensive. The questionnaire used was taken from a similar survey
prepared for the Public Health Agency of Canada by Decima Research (Decima
Research, 2009). However, a few questions were removed since they did not serve the
purpose of the present research study.
To assess the participants’ knowledge, they were asked about the recommended daily
intake of sodium, sources of sodium in the Canadian diet and the medical conditions
associated with higher sodium intake. They were also asked to categorize a list of popular
foods as being low, moderate or high in sodium. For each correct response for knowledge
questions, participants were given a score of 1 and the maximum score was 18.
Participants who scored higher than 9 were considered knowledgeable.
Participants’ concern was assessed using a single question: “How concerned are you
about the amount of sodium in your diet?” Their responses were ranked using a 0 to 4
point scale, where 0 = not at all concerned and 4 = extremely concerned. Responses of
concern about sodium were dichotomized based on responses: “3 or 4” = “concern” and
“0, 1 or 2” = “no concern”. Behaviour questions included the frequency of reading NFT
while purchasing food items and comparing sodium content among different brands.
Participants were also asked about the actions they took on a regular basis and
specifically over the past month to control or reduce the amount of sodium in their diets.
4.2.3 Statistical analyses
All data from the questionnaire were entered in a Microsoft Excel spreadsheet.
frequencies and percentages. For all the research questions, data were analyzed using
independent t-tests in order to determine the statistically significant difference between
the groups. All statistical analyses were performed using the Minitab15 data analysis
software with p<0.05 considered statistically significant.
4.3
Results
4.3.1 Participant characteristics
A total of 42 older adults from nine 9 different organizations were approached to
participate in the study. Among them 12 older adults did not meet the inclusion criteria.
The remaining 30 older adults contributing data to the study were exclusively female
(100%) with a mean age of 75.6 ± 7.5 years and mean BMI of 25.8 ± 6.4 kg/m2.
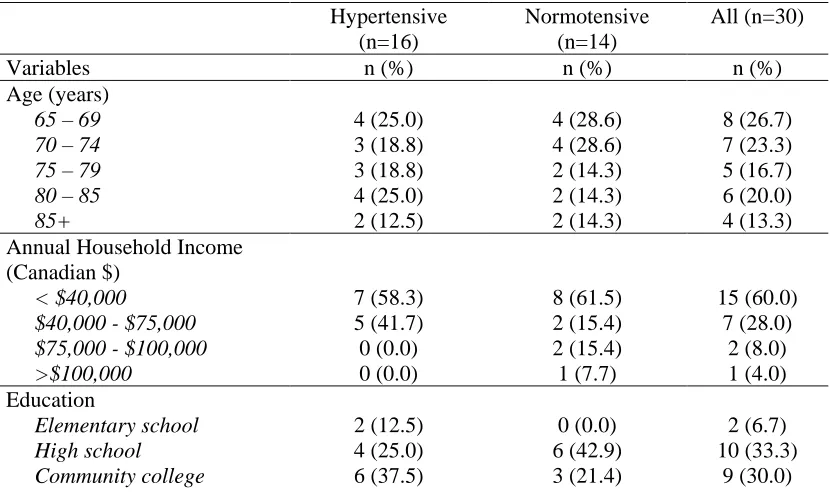
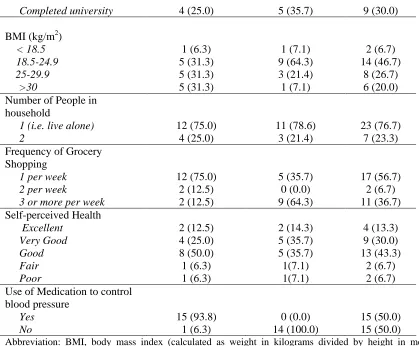
Demographic and lifestyle characteristics are summarized in Table 4.2.
Table 4.2: Descriptive characteristics of participants (n=30)1,2
Hypertensive (n=16)
Normotensive (n=14)
All (n=30)
Variables n (%) n (%) n (%) Age (years)
65 – 69 4 (25.0) 4 (28.6) 8 (26.7)
70 – 74 3 (18.8) 4 (28.6) 7 (23.3)
75 – 79 3 (18.8) 2 (14.3) 5 (16.7)
80 – 85 4 (25.0) 2 (14.3) 6 (20.0)
85+ 2 (12.5) 2 (14.3) 4 (13.3)
Annual Household Income (Canadian $)
< $40,000 7 (58.3) 8 (61.5) 15 (60.0)
$40,000 - $75,000 5 (41.7) 2 (15.4) 7 (28.0)
$75,000 - $100,000 0 (0.0) 2 (15.4) 2 (8.0)
>$100,000 0 (0.0) 1 (7.7) 1 (4.0) Education
Elementary school 2 (12.5) 0 (0.0) 2 (6.7)
High school 4 (25.0) 6 (42.9) 10 (33.3)
Completed university 4 (25.0) 5 (35.7) 9 (30.0)
BMI (kg/m2)
< 18.5 1 (6.3) 1 (7.1) 2 (6.7)
18.5-24.9 5 (31.3) 9 (64.3) 14 (46.7)
25-29.9 5 (31.3) 3 (21.4) 8 (26.7)
>30 5 (31.3) 1 (7.1) 6 (20.0) Number of People in
household
1 (i.e. live alone) 12 (75.0) 11 (78.6) 23 (76.7)
2 4 (25.0) 3 (21.4) 7 (23.3)
Frequency of Grocery Shopping
1 per week 12 (75.0) 5 (35.7) 17 (56.7)
2 per week 2 (12.5) 0 (0.0) 2 (6.7)
3 or more per week 2 (12.5) 9 (64.3) 11 (36.7) Self-perceived Health
Excellent 2 (12.5) 2 (14.3) 4 (13.3)
Very Good 4 (25.0) 5 (35.7) 9 (30.0)
Good 8 (50.0) 5 (35.7) 13 (43.3)
Fair 1 (6.3) 1(7.1) 2 (6.7)
Poor 1 (6.3) 1(7.1) 2 (6.7) Use of Medication to control
blood pressure
Yes 15 (93.8) 0 (0.0) 15 (50.0)
No 1 (6.3) 14 (100.0) 15 (50.0)
Abbreviation: BMI, body mass index (calculated as weight in kilograms divided by height in meters squared); n, number of participants
1
All data are participant-reported. 2
Sample sizes may total less than 30 as participants had the option of not answering a question.
4.3.2 Knowledge and concern
All participants in both groups scored over 9 points (score range = 9 to 14; maximum
score = 18). Hence, overall they were considered moderately knowledgeable. The
majority of the hypertensive group (68.8%) scored ≥ 12 compared to the normotensive
group (42.9%). However, correct responses regarding certain issues (i.e. some food
sources and recommended intake of sodium) were very low in both groups (Table 4.3).
Table 4.3 presents a summary of responses to the assessment of knowledge related to
Table 4.3: Knowledge of sodium intake as a health issue and sources of sodium by hypertensive group (hyp=hypertensive group and norm=normotensive group)
Parameter Hyp (%) Norm (%)
How much sodium do you think Canadians consume (too much, the right amount or too little)?
Too much 87.5 71.4
How much sodium is recommended for the average Canadian each day?
1200 – 1500 mg/d 18.7 14.3 Don’t know 81.3 85.7
Which of the following do you think is the single largest source of sodium?
Salt in processed foods 93.8 57.1
Sea salt is healthier than table salt.
Agreed 62.5 92.9
Disagreed 37.5 7.1
Correctly identified high-sodium foods
Processed meats (i.e. wieners, bacon or sandwich meat) 100.0 100.0 Pickled foods (i.e. olives, pickles) 87.5 57.1 Cheese (processed) 50.0 14.3 Canned soup 100.0 100.0 Salad dressing 43.7 50.0 Canned vegetables or juice 31.7 7.2 Frozen dinners 87.5 71.4
Correctly identified medical conditions associated with high sodium intake
High blood pressure 100.0 100.0 Heart disease 100.0 85.7 Stroke 87.5 78.6
Over 70% of participants in both groups were aware that Canadians consume too much
sodium. Yet less than 10% of the participants in both groups believed they personally
consumed too much sodium. While more than 90% of the hypertensive group and 50% of
the normotensive group knew that processed foods were the largest source of sodium in
the Canadian diet, many participants were not able to correctly identify many of the
participants in both groups were not able to identify the following foods as being high in
sodium: processed cheese, canned vegetables or juice and salad dressing.
Likewise, more than three quarters of the participants failed to answer the recommended
amount of daily sodium intake (which is 1500 mg/d) for the average Canadian. However,
75% of the hypertensive and 78.6% of the normotensive participants believed that they
were consuming the right amount of sodium.
Approximately one third of the participants in both groups (31.3% hypertensive; 28.6%
normotensive) were concerned about the sodium content in their diet. Only 18.8% of the
hypertensive group reported monitoring the amount of sodium while purchasing food
compared to 28.6% in the normotensive group.
4.3.3 Food purchasing behaviour
All the participants from both groups reported shopping at a grocery store at least once
per week. However, 25% of the hypertensive and 55% of the normotensive group
reported shopping at a grocery store at least three times per week (or “whenever they
need something”).
When describing their grocery shopping behaviour, participants reported making a list
before going to the grocery store (81% hypertensive; 78.6% normotensive). Some
participants also reported buying whatever was on sale (0% hypertensive; 35.7%
normotensive). In addition, 38% of hypertensive and 35.7% of normotensive participants
4.3.3.1 Frequency of reading the nutrient facts table (NFT)
Participants reported the frequency of reading the NFTs while purchasing a food item for
the first time on a 0 to 4 point scale (where 0=never and 4=always). Responses were
dichotomized based on responses: “3 or 4” = “read NFT” and “0, 1 or 2” = “don’t read
NFT”. The mean score for both groups was 2.9 which suggest that on average the
participants “usually” read the NFT. About 68.8% of the hypertensive and 78.6% of the
normotensive group reported “always” or “usually” reading the NFT.
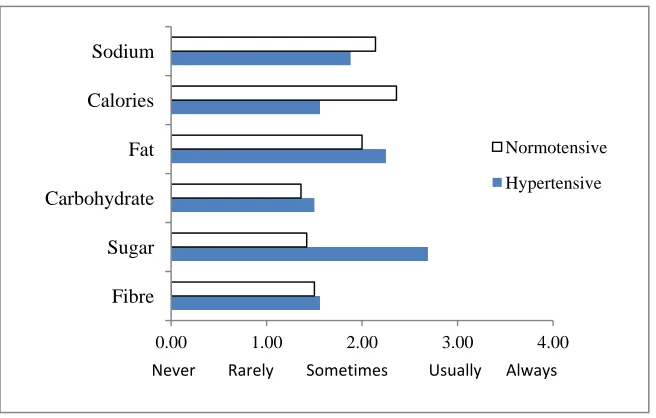
Figure 4.1 represents the frequency of reading nutritional values for certain nutrients
including sodium. The hypertensive group reported reading nutritional values for sugar
(mean score=2.7) more often than sodium (mean score=2.1). The normotensive group
reported reading nutritional values for calories and sodium more often than the other
nutrients.
Figure 4.1: Frequency of reading the NFT for different nutrients by the hypertensive and normotensive groups. Participants (n=30) reported their frequency of reading NFT on a 0 to 4 scale.
0.00 1.00 2.00 3.00 4.00
Fibre Sugar Carbohydrate Fat Calories Sodium
Never Rarely Sometimes Usually Always
Whereas 56.3% of the hypertensive and 64.3% of the normotensive participants reported
comparing the sodium contents among different brands, almost half of the participants
(43.8% hypertensive; 42.9% normotensive) reported having difficulty understanding the
information on food nutritional labels. More than 80% of the participants in both groups
reported focusing on the amount of a nutrient given in grams/milligrams rather than %
DV while looking at the NFT. Although participants were more likely to read the NFT
for sodium content and a majority of participants (68.8% hypertensive; 57.1%
normotensive) were willing to choose a product marked with a “low sodium label”,
almost all participants reported not paying attention to sodium content of food when
eating at a restaurant.
4.3.3.2 Sodium reducing behaviours
Although almost all the participants reported not being advised by a health professional
regarding sodium reduction in their diet because of a medical condition, more than half of
the participants in both groups (62.5% hypertensive; 57.1% normotensive) reported
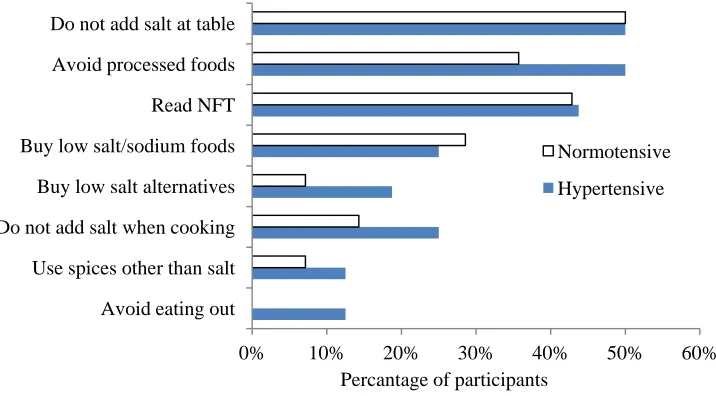
taking action on a regular basis to control/reduce salt or sodium intake. Of those who
reported taking action, many of them considered not adding salt at the table (50%
hypertensive; 50% normotensive), avoiding processed foods (50% hypertensive; 35.7 %
normotensive), and reading the NFT (43.8% hypertensive; 42.9% normotensive) in order
Figure 4.2: Regular actions taken by the participants to reduce salt/sodium intake. Participants (n=18) reported taking regular actions were allowed to report more than one action.
More than half of the participants (62.5% hypertensive; 50% normotensive) reported
avoiding purchasing a particular food in the past month because they thought it was too
high in sodium. The most common food items they avoided included prepackaged meals,
canned soup, and potato chips. However, 31.3% of the hypertensive and 35.7% of the
normotensive group reported not considering the level of sodium for almost all the foods
they had purchased over the past month.
Overall, participants were relatively knowledgeable regarding excess dietary sodium as a
health issue; however, their knowledge regarding daily recommendation and some food
sources of sodium was substantially low. This knowledge gap might have a negative
effect on what they buy and eat. Regardless of their knowledge in relation to dietary
sodium and hypertension, the hypertensive group was not concerned regarding the
sodium content in their diet. This is further evident by their behaviour, for example,
0% 10% 20% 30% 40% 50% 60% Avoid eating out
Use spices other than salt Do not add salt when cooking Buy low salt alternatives Buy low salt/sodium foods Read NFT Avoid processed foods Do not add salt at table
Percantage of participants
reading the NFT less often for sodium content than the other nutrients when purchasing
food and not looking for information on sodium when eating out.
4.3.4 Food purchasing patterns (from food receipts)
A total of 201 receipts from the 30 participants showed that 28% of the receipts came
from Metro, 15% from No Frills, 12% from fast-foods/restaurants and 8% from Remarks.
Other stores include Angelos, Superstore, Loblaws, Freshco, Food Basics, Shoppers Drug
Mart, Sobeys, Costco, Walmurt, Farmers’ Market and the Church Bazar. A total of 1,221
food items were represented by the receipts. The amount of sodium for 61 food items
(5%) could not be found and thus those food items were not included in the calculations.
No missing or forgotten receipts were reported by the participants.
The mean daily sodium purchased per 1000 kcal was an average of 5719.3 mg for the
hypertensive group compared to 3340.1 mg for the normotensive group. An
independent-sample t-test was conducted to compare mean sodium purchased per day in the
hypertensive and normotensive groups. There was no significant difference in the scores;
t(28) = 1.86, p = 0.07, which suggests that hypertension status has no relation with the
amount of dietary sodium purchases.
The top three food groups that contributed to total sodium purchased were prepackaged
meals (18.0%), condiments (14.8%), and breads & cereal (12.2%) for the hypertensive
group and cheese (12.9%), condiments (12.3%), and breads & cereal (11.9%) for the
normotensive group. Figure 4.3 shows the contribution of 11 major food groups to the