Suppression of Backscattering from 2-D Aperiodically-Ordered
Thinned Patch Array Using Rudin-Shapiro Sequences
Tarek Sallam1, * and Ahmed Attiya2
Abstract—The discovery of “quasi-crystals,” whose X-ray diffraction patterns reveal certain unusual features which do not conform with spatial periodicity, has motivated studies of the wave-dynamical implications of “aperiodic order.” This paper discusses various aperiodic configurations generated by Rudin-Shapiro (RS) sequences. These RS sequences constitute ones of the simplest conceivable examples of deterministic aperiodic geometries featuring random-like (dis)order. The scattering properties of aperiodically-ordered thinned 2-D patch arrays based on RS sequences are analyzed by using physical optics approximation. Compared to a periodic case, RS-based antenna array is found to have a substantial reduction in the magnitude of the backscattering component of the scattered signal with half of the elements and the same magnitude of specular reflection. This property is verified by illustrative numerical parametric studies.
1. INTRODUCTION
The discovery of “quasicrystals” [1–3] has motivated researchers on the study of aperiodically-ordered geometries. These aperiodically-ordered geometries represent the “gray zone” that separates
perfect periodicity from absolute randomness. In electromagnetics (EM) engineering, random or deterministicaperiodic geometries are usually used within the framework of antenna arraythinning[4–7], whereas multiperiod configurations have recently been proposed for optimizing the passband/stopband characteristics of frequency selective surfaces [8] and photonic bandgap devices [9].
In this paper, we focus on the opposite end of the above-mentioned aperiodic-order “gray zone,” namely, the random-like type of (dis)order. One of the simplest and most intriguing examples is provided by the Rudin-Shapiro (RS) sequences [10]. These sequences were developed in a pure-mathematics context by Shapiro and Rudin during the 1950s, pertaining to some extremal problems in harmonic analysis. More recently, RS sequences have found important practical applications as signal processing tools for spreading spectrum communication and encryption systems [11, 12]. One of the first applications of RS sequence and polynomials in electromagnetics was in [13] where the time-harmonic radiation properties of 1-D RS-based antenna array configurations have been investigated.
From the application viewpoint, the richness of the radiation/scattering signatures of the random
looking RS response could be exploited for synthesis of “simulated corrugated surfaces” [14] and, more generally, “virtual shaping” applications in radar countermeasures [15]. In addition, the RS-type synthesis seems to offer a simplefully deterministicalternative to typicalrandom thinning strategies for arrays of moderate to large size. In this connection, it is interesting to observe that this strategy is in a senseequivalent to acompletely random scheme, in which the antenna elements are turned ON/OFF with equal probability. On the other hand, the RS sequences could be exploited for applications such as suppression of specular reflection to yielduniform angular distribution of the scattered power as well as the study of phenomena like enhanced backscattering or enhanced normal scattering.
In the present study, we study the time-harmonic scattering signatures of oblique incident plane wave of 2-D RS-based aperiodically-ordered thinned arrays. The proposed arrays are composed of two
Received 12 January 2018, Accepted 26 February 2018, Scheduled 7 March 2018
* Corresponding author: Tarek Sallam ([email protected]).
arbitrary sizes of square patches [16], two arbitrary inter-element spacings, and two arbitrary states (ON/OFF) of patches.
2. BACKGROUND AND PROBLEM FORMULATIONS
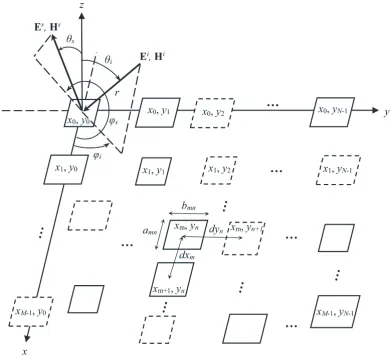
The problem geometry, a 2-D array ofM×N coplanar patches placed at the first quadrant ofxy-plane, is shown in Fig. 1. The patches are centered at xm,ynwith dimensions amn,bmn and center-to-center inter-element spacings dxm,dyn, wherem= 0, . . . , M−1;n= 0, . . . , N−1. The spacingdxm is given by xm+1−xm at some constant yn, while dyn equals yn+1−yn at some constant xm. The array is
thinned by controlling the ON/OFF status of the patches (The OFF patches are the dashed ones in Fig. 1).
Figure 1. Problem geometry. A time-harmonic plane wave with TE electric field illuminates a 2-D aperiodic thinned array of M ×N coplanar patches in the xy-plane. The patch centers, dimensions, and center-to-center inter-element spacings are denoted by xm, yn, amn, bmn, dxm, dyn, respectively (m= 0, . . . , M−1;n= 0, . . . , N−1). Dashed patches are the OFF patches.
The array is assumed to be illuminated by a time-harmonic [exp(jωt) time dependence], unit-amplitude, plane wave with TE electric field Ei. By adopting the 2-D polar (r, θ) coordinate system and assuming that the angles of incidence and scattering of plane wave are (θi, ϕi) and (θs, ϕs) respectively (as shown in Fig. 1), the spectral variables ksx =
k0sinθscosϕs, kix=k0sinθicosϕi, kys =k0sinθssinϕs, kiy =k0sinθisinϕi, where k0 = 2π/λ0 denotes
scattered field from the single patch (m, n) can be obtained by using physical optics approximation with neglecting mutual coupling between the patches as follows [17]:
Ers ∼= 0 (1a)
Eθs ∼= amnbmnk0e
−jk0r
2πr
cosθicosθscosϕs sinX X sinY Y (1b)
Eϕs ∼= amnbmnk0e
−jk0r
2πr
cosθi sinϕs sinX X sinY Y (1c) where
X = amn 2 (k
s
x+kxi) (2a)
Y = bmn 2 (k
s
y+kyi) (2b)
Thus, the total scattered field from (m, n)th patch can be written as
Emns =
(Ers)2+ (Eθs)2+ (Eϕs)2∼=
(Eθs)2+ (Eϕs)2 (3)
Now, the scattered field from the entire planar array, which is given by
EsM×N = M−1
m=0
N−1
n=0
Emns ej(kxs+kix)xmej(kys+kiy)yn (4)
can be controlled by varying the inter-element spacingsdxm/dynand/or the patch dimensionsamn/bmn and/or the ON/OFF status (expressed by the parameter t which takes “1” for ON state and “0” for OFF state) of the patch. Any of these parameters is supposed to take only two possible values (labeled with subscripts “a” and “b”, respectively) chosen according to a symbolic sequence generated from a two-symbol alphabet
ΨK =s0s1. . . sK−1, sk∈ {a, b} (5)
Attention is focused on a particular arrangement within rather general aperiodically-ordered array configurations based onsubstitutional sequences [18, 19] generated by substitution rulesξ that map the set of two letters{a, b} into the set of strings of arbitrary length consisting ofaand b. For a particular
ξ, the images of the two letters will be written explicitly as
ξ(a) =αpq(a, b)
ξ(b) =βrs(a, b) (6)
whereαpq(ab) [βrs(ab)] denotes a string of total lengthp+q [r+s] consisting of a certain permutation of a numberp[r] of “a” symbols and a numberq[s] of “b” symbols. Starting from a given initial string (“seed”), a substitutional sequence is generated by iterating the substitution rules in Eq. (6) indefinitely. In this paper, the two-symbol substitutional sequence used is the RS sequence.
RS sequences are two-symbol aperiodic sequences withrandom-like character [20–22]. In its basic form, an RS sequence is first generated from thetwo-symbol alphabet {−1,1} via the simple recursive rule
γ0 = 1, γ2k=γk, γ2k+1= (−1)kγk (7)
followed by a final projection onto the usual two-symbol alphabet {a, b} by replacing “1” by “a” and “−1” by “b. Thus, for instance, the very first ten symbols in the sequence are “aaabaabaaa” (with “a” seed). It can be shown that, in the limit of an infinite sequence, the two symbols have the same statistical frequency of occurrence [23].
3. PARAMETRIC STUDIES
The EM observable of interest is the bistatic radar cross-section (RCS) (scaled to the square of free-space wavelength)
RCS(θs) =r2EMs ×N2 (8) In all simulations, square patches are assumed (amn = bmn = lmn,∀m, n) with oblique (θi = 15◦,
ϕi= 45◦) uniform plane wave and the scattered field evaluated at ϕs = 225◦.
In any of the RS antenna array configurations below, each row or column of the array is generated iterating the RS substitution rule in Eq. (7) using a seed extracted randomly from a 105-element sequence (with “a” seed) (thedy,l, andt sequences are generated row-by-row taking the first N symbols while the dx sequence is generated column-by-column taking the first M symbols). It is also assumed that
dxa=dya=da and dxb =dyb =db.
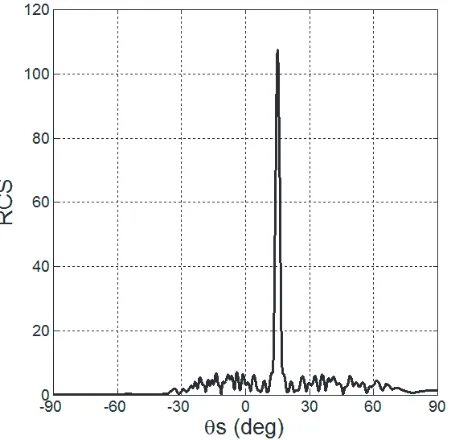
As reference, Fig. 2 displays the RCS response of a 10×10 fully populated (ta=tb = 1) periodic antenna array having identical square patches (la = lb = 1.2λ0), with da = db = 2.5λ0. As shown in
Fig. 2, the RCS response of the periodic array exhibits three dominant peaks: one strong peak (specular reflection) with amplitude of 107.5 and other two weaker backscattered components with the highest one having amplitude about 47 (nearly 44% of the specular reflection amplitude) at −17.8◦.
Figure 2. The RCS response of the fully populated periodic antenna array made of 100 identical square patch elements withta =tb = 1,
la=lb = 1.2λ0, andda=db = 2.5λ0.
Figure 3. As in Fig. 2, but with da= 2.5λ0 and
db = 1.6da.
In order to illustrate the role played by the inter-element spacing, Fig. 3 displays the RCS response of an RS antenna array with the same configuration as the periodic array in Section 3.1. However, in this caseda= 2.5λ0anddb= 1.6da. The RCS response in Fig. 3 exhibits only one strong peak (specular
reflection) with the same amplitude as in the periodic array. The maximum backscattered component in this case is reduced to about 7 (only 6.5% of the specular component) at −4◦.
It is clear that the structure of the scattered signal depends on the scattered field of the single patch in Eq. (3), which can be controlled by acting on the patch dimension (lab). The patch dimensions should not be too small to apply PO approximation or too large to avoid inter-element coupling. In the present analysis, la,b ≥ 1.2λ0 are considered, always ensuring edge-to-edge inter-element distances > λ0/2.
Figure 4. As in Fig. 2, but withla = 1.2λ0 and
lb = 2λ0.
Figure 5. As in Fig. 2, but with ta = 1 and
tb = 0.
Fig. 4 that the specular component has been doubled (the total area of patches is also doubled) with a 36% decrease in the maximum backscattered component.
The next step is to study the sequence of patch ON/OFF state ({t}sequence) which is generated according to the RS sequence. Recalling that ta = 1 if the patch exists (“active” or ON patch) and
tb = 0 if the patch does not exist (“transparent” or OFF patch), one may interpret this choice as a specialdeterministic “array thinning” strategy. The RCS response of this array is shown in Fig. 5 which is the same as in Fig. 2, but in this case ta = 1 and tb = 0. From Fig. 5, it can be seen that both the specular component and maximum backscattered component have been halved (both the array size and the total area of patches are also halved).
4. THE FULLY RS ANTENNA ARRAY
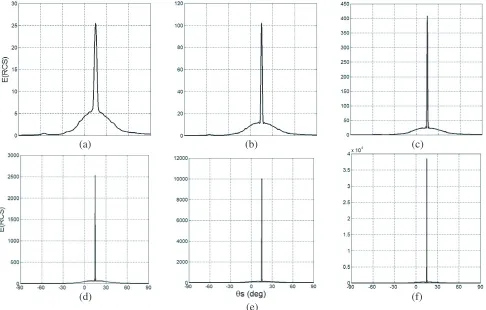
Now, the fully RS array is presented in which all parameters (d, l, and t) are perturbed (from the periodic arrangement) according to the RS sequence. The RCS response of this array is shown in Fig. 6. Comparing the fully RS array in Fig. 6 to the fully periodic one in Fig. 2, one can see that they have almost the same magnitude of the specular reflection but with a substantial suppression (by 79%) in the maximum backscattered signal in the RS case. This is achieved in the RS array by using half of the elements of the periodic array, with a little reduction (about 0.2%) in the total area of the patches and an increase in the array aperture lengths by 7.5 and 9 wavelengths in x- and y-directions, respectively. Now, we address the study of theglobal versuslocal ordering effects via a statistical analysis of the RCS response in Eq. (8) for different array sizes. The statistical population is constructed by generating a 105-element sequence (with “a” seed) and by randomly extracting 1000 different realizations of a given size. As an example, Fig. 7 shows the average RCS response (denoted as E(RCS(θs))) for an RS array of size 5×5, 10×10, 20×20, 50×50, 100×100, and 200×200. As expected, the spectral resolution increases with the array size, displaying a progressively finer structure.
We also study the (normalized) standard deviation
σ(θs) =
E RCS2(θs)−E2(RCS(θ
s))
maxθsRCS(θs) (9)
Figure 6. The RCS response of the fully RS antenna array.
(a) (b) (c)
(d)
(e)
(f)
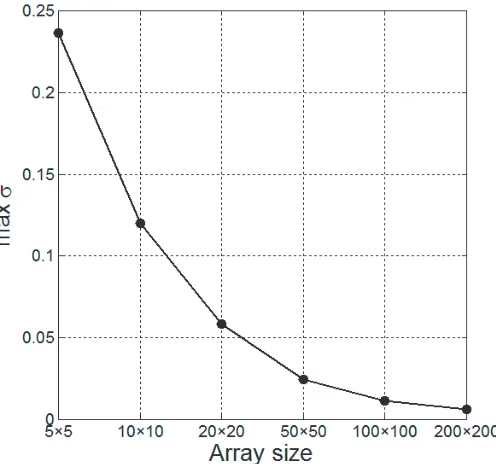
Figure 8. As in Fig. 7, but (maximum over θs) normalized standard deviation in (9) as a function of array size.
Intuitively, such effects are expected to be significant for relatively small-size arrays (where the local
ordering plays a major role), and to become negligible for large-size arrays (where the response is dominated by theglobal symbol proportions). Fig. 8 shows the (maximum overθs) normalized standard deviation in Eq. (9), as a function of the array size, for the example in Fig. 7. As expected, the standard deviation decreases monotonically with the array size. One observes a decrease of one order of magnitude, from σ5×5 = 0.24 to σ200×200= 0.006.
5. CONCLUSIONS
This paper presents a detailed study of plane-wave scattering due to a 2-D aperiodically-ordered thinned patch-array based on RS sequences within the framework of PO approximation. In particular, the roles of inter-elements spacings, patch dimension, and patch ON/OFF status are highlighted. It is shown that the fully thinned RS antenna array has strongly suppressed the maximum backscattered component of the scattered signal without changing the magnitude of the specular reflection using half of the elements compared to the fully periodic array. It is found that this RS-based antenna array configuration achieves a reduction in the magnitude of backscattering component of the scattered signal by about 79% using half of the elements. In this case the array aperture lengths are increased by 7.5 and 9 wavelengths inx- andy-directions, respectively. However, the total area of patches and the magnitude of specular reflection are the same as the fully populated periodic array.
REFERENCES
1. Senechal, M., Quasicrystals and Geometry, Cambridge Univ. Press, Cambridge, U.K., 1995. 2. Baake, M., J.-B. Suck, M. Schreiber, and P. H¨aussler (eds.), “A guide to mathematical
quasicrystals,”Quasicrystals: An Introduction to Structure, Physical Properties, and Applications, 17–48, Springer, Berlin, Germany, 2002.
3. Levine, D. and P. J. Steinhardt, “Quasicrystals: A new class of ordered structures,” Phys. Rev. Lett., Vol. 53, No. 26, 2477–2480, Dec. 1984.
5. Steinberg, B. D., “Comparison between the peak sidelobe of the random array and algorithmically designed aperiodic arrays,”IEEE Trans. Antennas Propagat., Vol. 21, 366–370, May 1973.
6. Kim, Y. and D. L. Jaggard, “The fractal random array,” Proc. of the IEEE, Vol. 74, No. 9, 1278– 1280, Sep. 1986.
7. Sallam, T. and A. Attiya, “Sidelobe reduction and resolution enhancement by random perturbations in periodic antenna arrays,” The 34th National Radio Science Conference (NRSC’17), 49–55, Alexandria, Egypt, Mar. 2017.
8. Prakash, V. V. S. and R. Mittra, “An efficient technique for analyzing multiple frequency-selective-surface screens with dissimilar periods,” Microwave Opt. Technol. Letts., Vol. 35, No. 1, 23–27, Oct. 2002.
9. Chiau, C. C., X. Chen, and C. Parini, “Multiperiod EBG structure for wide stopband circuits,”
IEE Proc. Microwaves, Antennas and Propagat., Vol. 150, No. 6, 489–492, Dec. 2003.
10. Rudin, W., “Some theorems on Fourier coefficients,” Proc. Amer. Math. Soc., Vol. 10, 855–859, 1959.
11. Dixon, R. C.,Spread Spectrum Systems with Commercial Applications, Wiley, New York, 1994. 12. La Cour-Harbo, A., “On the Rudin-Shapiro transform,” Appl. Comp. Harmonic Anal., Vol. 24,
No. 3, 310–328, 2008.
13. Galdi, V., V. Pierro, G. Castaldi, I. M. Pinto, and L. B. Felsen, “Radiation properties of one-dimensional random-like antenna arrays based on Rudin-Shapiro sequences,” IEEE Trans. Antennas Propagat., Vol. 53, No. 11, 3568–3575, Nov. 2005.
14. Stephen, D. S., T. Mathew, K. A. Jose, C. K. Aanandan, P. Mohanan, and K. G. Nair, “New simulated corrugated scattering surface giving wideband characteristics,” Electron. Lett., Vol. 29, No. 4, 329–331, Feb. 1993.
15. Swandic, J. R., “Bandwidth limits and other considerations for monostatic RCS reduction by virtual shaping,” Tech. Rep. A927 224, Naval Surface Warfare Center, Carderock Div., Bethesda, MD, Jan. 2004.
16. Jayasinghe, J. W., J. Anguera, and D. N. Uduwawala, “A high-directivity microstrip patch antenna design by using genetic algorithm optimization,”Progress In Electromagnetics Research C, Vol. 37, 131–144, 2013.
17. Balanis, C. A.,Advanced Engineering Electromagnetics, 2nd edition, John Wiley & Sons, Inc., New York, 2012.
18. Kol´ar, M., “New class of one-dimensional quasicrystals,”Phys. Rev. B, Vol. 47, No. 9, 5489–5492, Mar. 1993.
19. Kol´ar, M., B. Iochum, and L. Raymond, “Structure factor of 1D systems (superlattices) based on two-letter substitution rules: I. δ (Bragg) peaks,” J. Phys. A: Math. Gen., Vol. 26, No. 24, 7343–7366, Dec. 1993.
20. Brillhart, J. and P. Morton, “A case study in mathematical research: The Golay-Rudin-Shapiro sequence,”Amer. Math. Mon., Vol. 103, No. 10, 854–869, Dec. 1996.
21. Queff´elec, M., “Substitution dynamical systems — Spectral analysis,” Lecture Notes in Mathematics, Vol. 1294, Springer, Berlin, 1987.
22. Fogg, N. P., V. Berth´e, S. Ferenczi, C. Mauduit, and A. Siegel (eds.), “Substitutions in dynamics, arithmetics, and combinatorics,” Lecture Notes in Mathematics, Vol. 1794, Springer, Berlin, 2002. 23. Berth´e, V., “Conditional entropy of some automatic sequences,” J. Phys. A, Math. Gen., Vol. 27,