Scholarship@Western
Scholarship@Western
Electronic Thesis and Dissertation Repository
9-24-2018 9:30 AM
Effects of water temperature, rearing temperature and population
Effects of water temperature, rearing temperature and population
on swimming performance and temperature preference in Atlantic
on swimming performance and temperature preference in Atlantic
salmon (Salmo salar)
salmon (Salmo salar)
Nicole Zathey
The University of Western Ontario
Supervisor Neff, Bryan D.
The University of Western Ontario Graduate Program in Biology
A thesis submitted in partial fulfillment of the requirements for the degree in Master of Science © Nicole Zathey 2018
Follow this and additional works at: https://ir.lib.uwo.ca/etd
Part of the Marine Biology Commons
Recommended Citation Recommended Citation
Zathey, Nicole, "Effects of water temperature, rearing temperature and population on swimming
performance and temperature preference in Atlantic salmon (Salmo salar)" (2018). Electronic Thesis and Dissertation Repository. 5804.
https://ir.lib.uwo.ca/etd/5804
This Dissertation/Thesis is brought to you for free and open access by Scholarship@Western. It has been accepted for inclusion in Electronic Thesis and Dissertation Repository by an authorized administrator of
ii
Abstract
Understanding how animals respond to environmental temperatures is important for the survival and reintroduction of species. My objectives were to determine how swim
performance responds across water temperatures, and how rearing temperature or population would affect this performance and temperature preference. Juvenile Atlantic salmon (Salmo salar) from two populations that are currently used for stocking in Lake Ontario (LaHave, Sebago) were reared at two temperatures (11°C, 19°C). I measured critical swim speed and burst swim speed across eight water temperatures (11 – 25°C). Water temperature had no effect on burst speed, while critical swim speed increased with increased temperatures. I found no effect of rearing temperature on burst speed, but critical swim speed was
significantly higher for fish reared at 11°C than fish reared at 19°C. Temperature preferences aligned with rearing temperature in the Sebago population but not the LaHave population. Atlantic salmon demonstrate plasticity in swim performance and temperature preference.
Keywords
iii
All work was completed under the supervision of Bryan Neff at The University of Western
Ontario. Glenn Tattersall from Brock University helped with study design, equipment set-up
and analysis. Nicole Zathey performed data collection, analysis and wrote this thesis. The
data contained in the thesis will be submitted for publication with Bryan Neff and Glenn
iv
Acknowledgments
First off, I would like to thank my supervisor Bryan Neff, for without him this project would
have never been possible. I would like to thank Shawn Garner, for his help with every step of
this project, and for guiding me through plumbing 101. I’d like to thank Glenn Tattersall
from Brock University and Trevor Pitcher from Windsor University for the use of their
equipment and expertise. I’d like to thank my numerous work-study students, who put in
long hours each and every day throughout experiments. I’d like to thank Yolanda Morbey
and Brent Sinclair for being on my committee and helping me through this process. Carlie
Muir and Chris Therrien thank you for your help with looking after my fish. To my other lab
mates, Adriano Alonso Pereira da Cunha, Mat Stefan, Kim Mitchell, and Tim Hain, thank
you for your welcomed distractions in Collip.
I’d like to thank my parents, Helga and Peter, for encouraging me to persevere
through difficult points in my education. And to Ben Moyer and Chelsey Baschuk, for their
v
Table of Contents
Abstract ... ii
Co-Authorship Statement ... iii
Acknowledgments ... iv
List of Tables ... vii
List of Figures ... viii
List of Appendices ... ix
List of Abbreviations ... xi
Introduction ... 1
1.1 Thermal ecology ... 1
1.2 The effect of temperature on physiology and evolution ... 2
1.3 Thermal performance curves ... 3
1.4 Locomotion ... 7
1.5 Burst speed ... 8
1.6 Critical swim speed ... 12
1.7 Temperature Preference ... 15
1.8 Atlantic salmon ... 18
1.9 Experimental design ... 21
Methods ... 22
2.1 Experimental fish ... 22
2.2 Burst speed ... 24
2.3 Critical swim speed ... 27
2.4 Temperature Preference ... 29
2.5 Statistical analysis ... 30
Results ... 31
3.1 Study fish ... 31
3.2 Burst speed ... 33
vi
3.4 Temperature preference ... 37
Discussion ... 39
4.1. Burst speed is independent of water temperature ... 39
4.2. Burst speed does not exhibit plasticity based on rearing temperature ... 41
4.3. Fish from the Sebago population have faster burst speeds than the LaHave population ... 44
4.4. Critical swim speed increases across water temperatures ... 45
4.5. Complex relationship between rearing temperature and critical swim speed ... 47
4.6. Sebago fish display plasticity in temperature preference ... 50
4.7. Temperature preference does not relate to optimal temperature of burst speed or critical swim speed ... 51
4.8. Management Implications ... 52
4.9 Significance of results ... 53
4.10. Study limitations ... 54
4.11. Future Directions ... 55
4.12. Conclusions ... 56
References ... 57
Appendices ... 68
vii
List of Tables
viii
List of Figures
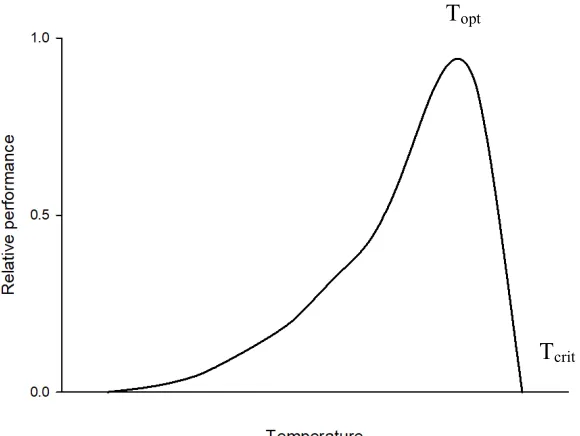
Figure 1: A hypothetical thermal performance curve showing optimal temperature (Topt) and
upper critical temperature (Tcrit), adapted from Huey & Stevenson (1979). ... 6
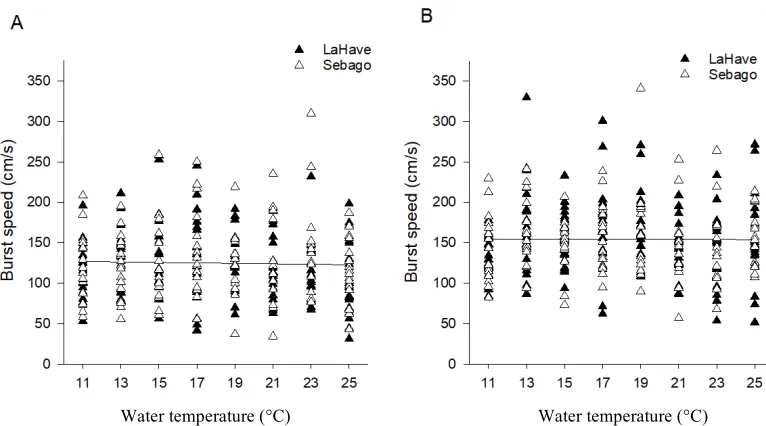
Figure 2: Burst speed (cm/s) as a function of water temperature for juvenile Atlantic salmon (Salmo salar) reared at (A) 11°C or (B) 19°C. Lines represent a linear regression plotted through all points in each panel that are both non-significant. ... 34
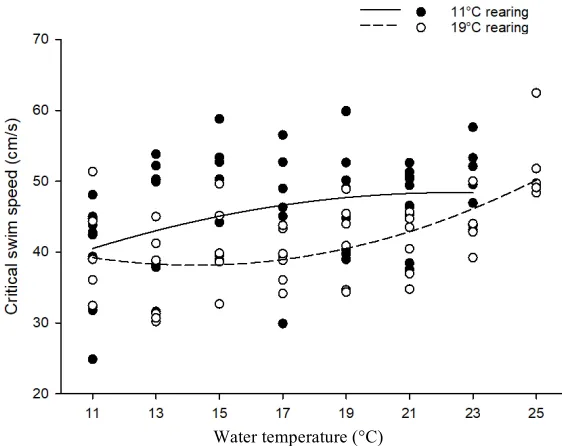
Figure 3: Critical swim speed (cm/s) as a function of water temperature for juvenile Atlantic salmon (Salmo salar) from the Sebago population. Lines represent quadratic regressions plotted through the points for each rearing temperature. The equation of the line for the fish reared at 11°C is y = -0.061x2 + 2.73x + 17.83. The equation of the line for the fish reared at 19°C is y = 0.104x2 - 2.94x + 59.05. ... 36
ix
List of Appendices
Appendix A. The randomized order of water temperatures (°C) used for burst speed trials of Atlantic salmon. Blocks were used to describe fish that underwent trials at the same time through the same order of temperatures, and also correspond to order of calendar dates (block 1 fish performed trials months before block 15). ... 68
Appendix B: A) A photo of an Atlantic salmon swimming in the swim flume. B) A
schematic of the swim flume showing the propeller, diffuser, chamber and metal grid. The arrows represent laminar flow. ... 69
Appendix C: The semi-randomized order of water temperatures (°C) used for critical swim speed trials of Atlantic salmon. Groups were used to describe fish that underwent trials at the same time through the same order of temperatures, and also correspond to order of calendar dates (block 1 fish performed trials before block 3). Fish died during group 1 at the highest test temperatures, so subsequent groups ended in the highest test temperatures of 23 and 25. ... 70
Appendix D: Flow chart of the sequence of metrics that a single juvenile Atlantic salmon underwent. Burst speed trials were completed over 8 days. A minimum of one day of rest was given before temperature preference trials were start. Temperature preference trials were performed on each fish individually over the next 5 days. Then a subset of fish from the Sebago population underwent critical swim speed trials. ... 71
Appendix E. A photo of the shuttlebox showing the two chambers and the opening between them. ... 72
Appendix F. Examples of raw shuttlebox data for an Atlantic salmon from the Sebago population reared at 19°C (grey) or reared at 11°C (black). Experienced temperature is the temperature the fish was exposed to (depending on what chamber of the shuttlebox was occupied) and was recorded every second throughout trials. ... 73
x
Appendix H: Critical swim speed (BL/s) as a function of water temperature for juvenile Atlantic salmon (Salmo salar) from the Sebago population. ... 75
xi
List of A
bbreviations
SMR standard metabolic rate
MMR maximum metabolic rate
TPC thermal performance curve
Topt optimal temperature
Tcrit critical temperature
ATP adenosine triphosphate
OMNRF Ontario Ministry of Natural Resources and Forestry
SD standard deviation
n sample size
LAH LaHave population
SEB Sebago population
Introduction
1.1 Thermal ecology
The effect of temperature on organismal fitness is currently a subject of major interest in
the field of biology. These effects often differ between endotherms, which are organisms
such as mammals or birds that can internally regulate their body temperature, and
ectotherms, which are organisms such as insects, amphibians, and lizards that cannot
internally regulate their body temperature. Since body temperature in ectotherms is
dependent on environmental temperatures, understanding the relationship between
temperature and fitness is of particular interest for ectotherms. Understanding how
environmental temperatures will affect organism survival is important because
temperature affects the distribution of species and speciation (Chen et al. 2011; Keller
and Seehausen 2012; Hanly et al. 2017; Kong et al. 2017).
Three ways organisms can respond to temperature change are through genetic
adaptation, phenotypic plasticity, or behaviourally by migrating to areas with a preferred
temperature. Genetic adaptations are changes in the genotypes of populations that occur
through natural selection and confer a fitness advantage (Fuller et al. 2010). Phenotypic
plasticity is the ability of individuals of a particular genotype to change their phenotype
in different environments (Pigliucci 2005). In some cases, both genes and environment
can shape thermal performance, but this interaction is not well understood (Pigliucci
2005). Another way organisms can respond to environmental temperatures is through
There is currently a gap in thermal ecology to better understand how organisms
will respond to changing temperatures. It is not well understood the roles genetic
adaptation or phenotypic plasticity will play in allowing organisms to survive in current
thermal environments or persist as thermal environments change (Gunderson & Stillman
2015). My thesis will address this gap by looking at the effects of temperature on swim
performance and temperature preference, and examining if these traits display plasticity
or differ across populations in Atlantic salmon (Salmo salar).
1.2 The effect of temperature on physiology and evolution
Temperature has been labeled the “ecological master factor” in ectotherms because it
affects many different aspects of an organism’s life (Brett 1971). For ectotherms,
temperature can affect growth, aerobic scope, and even drive speciation. Temperature
plays an important role in growth because it increases metabolism by changing the rate of
biochemical reactions associated with the breakdown and absorption of food products
(Gillooly et al. 2001). Increased temperature can cause increases in enzyme activity that
are important for metabolism, however, exposure to high temperatures can lead to
enzymes becoming inactive or denaturing (Peterson et al. 2007).
Temperature also affects aerobic scope. Aerobic scope is the difference between
standard metabolic rate (SMR, energy required to keep an organism alive when not
feeding, reproducing or moving) and maximum metabolic rate (MMR) (Fry 1947; Farrell
2009). This difference gives an organism the capacity to perform aerobic activities
(Casselman et al. 2012). As temperatures increase, kinetic energy in molecules increase,
resting metabolic rate and the need for oxygen to fuel metabolism increases. Over
intermediate temperatures, MMR increases faster than SMR, leading to a large aerobic
scope (Pörtner 2010). However, at higher temperatures MMR plateaus as the body is
constrained by an upper level of metabolism and oxygen consumption, but SMR keeps
increasing exponentially, until the two rates equal each other and aerobic scope collapses.
In addition to affecting growth and aerobic scope, temperature has been found to
drive speciation in plants and animals across thermal environments. In 16 species of
plants and animals, divergent selection based on thermal adaptations was linked to partial
reproductive isolation, which can further lead to speciation (Keller and Seehausen 2012).
In China, plant speciation rate was correlated with changes in historic temperatures as
assessed by chloroplast and nuclear DNA (Kong et al. 2017). Therefore, temperature is
one of the major ecological factors that affect ectotherms.
Many studies look at how acclimation temperature affects physiology or ecology.
Acclimation involves the physiological response of an organism to its environment, and
is often used on the short-term scale (weeks to months). For my thesis, I used the term
rearing temperature instead of acclimation temperature because my fish were exposed to
these temperatures throughout a time of growth and development (juvenile stage).
1.3 Thermal performance curves
Because temperature is such an important factor affecting ectotherms, there is significant
interest in understanding how temperature can affect organismal fitness. One method for
understanding this relationship is by using thermal performance curves (TPCs), which
range of temperatures (Huey and Stevenson 1979). The classic shape for a TPC of an
ectotherm is a left-skewed bell-shape, which initially shows a gradual increase in
performance with increasing temperature, followed by a steep decline in performance at
high temperatures (Huey and Stevenson 1979; Fig. 1). Two key measures that can be
derived from TPCs are the optimal temperature (Topt) and upper critical temperature
(Tcrit). Topt is the temperature at which an individual’s performance is maximized and Tcrit
is the upper temperature where performance falls to zero (Huey and Stevenson 1979).
TPCs are believed to follow a bell-shape curve in part due to the relationship between
temperature and aerobic scope, and traits linked to aerobic metabolism may thus be most
likely to show this characteristic shape. Aerobic activities include growing and
reproduction, which have direct links to fitness, which is the ability of an organism to
survive and reproduce. Less is known about the shape of TPCs for traits that are not
linked to aerobic metabolism, although they may also show a bell-shape due to effects of
temperature on reaction kinetics and enzyme activity (Wilson et al. 2002; Norin et al.
2014).
While many studies have examined TPCs, there are some questions that are still
not well resolved. Two common assumptions of TPCs are that thermal performance does
not change across a species’ range (i.e. no local adaptation) and that prior experience to
thermal environments does not result in plasticity (Sinclair et al. 2016). This means that
many studies have only focused on only one population, instead of comparing across
populations, and that organisms are reared under one set of thermal conditions, instead of
examining how rearing temperature can influence performance. While scientists may not
differences. A common problem in these thermal ecology studies is when conclusions are
draw for an entire species, without accounting for these differences that can arise across
populations or when organisms face varying thermal environments.
TPCs can be a useful tool for biologists to gain a better understanding of how
organisms will respond across a range of temperatures (Huey and Stevenson 1979). Due
to the threat of climate change, there has been renewed interest in TPCs because they can
be used to predict success of species and populations under different temperature
scenarios (Huey and Kingsolver 2011; Schulte et al. 2011; Muñoz et al. 2015).
Understanding the relationship between ectotherms and raising temperatures will only
become more important as organisms are pushed closer to their upper critical
Figure 1: A hypothetical thermal performance curve showing optimal temperature (Topt)
and upper critical temperature (Tcrit), adapted from Huey & Stevenson (1979).
Topt
1.4 Locomotion
Temperature influences locomotion in lizards (Huey 1982; Xiang et al. 1996;
Zamora-Camacho et al. 2015), amphibians (Arendt 2003; Arendt and Hoang 2005), and fish
(Brett 1964; Beamish 1966; Batty and Blaxter 1992), with lower and upper temperatures
constraining movement. Two ways movement can be fueled is through either glycolytic
or oxidative pathways. Glycolytic metabolism fuels anaerobic movements such as quick
bursts used in predator avoidance or prey capture (Domenici and Blake 1997). Oxygen is
not required to generate the energy needed to fuel these movements (Hargreaves 1995).
Oxidative metabolism fuels aerobic movements that need to be sustained for longer
periods of time, such as long distance running or swimming (Farrell et al. 2009). Oxygen
is required to generate the energy to maintain these movements (Hargreaves 1995).
The two main types of skeletal muscle fibers in fish are fast-twitch and
slow-twitch (Johnston 1999). Fast-slow-twitch fibers are associated with glycolytic metabolic
pathways. These fibers are associated with high-speed swimming for short periods of
time. Slow-twitch fibers are associated with oxidative metabolic pathways (Johnston
1999). These fibers are associated with routine swimming, such as for foraging and
migration. Embryonic fish have proportionately more slow-twitch muscle fibers
compared with older fish that have more fast-twitch fibers (Vieira and Johnston 1992).
Therefore, proportional amounts of each type of muscle fiber can change as fish grow
and develop. Fish can increase muscle size as well as number of muscle fibers throughout
their lives (Stickland 1983). Therefore, changes in water temperatures after fish are
The heart is important for aerobic performance because it is the organ that
circulates oxygen-carrying blood around the body. In fish, oxygen is taken up from the
water through the gills by the process of diffusion. Blood is transported around the body
delivering this oxygen and when it reaches the heart, it is pumped back to the gills to
uptake more oxygen. When temperature is increased, heart rate increases (Farrell et al.
2009). This increased demand on the heart can cause physiological changes to the heart
over time.
Previous studies have shown that it is the heart’s ability to pump oxygen to
surrounding tissues that limits oxygen in the body, not oxygen uptake at the gills or tissue
utilization (Penney et al. 2014). Over the period of a few months, temperature can affect
relative ventricular mass (mass of the ventricle compared to the body mass), cardiac
pacemaker rate (generates action potentials for the heart to contract), and thickness of the
heart ventricle (Gamperl & Farrell 2004; Anttila et al. 2013; Anttila et al. 2015). Cardiac
output is a product of heart rate (beats per minute) and stroke volume (amount of blood
pumped) (Keen & Farrell 1994). Higher temperatures increase the oxygen demand of
tissues. With a higher cardiac output, more blood is being circulated around the body, and
more oxygen can be delivered at a faster rate to these tissues. In order to generate this
increase cardiac output, changes in morphology will be observed. Therefore, differences
in the heart may account for differences in aerobic performance observed.
1.5 Burst speed
Anaerobic locomotion is commonly measured by burst speed (Guderley and Blier, 1988).
1988). Burst speed has direct ecological relevance in predator avoidance and prey capture
(Domenici and Blake 1997). Organisms that swim faster are more likely to avoid predator
attacks. In Pseudacris regillatadpoles, tadpoles that escaped attacks by predatory garter
snakes (Thamnophis sirtalis fitchii) swam almost twice as fast as tadpoles that were eaten
by the snakes (Watkins 1996). Populations of mosquitofish (Gambusia affinis) that
originated from areas with high predation had 20% faster burst speeds than populations
with low predation, showing that fast burst speeds are an adaptive trait that can be
selected for (Langerhans et al. 2004). Therefore, fast burst speed may be an important
trait for predator avoidance.
Burst speed may also be important for predators to successfully capture prey
(Arnold et al. 1991). For example, juvenile salmon feed by stationing themselves in areas
of fast flowing streams, and then dart out to retrieve floating prey. Once food is captured,
they are pushed downstream and must swim back to their original location to wait for
their next prey item. Huey et al. (1984) found that species of lizards that used a
sit-and-wait tactic for hunting had higher burst speeds than species that continuously actively
foraged. Therefore, foraging style may also determine what species have faster or slower
burst speeds.
For animals that move in water, two ways burst speed can be measured is through
maximal velocity or a c-start (sometimes s-start), and authors will often refer to both of
these movements as burst speed. Maximal velocity is the fastest velocity an organism can
maintain over a short distance, whereas, a c-start is characterized by the curve of the body
into a c shape at the beginning of a quick movement (s-start is the curve of the body in an
velocities begin with a c-start, but a fish could perform a c-start and not have a maximal
velocity if they do not move. If movement forward does not follow the initial muscle
contraction, then neither prey will be captured nor predators avoided. For my thesis I
chose to measure maximal velocity, and will be referring to maximal velocity as burst
speed for the rest of my thesis.
Early studies found burst speed to be independent of water temperatures;
however, new studies are showing that the burst speed of certain species respond to water
temperatures (Guderley and Blier 1988). Brett (1971) found burst speed to be
independent of water temperatures in sockeye salmon (Oncorhynchus nerka), and Blaxter
and Dickens (1959) found no consistent effect of water temperature on burst speed in
herring (Clupea harengus). Whereas Rulifson (1977) found that water temperature
followed a linear regression for burst speed for juvenile striped mullet (Mugil cephalus),
spot (Leiostomu xanthunrs), and pinfish (Lagodon rhomboids). In contrast, Johnson and
Bennett (1995) found that both goldfish (Carassius auratus) and killifish (Fundulus
heteroclitus) had burst speeds that peaked at intermediate temperatures, with slower burst
speeds at lower and higher temperatures, following a shape more consistent with aerobic
activity. While researchers have assumed that burst speed is independent of water
temperature because it is anaerobic, there appears to be some species-specific results.
Rearing temperature can cause changes in burst speed. Rearing temperature is the
temperature that organisms face during their time of growth and development. For this
thesis, rearing temperature is temperature applied to an organism in the juvenile stage
over several months. Acclimation temperature is a temperature that the organism is
temperatures applied from weeks to a couple of months in any life stage. For fish and
amphibians mentioned in this thesis, this represents a relatively short period in the
organism’s entire life span. Arendt and Hoang (2005) found that Spea hammondii
tadpoles reared at a cooler temperature had faster burst speed than those reared at a
warmer temperature. Barramundi (Lates calcarifer) reared at the coolest water
temperature outperformed individuals that were reared at warmer temperatures when
tested at a cool water temperature (Norin et al. 2014). This relationship was not observed
when these cold-reared individuals were tested at higher water temperatures, as
individuals from all rearing temperatures performed equally as well. Claireaux et al.
(2007) found that an increase of acclimation temperature from 12°C to 22°C resulted in a
21% mean increase in sprint speed of European sea bass (Dicentrarchus labrax) when
tested at a common temperature of 15°C. Threespine sticklebacks (Gasterosteus
aculeatus) were reared in either 8°C or 23°C water and tested at water temperatures of
8°C or 23°C in the spring and fall (Guderley et al. 2001). Differences in burst speed were
only found at the 23°C water temperature. In the spring, the fish reared at the cooler
temperature were faster, whereas in the fall, fish reared at the warmer temperature were
faster. None of these studies looked at multiple temperatures across a wide range of water
temperatures. Burst speed does demonstrate plasticity based on rearing temperature, but
the direction and magnitude of effects appear to be species-specific.
Genetic adaptation may also lead to differences in burst speed based on
differences in local environments. O’Steen et al. (2002) found that populations of guppy
(Poecilia reticulata) from high predation streams had higher survival than populations
escape ability, which would include burst speed as well as evasiveness. As described
above, mosquitofish populations that frequently encountered high predation had faster
burst speeds than mosquitofish populations that came from areas with low predation
(Langerhans et al. 2004). Populations from high predation areas had larger caudal
regions, smaller heads, and more elongated bodies, which would improve the
hydrodynamics of these fish and could contribute to the increased burst speed. Therefore,
differences in predation risk have led to differences in body morphology that can affect
burst speeds.
1.6 Critical swim speed
Prolonged swimming is commonly measured by critical swim speed (a test developed by
Brett (1964), where water velocity is incrementally increased until the fish reaches
exhaustion), and represents prolonged swimming. Prolonged swimming is important for
fish during routine swimming and long migrations (Guderley & Blier 1988). In juvenile
salmon, prolonged swimming is important for moving around the stream and finding
suitable areas to station themselves for feeding (Leavy & Bonner 2009). At temperatures
approaching their upper thermal limits, fish will be unable to sustain aerobic swimming
(Brett 1967). In salmonids, prolonged swimming is most important during upstream
migrations to spawning grounds. Warm river temperatures have been linked to failed
upstream migration (Farrell et al. 2008), which prevent reproduction from occurring.
Critical swim speed requires the use of oxygen to sustain this prolonged
swimming. Critical swim speed is also associated with the heart’s ability to supply
with greater thermal tolerances have been found to have higher hematocrit (percentage of
red blood cells relative to total blood volume) (Gradil 2015), larger heart ventricles
(Anttila et al. 2013; Anttila et al. 2015), and more myoglobin (oxygen-binding protein in
muscle) (Anttila et al. 2013), which may all aid in supplying more oxygen to the body.
The oxygen and capacity limited thermal tolerance (OCLTT) hypothesis states
that aerobic performance is limited by oxygen, and is the basis for a growing field of
work that examines the heart as it relates to aerobic performance (Pörtner 2001, Pörtner
& Farrell 2008, Pörtner 2010). Previous studies on salmon have used heart rate as a proxy
for aerobic performance, which can be used to rapidly assess optimal temperature and
upper critical temperature (Casselman et al. 2012). Multiple studies have found aerobic
performance results consistent with the OCLTT framework (Farrell 2009, Anttila et al.
2014, Gradil et al. 2015). However, there have been many criticisms of the OCLTT.
Juvenile barramundi, pink salmon (Oncorhynchus gorbuscha), and Atlantic halibut
(Hippoglossus hippoglossus)maintain aerobic scope at temperatures above those
ecologically relevant, but other aerobically driven activities such as growth or
reproduction are unable to occur at these high temperatures (Clark et al. 2011, Gräns et
al. 2014, Norin et al. 2014). This mismatch between aerobic scope and other aerobic
activities shows that oxygen delivery is not the limiting factor, as would be predicted by
the OCLTT.
Critical swim speed has been shown to peak at intermediate water temperatures,
and decrease at upper or lower water temperatures, which follows the classic shape of a
TPC. This relationship was highlighted by Brett (1967) in sockeye salmon and in coho
was 15°C and for coho salmon ~20°C, with slower swim speeds at higher and lower
water temperatures. In contrast, Wilson et al. (2002) examined the Antarctic fish
Pagothenia borchgrevinki and found that critical swim speed peaked at the lowest water
temperature (-1°C), and declined with temperatures approaching 8°C. Therefore, TPCs
for critical swim speed typically follows a bell-shape curve, but this is not true for every
species.
Critical swim speed has been shown to respond to rearing temperature. Striped
bass (Morone saxatilis) were acclimated to 9°C or 25°C and performed critical swim
speed tests at a common temperature of 15°C (Sisson and Sidell 1987). Bass acclimated
to 9°C had a higher critical swim speed than bass acclimated to 25°C. The authors
suggest this increase in critical swim speed is due to the cold acclimated fish delaying the
need for fast-twitch muscle fibers that are used as after slow-twitch muscle fiber begins to
fatigue. In coho salmon, acclimation temperature changed the shape of the TPC, and
slightly changed the optimal temperature, but most fish still had an optimal temperature
around 20°C regardless of acclimation temperature (Griffiths and Alderdice 1972).
Sockeye salmon had an optimal temperature of 15°C when acclimated to 15°C (Brett
1967). Sockeye salmon acclimated to temperatures of 5°C to 25°C and tested at their
acclimation temperature still had the fastest critical swim speed at 15°C, but the shape of
the TPCs changed. Fish acclimated to 5°C swam faster than fish acclimated to 15°C
when tested at 5°C. Fish acclimated to 25°C swam faster than fish acclimated to 15°C
when tested at 25°C. This relationship was not observed at intermediate acclimation and
critical swim speed for an organism, as well as the performance across a range of
temperatures.
1.7 Temperature Preference
Ectotherms rely on the environment to control their body temperatures, however, they are
also constrained to certain environments based on food availability, predation, mating
opportunities, or physical barriers. There are many hypotheses as to what determines an
organism’s preferred temperature, and I will briefly describe three of them: the
coadaptation, suboptimal is optimal, and trait variation hypothesis. The coadaptation
hypothesis states that an organism should prefer a body temperature that maximizes
Darwinian fitness by choosing a temperature close to the organism’s optimal temperature
(Angilletta et al. 2002). Haupt et al. (2017) found that Pringleophaga marioni caterpillars
preferred a temperature that aligned with survival and optimal feeding, but not
movement. A study conducted on roach (Rutilus rutilus) also found preferred temperature
to coincide with optimal temperature for feeding, growth, and energy conversion (Van
Dijk et al 2002). In a study on Australian skinks, preferred temperature only partially
matched optimal temperature for sprint speed (partial coadaptation for sprint speed)
(Huey and Bennett, 1987). The suboptimal is optimal hypothesis states that ectotherms
should prefer temperatures below their optimal temperature, as ectotherms are not good
regulators, and organisms must buffer against reaching the upper critical temperature
(Martin and Huey 2008). This work has support from multiple species of beetle and flies,
where the preferred temperature is lower than the optimal temperature for population
growth (Martin and Huey 2008). Another hypothesis is that organisms may prefer
depend on the trait that is most limited-this is called the trait variation hypothesis (Huey
and Stevenson, 1979). Killen (2014) found the common minnow (Phoxinus phoxinus)
supported this hypothesis, as feeding history altered the preferred temperature of these
fish based on what was most necessary. Fish that were food deprived preferred a lower
temperature than fish fed daily to satiation. This was hypothesized to divert energy away
from SMR to allow for compensatory growth, as metabolism lowers with lowered
temperature. All of these hypotheses examine how performance relates to temperature
preference, but when looking at multiple performance measures, they may not all align
with temperature preference.
Vertical or horizontal gradients have been used to measure temperature preference
in invertebrates (Neill et al. 1972). These gradients allowed the organisms to move
around and then settle at a temperature that would be deemed their preferred temperature.
However, the effectiveness of these methods for highly mobile fish has been questioned,
as it is uncommon for active fish to naturally stop moving in their habitats (McCauley,
1977). Neill et al. (1972) invented the first shuttlebox, which was an alternative way to
measure temperature preference in fish. This shuttlebox had two chambers with a tunnel
between them whose opening was lined with photocells. When the beam of photocells
was broken, the system would register the fish had moved sides. There is a 2°C
difference between the chambers, with one side being warmer than the other. When the
fish passed to the warmer side, the whole system would warm, at 3-5°C per hour, and
when the fish passed to the cooler side, the whole system would cool at that same rate.
then continue to use this same system for fish research (Schurmann and Steffenson 1992,
Konecki et al. 1995, Killen 2014, Nay et al. 2015).
Rearing environment can affect temperature preference in many different ways.
O’Steen (1998) found that snapping turtles (Chelydra serpentine) preferred temperatures
opposite to the temperature they were incubated at (warm incubated turtles preferred
cooler water temperatures, while cold incubated turtles preferred warmer water
temperatures). In another study, coral reef cardinalfish (Cheilodipterus quinquelineatus)
were acclimated to two different temperatures and there was no difference found in their
preferred temperature (Nay et al., 2015). However, both groups preferred a temperature
that matched their average summer temperature in the wild. Javaid and Anderson (1967)
examined juvenile Atlantic salmon and rainbow trout and found that their preferred
temperature was slightly higher than their acclimation temperature. Organisms can
respond to different rearing environments by sometimes altering their temperature
preference, but sometimes it has no effect at all.
Temperature preference may also vary across populations. Killifish from northern
populations had higher preferred temperatures than southern populations (Fangue et al.
2009). Conversely, in Drosophila immigrans lines there was no difference in temperature
preference across populations (Yamamoto 1994). While in some species, populations
differ in their temperature preference, in other species temperature preference does not
differ, so one cannot extrapolate the temperature preference of populations of a species
1.8
Atlantic salmon
Atlantic salmon are a top predator in the aquatic ecosystems in which they reside and
once supported a valuable fishery throughout their native range (Parrish et al., 1998).
Atlantic salmon spawn in streams, where the juveniles remain for their first one to seven
years before migrating out to deeper water (Keenleyside and Yamamoto 1962). Atlantic
salmon may be either potamodromous or anadromous (Dimond and Smitka 2005).
Potamodromous salmon stay in fresh water their entire lives, migrating from streams to
lakes, while anadromous salmon migrate out to the ocean. Before migrating, salmon
undergo the process of smoltification, where they change color and develop the ability to
osmoregulate (Keenleyside and Yamamoto 1962). Atlantic salmon will then swim
downstream out into the lake or ocean until they are ready to spawn. When they are ready
to spawn, salmon will swim upstream to return to their native stream to lay eggs. Atlantic
salmon are repeat spawners and display natal site fidelity (Jonsson et al 2001).
Stream life is an important part of the life cycle for an Atlantic salmon because
they are subject to high predation and variable water temperatures. Atlantic salmon are
territorial visual feeders (Arnold et al. 1991, Migaud et al. 2007). They hold onto rocks
using their pectoral fins and feed on drifting invertebrates. This exposes them to
predators, so their cryptic colouration and ability to hide allows them to survive (Arnold
et al. 1991, Walker et al. 2005). Predation is high during the in-stream part of Atlantic
salmon life, as most predators are gape-limited and salmon are small enough during this
life stage to be eaten (Armstrong et al. 2013). Water temperature can also play a role in
survival, as water temperatures too high or too low can affect embryonic development,
In Atlantic salmon, acclimation temperature can affect thermal tolerance and
aerobic thermal performance. The thermal tolerance range (range of temperatures an
organism can survive at) is 0-33°C (Elliott 1991). Atlantic salmon cope with near
freezing water temperatures in the winter, especially in the egg stage. However, many
Atlantic salmon will not survive at water temperatures of 33°C unless they have been
acclimated to warmer temperatures over time, or are only exposed for a very short period
of time. The upper incipient lethal temperature (the temperature an organism can be at for
a considerable length of time, in this study 7 days was used) of Atlantic salmon was
found to be 27.8°C when acclimated to a temperature of 27°C (Elliott 1991). Fish
acclimated to 5°C had an upper incipient lethal temperature only 4°C cooler, showing
that there is plasticity in thermal tolerance, but there is a limit to upper temperatures that
these fish can tolerate. Fish acclimated to 20°C fed normally between 7-22.5°C, but fish
acclimated to higher temperatures of 25°C and 27°C did not feed at all. While fish may
be able to survive at high temperatures (upwards of 25°C), if they cannot feed at these
temperatures, then they will not survive for long in the wild. It is important that salmon
maintain their ability to swim, so that they escape areas when temperatures are
unfavourable. Temperature has a large pronounced effect on survival and aerobic
capacity in Atlantic salmon.
Aerobic performance of Atlantic salmon is also constrained by temperature.
Anttila et al. (2014) used heart rate as a proxy for aerobic performance to determine
optimal temperature and upper critical temperature of Atlantic salmon. They found
plasticity in both proxies for optimal temperature and upper critical temperature when
27.5°C, which is similar to the upper incipient lethal temperature found by Elliot (1991),
whereas the optimal temperature was between 16-19°C. Gradil et al. (2016) examined
three populations of Atlantic salmon (including the LaHave and Sebago populations) and
found that populations differed in a rank order of aerobic optimal temperatures that
corresponded with average summer water temperatures. Upper critical temperatures
ranged from 23.5-26.4°C, and the optimal temperatures ranged from 14.7-17.0°C. This
study was the first to show local adaptation to temperature in Atlantic salmon. Therefore,
the aerobic performance of Atlantic salmon is both constrained by temperature and can
change across rearing environments or populations.
Temperature preference of Atlantic salmon has also been previously studied, and
varies across populations. Javaid & Anderson (1967) found that acclimation temperature
could affect preferred temperature of juvenile Atlantic salmon from the Miramichi
population. Preferred temperatures aligned with acclimation temperatures. In another
study, the preferred temperature of potadromous New Brunswick Atlantic salmon fry was
13.6°C and anadromous salmon was 13.8°C (Peterson et al. 1979). Both of these groups
were acclimated to temperatures of ~12°C. Two populations of landlocked Atlantic
salmon from Newfoundland moved out of areas where water temperature exceeded 14°C,
suggesting their preferred temperature is below this value (Leggett and Power 1969). The
preferred temperature of Atlantic salmon differs based on rearing conditions and across
populations.
In Canada, Atlantic salmon are listed under the Species at Risk Act ranging from
salmon were extirpated by 1896 (Parsons, 1973). Despite over 100 years of stocking
effort into the Lake Ontario, no self-sustaining populations have been established. A
current goal of the Ontario Ministry of Natural Resources and Forestry (OMNRF) is to
establish self-sustaining populations, and thus, more research must be done to discover
and mitigate the causes of the low success rate of the stocked populations (OMNRF
2015).
1.9
Experimental design
I examined burst speed and critical swim speed of juvenile Atlantic salmon reared at two
temperatures across a range of water temperatures. I then use these data to examine the
characteristics of the resulting TPCs. I measure these traits in two populations that are
currently being used for stocking efforts in Lake Ontario. I also look at temperature
preference of these two populations reared at two temperatures.
The first objective of this project was to determine how burst speed and critical
swim speed would be affected by water temperature. For burst speed, I hypothesized that
performance would be maintained across water temperatures because it is necessary for
survival of juvenile salmon to avoid predators and capture prey. I predicted that burst
speed will be unaffected by water temperatures, so it will not follow the classic bell shape
of TPCs. For critical swim speed, I hypothesized performance would be maximized at an
intermediate temperature, as aerobic scope and cardiac performance have been found to
decline at higher temperatures as described by the OCLTT (Brett 1964, Anttila et al.
2013, Muñoz 2014). I predicted that Atlantic salmon performance will follow the
My second objective was to examine if Atlantic salmon display developmental
plasticity in burst speed, critical swim speed and temperature preference. I examined
burst speed and critical swim speed of fish reared at two temperatures to determine if
either trait showed plasticity. Plasticity could be shown in a difference in overall speeds
of swimming between the two groups or through a shift in Topt of the TPCs. For
temperature preference, I hypothesized that Atlantic salmon would prefer temperatures
that aligned with their rearing temperature, as was observed by Javaid & Anderson
(1967) in the Miramichi Atlantic salmon population. I predicted that fish reared at cooler
temperatures would prefer cooler temperatures, and the fish reared at warmer
temperatures would prefer warmer temperatures. I did not have a prediction as to how the
two populations would differ in performance, but I wanted to test if the results were
consistent across two independent populations.
My third objective was to determine how optimal temperatures of burst speed and
critical swim speed would relate to temperature preference. I wanted to determine if
temperature preference would align with the coadaptation hypothesis, suboptimal is
optimal hypothesis, trait variation hypothesis or support none of these hypotheses for
burst speed and critical swim speed.
Methods
2.1 Experimental fish
Atlantic salmon from the Sebago Lake and LaHave River populations were examined in
this study as they are two populations currently being stocked into Lake Ontario. The
Smitka 2005). The LaHave population is from Nova Scotia (44.4°N, 64.5°W) and is
anadromous (Dimond & Smitka 2005). These two populations have similiar water
temperature regimes, with means at ~20°C and peaks at ~26°C throughout the summer
(June-October) (Gradil, 2016). All fish were sourced from broodstock housed at the
OMNRF Normandale Fish Culture Station (Vittoria, ON). The Sebago population has
been held in Ontario Ministry of Natural Resources and Forestry (OMNRF) hatcheries
for 3 generations, and the LaHave population for 6 generations (OMNRF, unpubl. data).
All experimental fish were produced at Normandale Fish Culture Station from
November 2, 2016 to November 17, 2016. For each population, approximately 500-1000
eggs were collected from each of 30 four-year-old females and milt was collected from
30 males (three or four years old). Gametes were combined using a 1 male × 1 female
breeding design (30 families for each population). Eggs were disinfected using two-step
disinfection before and after water hardening using Ovadine (Syndel, Nanaimo, BC)
(Torgersen & Håstein 1995).
Eggs from each population were placed in individual Heath trays separated by
family and exposed to running water from a nearby creek with a temperature of
approximately 8°C. The dead eggs were removed twice a week to prevent the spread of
Saprolegnia spp. After hatch, before yolk sacs were completely absorbed, fish were
transferred to Codrington Fisheries Research Facility (Codrington, ON) where they were
held at approximately 12°C. Once fish transitioned to exogenous feeding, they were fed
ad libitum with organic fish pellets (EWOS Commercial Feeds, Bergen, Norway).
University to begin temperature treatments. Previous work by Anttila et al. (2014)
showed ~6°C difference in cardiac collapse of Atlantic salmon reared at temperatures that
differed by 8°C, so an 8°C difference that falls within the natural temperature range
experienced by Atlantic salmon was chosen for this study. Specifically, 50 fish from each
population were assigned to 68-L population-specific tanks at 11°C and 19°C, and were
held at these temperatures for at least 5 months before beginning experiments. These
tanks were supplied by tap water that had been run through carbon filters and nitrate
removing bacteria. Daily 10% water changes were conducted for this recirculating
system. This water was used for all other trials. Fish were set to a 12-hour day and night
light cycle.
2.2 Burst speed
Burst speed trials were conducted in five tanks, each measuring 61 × 40 × 42 cm, with a
water depth of ~4 cm. All tanks were part of a single recirculating system, with a VWR
chiller (VWR, Illinois, U.S.A.) used to control water temperatures. Water was brought in
from the hatchery. A 25% water change was conducted daily, and all tanks were cleaned
before new fish were transferred into the burst speed tanks for the next block of trials.
Burst speed trials were conducted in blocks of five fish, with one fish per tank.
Each block included one fish from each population at each rearing temperature, and one
additional fish from a random treatment. To begin the block of trials, all burst speed tanks
were lowered from room temperature (~17°C) to ~11°C. Fish from the 11°C rearing
treatment were then transferred from the hatchery to the procedure room and placed into
returned to 17°C. Fish from the 19°C rearing treatment were then placed individually into
tanks. Fish were not fed on transfer days and were given 24 hours to recover in their burst
speed tanks before beginning trials. Fish were fed on trial days after a minimum of three
hours had elapsed since the end of trials.
Trials were conducted between 9:00-14:00 EST from September 22 2017 to
March 3, 2018. To begin a trial, the water temperature was changed by 1°C every 15
minutes until the desired water temperature was reached. Trials were conducted at
temperatures between 11°C and 25°C at 2°C increments. The order of water temperatures
was randomized for each block (Appendix A). The water temperature in each tank was
measured by an HH508 thermocouple (Omega, U.S.A.), and once all the water
temperatures were within 1°C of the water temperature, trials would begin. During each
burst speed trial the tanks were recorded from above using a camcorder that was placed
on a shelf above each tank that had a hole for the lens to fit through (DCR-TRV150
HandyCam, SONY, New Jersey, U.S.A.). A motivator constructed from a 9V transistor
was used to prod the tail of each fish and deliver a mild electric stimulus (Taylor &
McPhail 1985). Fish were prodded up to five times to incite a burst, and if no burst was
observed, the trial was deemed unsuccessful and excluded from further analysis. Each
fish was motivated to perform a burst a total of three times at each water temperature,
with a minimum of two minutes between bursts. After daily trials were completed, water
temperature was returned to 17°C (room temperature) by changing 1°C every 15 minutes.
In total, burst speed trials were conducted for 35 fish from the 11°C rearing treatment and
38 fish from the 19°C rearing treatment (Table 1).
and anesthetized using 1:1 ratio of MS-222 buffered with sodium bicarbonate. I then
weighed and measured total length (snout to tip of caudal fin) of all fish. Sebago fish
were tagged using visible implant elastomer tags (VIE; Northwest Marine Technologies,
Shaw Island, WA) on either side of their dorsal fin for future identification during critical
swim speed trials. Different colors and numbers of marks were used to create unique
identification for each fish.
The start of a burst was identified by the presence of a C-start (Johnson &
Bennett, 1995). Bursts where fish continually swam in a circle were excluded, as the
maximum speed of the fish would not be accurately represented when turning. For
frames 3-8, fish position was determined as the x and y coordinates of the snout of the
fish using ImageJ version 1.51 (Schneider et al. 2012). Velocity in cm/s was calculated
using Pythagorean theorem based on the position of the fish and time elapsed.
Due to a lack of consensus in the literature about how to calculate burst speed, I
calculated burst speed using four different methods. For all methods I omitted the first
frame as it was the starting position of the fish and no velocity could be calculated and
the second frame because it often included the C-start movement, where the head of the
fish would move, but the fish did not advance forward. The first method was to calculate
burst speed as the maximum velocity observed during the first five frames. The second
method was to calculate burst speed as the mean velocity of the first five frames. The
third method was to calculate burst speed as the maximum velocity observed during the
burst where the fish moved in a straight line. The fourth method was to calculate burst
speed as the mean velocity across all frames during the burst where the fish moved in a
temperature and those values were then averaged prior to statistical analysis. These
different analyses were used to examine differences between maximum and average
speed, and determine how the start and end of a burst would affect burst speed.
2.3 Critical swim speed
Aerobic swim performance was assessed for only the Sebago population (due to time
constraints) using a Loligo swim flume (Loligo Systems, Denmark,
https://www.loligosystems.com). A motor connected to a spinning impeller generates a
water current in a circular fashion around the flume (Appendix B). Water was brought in
daily from the hatchery to fill the swim flume and holding tanks. The water passes
through a diffuser to ensure laminar flow into the chamber where the fish is held. The
swim chamber measured 40 × 10 × 10 cm. A mild electric stimulus could be applied to a
metal grid at the back on the swim chamber to motivate fish when necessary. The swim
flume was connected to a VWR chiller and a 68-L holding tank (with an aerator) half
filled with water. Groups of fish were acclimated together and run through the same order
of water temperatures (Appendix C). There was an overall sample size of 16 - ten fish
from burst speed trials and an additional six fish. The order of metrics is described in the
appendix (Appendix D).
There is a linear relationship between frequency (Hz) of the swim flume motor
and velocity (m/s). Calibration curves were created using a flow meter (Höntzsch,
Waiblingen, Germany) before each group was started, and these curves were used to
calculate critical swim speed. Test fish were anesthetized using MS-222 (as described in
individuals. Fish were moved to the burst speed tanks (one fish per tank) as housing
during swim flume trials. Fish from the burst speed tanks were netted daily and
transferred to the room where the swim flume was set up. I then transferred fish into
individual holding containers within the 17°C housing tank. Water temperature was
achieved by changing the water temperature at a rate of 1°C every 15 minutes. Swim
trials were performed at the same temperatures as burst speed (11°C and 25°C at 2°C
increments) in a semi-randomized order. Four fish from the first group (all reared at
11°C) died after being exposed to 25°C test temperatures in the swim flume. Thus, for
future groups of fish, 23°C was the highest water temperature used for fish reared at
11°C. The fish reared at 19°C were tested at 23°C and 25°C for the last two days of trials
within a group. All other water temperatures were randomized.
Once the swim flume water reached the water temperature for that day, fish were
netted and transferred to the swim flume chamber and allowed to swim at 0.12 m/s for
three minutes to acclimatize to the system. At 2-minute intervals the water velocity was
increased by 0.06 m/s. When a fish stopped swimming and was forced against the back of
the chamber, it received a mild electric stimulus for 1 s. If a fish was stimulated twice in a
row without moving (3 s between stimuli), then the fish was deemed exhausted and the
trial was concluded for that day. The flow was then set to 0.12 m/s and the fish was
allowed to recover for 3 min before returning it to the holding tank. After all fish
completed their swim trials, the holding tank temperature was brought back to 17°C at
1°C per 15 minutes. Fish were then returned to their individual housing tanks. Fish were
fed only after a minimum of 2 hours had passed since they were returned to their
Critical swimming speed (Ucrit) was calculated using the equation described by
Brett (1964): Ucrit=Ui + (Ti / Tii * Uii), where Ui is the highest velocity maintained for
a full 2 min interval, Ti is the time of fatigue at last current velocity (min), Tii is the
interval length (2 min), and Uii is the velocity increment (~0.06 m/s).
2.4 Temperature Preference
A shuttlebox was used to measured temperature preference (Neill et al. 1972). The
shuttlebox was comprised of two white plastic chambers that were connected with an
opening so a fish could swim between the chambers (Appendix E). The chambers were
cylindrical with a diameter of 17 cm and 23 cm tall, with a water depth of approximately
4 cm. There was a 3°C difference between the two chambers: 9.5°C and 12.5°C for fish
reared at 11°C; and 17.5°C and 20.5°C for fish reared at 19°C. After the habituation
period, the system would ramp water temperature up or down at 0.3°C per minute. Using
detection software and a camera, the position of the fish was recorded. At 1s intervals the
temperatures of both chambers and the position of the fish were recorded. When the fish
was in the cooler chamber, the entire system would cool maintaining the 3°C difference
between chambers. When the fish was in the warmer chamber, the entire system would
warm, again maintaining the 3°C difference between chambers.
After burst speed trials, one fish was placed into the shuttlebox, and the two chambers
were kept at a constant temperature for one hour to allow for habituation. After one hour,
the temperature in the two chambers would begin to change based on the position of the
fish. Trials lasted 8 hrs. I calculated the average temperature that the fish experienced as
interval during the last 6.5 hr interval. I omitted half an hour after acclimation because
fish from each rearing temperature (11°C or 19°C) started at different temperatures. I also
calculated number of shuttles between the chambers for each fish. In total, I ran 46 fish
through temperature preference trials- 8 LaHave from the 11°C rearing treatment, 11
LaHave fish from the 19°C rearing treatment, 15 Sebago from the 11°C rearing
treatment, and 12 Sebago from the 19°C rearing treatment (Table 1).
2.5 Statistical analysis
All analyses were performed in JMP 13.0.0 (SAS Institute, 2016). I used a two-way
ANOVA to compare the lengths of fish between rearing temperatures and population that
completed trials for each metric. To examine how my four analyses of burst speed
compared, I ran pairwise Pearson’s correlations for each of the 4 burst speed calculations.
To examine if water temperature, rearing temperature and population had an effect on
burst speed, I performed a linear mixed effects model with population, rearing
temperature, population × rearing temperature, water temperature, length, and fishID
(random effect) as factors. Inter-invidual variation was calculated by dividing the amount
of variation explained by fishID by the total variation in the model. I then tested critical
swim speed for a linear and quadratic effect of water temperature between the two rearing
treatments. I also examined how rearing temperature affected critical swim speed. I
performed a linear mixed effects model with rearing temperature, water temperature,
water temperature2, rearing temperature × water temperature, rearing temperature × water
temperature2, length and fishID (random effect) as factors. To examine how rearing
temperature and population affected temperature preference, I performed a linear model
number of shuttles as factors.
Results
3.1 Study fish
I compared the mean body size of fish from each treatment that performed each swim
performance metric (Table 1). For burst speed, fish from the LaHave population were
significantly longer than fish from the Sebago population (F3,69 = 6.97, P = 0.01). Fish
reared at 19°C were significantly longer than fish reared at 11°C (F3,69 = 48.13, P <
0.001). The interaction between rearing temperature and population was not significant
(F3,69 = 2.20, P = 0.14). For critical swim speed, fish reared at 19°C were significantly
longer than fish reared at 11°C (F1,14 = 5.35, P = 0.037). Fish reared at 19°C were longer
than fish reared at 11°C for temperature preference trials (F3,42 = 18.58, P < 0.001), but
there were no significant differences between the Sebago and LaHave population in
length (F3,42 = 3.85, P = 0.056). The interaction between rearing temperature and
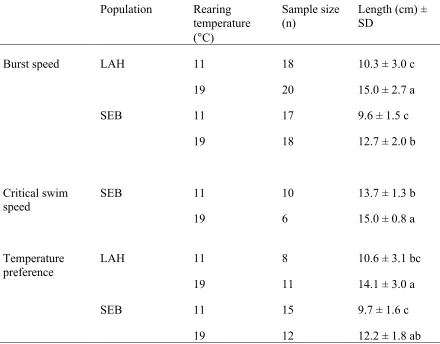
Table 1: Mean total lengths (± SD) and sample size (n) of juvenile Atlantic salmon (Salmo salar) from two populations (LaHave (LAH) and Sebago (SEB)) for three metrics. Means within a metric with the same letters are not significantly different (P < 0.05) according to Tukey’s test.
Population Rearing temperature (°C)
Sample size (n)
Length (cm) ± SD
Burst speed LAH 11 18 10.3 ± 3.0 c
19 20 15.0 ± 2.7 a
SEB 11 17 9.6 ± 1.5 c
19 18 12.7 ± 2.0 b
Critical swim speed
SEB 11
19
10
6
13.7 ± 1.3 b
15.0 ± 0.8 a
Temperature preference
LAH 11
19
8
11
10.6 ± 3.1 bc
14.1 ± 3.0 a
SEB 11 15 9.7 ± 1.6 c
3.2
Burst speed
The four methods I used to calculate burst speed resulted in values that were highly
correlated (pairwise correlation coefficients r= 0.66 to 0.93). Consequently, I chose to
focus on a single measure for all subsequent analyses (the maximum speed observed
during the first five frames), which was the fastest speed that the fish swam during the
initial phase of its burst.
Burst speed was significantly affected by length of the fish; as length of fish increased,
burst speed increased (F1, 68.51 = 48.12, P < 0.001). Inter-individual variation accounted
for 13% of the variance in the data. I found that there was no effect of water temperature
on burst speed (F1, 498.64 = 0.35, P = 0.55) (Fig. 2). Rearing temperature did not affect
burst speed (F1, 68.52 = 0.03, P = 0.86). Fish from the Sebago population were significantly
faster than the LaHave population, having burst speeds that were on average 9% faster
based on the model after controlling for body size (F1, 68.73 = 4.92, P = 0.03). There was
no significant interaction between rearing temperature and population (F1, 68.53 = 1.03, P =
Figure 2: Burst speed (cm/s) as a function of water temperature for juvenile Atlantic salmon (Salmo salar) reared at (A) 11°C or (B) 19°C. Lines represent a linear regression plotted through all points in each panel that are both non-significant.
3.3 Critical swim speed
Body length did not significantly affect critical swim speed (F1, 14.61 = 1.84, P = 0.20).
Inter-individual variation accounted for 39% of the variance in the critical swim speed
data. Fish from the two rearing treatments responded differently to water temperatures, as
they differed in the slope of their linear term (F1, 87.57 = 5.44, P = 0.022), and quadratic
term (F1, 87.65 = 5.46, P = 0.022). Critical swim speed was positively associated with water
temperatures for fish from both rearing treatments, but the critical swim speed of fish
reared at 19°C increased exponentially with water temperatures, while the critical swim
speed of fish reared at 11°C plateaued from 19°C onwards (Fig. 3). On average, fish
reared at 11°C were significantly faster than fish reared at 19°C (F1, 13.12 = 5.74, P =
Figure 3: Critical swim speed (cm/s) as a function of water temperature for juvenile Atlantic salmon (Salmo salar) from the Sebago population. Lines represent quadratic regressions plotted through the points for each rearing temperature. The equation of the line for the fish reared at 11°C is y = -0.061x2 + 2.73x + 17.83. The equation of the line for the fish reared at 19°C is y = 0.104x2 - 2.94x + 59.05.
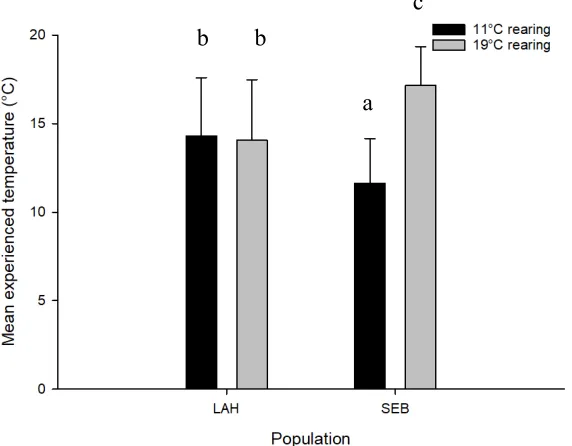
3.4 Temperature preference
An example of the raw data can be found in Appendix F. Length and number of shuttles
did not affect mean experienced temperature (F1,40 = 1.17, P = 0.29; F1,40 = 1.43, P =
0.24). Fish reared at 19°C had a higher mean experienced temperature than fish reared at
11°C (F1,40 = 9.97, P = 0.003, Fig. 4). The Sebago population and LaHave population did
not differ in their mean experienced temperature (F1,40 = 0.0028, P = 0.96). However,
there was a significant interaction between population and rearing temperature with
respect to mean experienced temperature (F1,40 = 8.72, P = 0.005). The Sebago fish reared
at 19°C had significantly higher mean experienced temperatures than the Sebago fish
reared at 11°C (17°C vs. 12°C), while the mean experienced temperature of the LaHave
Figure 4: Comparison of mean experienced temperature (°C) of juvenile Atlantic salmon (Salmo salar) that conducted shuttlebox temperature preference trials. Means followed by the same letter are not significantly different (P < 0.05) according to Tukey’s test.
b b
Discussion
Understanding the effects of temperature on locomotion is important as fish face
increasingly changing thermal environments. The ability to swim is essential for
capturing prey, avoiding predators, and seeking out suitable microhabitats. While many
studies have examined temperature and locomotion in fish, few studies have examined
the swimming across a wide range of ecologically relevant temperatures, or the degree to
which swimming can display plasticity. In my thesis, I used two populations of Atlantic
salmon that are currently being stocked into Lake Ontario to explore these relationships
of temperature with burst speed and critical swim speed. I hypothesized that burst speed
would be maintained across water temperatures, and that critical swim speed would peak
at intermediate temperatures. I examined plasticity in swim performance by looking
across two rearing temperatures, and considered two populations that have different life
histories. Lastly, I looked at temperature preference to see if optimal temperature of burst
speed or critical swim speed followed the coadaptation hypothesis, suboptimal is optimal
hypothesis or trait variation hypothesis.
4.1. Burst speed is independent of water temperature
In juvenile Atlantic salmon, I found no effect of water temperature on burst speed. Burst
speed did not increase at warmer temperatures, and there was no indication that burst
speed was higher at intermediate temperatures. In my results, I presented absolute burst
speed (cm/s), but when looking at relative burst speed (BL/s), there is also no change in
burst speed across water temperatures (Appendix G). My study thus provides no evidence