Compressive Sensing SFGPR Imaging Algorithm Based on Subspace
Projection Ground Clutter Suppression
Yanpeng Sun1, 2, *, Xiaodan Lu2, and Shi Zhang1
Abstract—Stepped frequency ground penetrating radar (SFGPR) has received increasing attention in the field of ground penetrating radar technology due to its superiority in the detection performance. Compressed sensing (CS) SFGPR imaging reconstruction method can not merely reduce the measured imaging data volume, but also reconstruct target image with less sidelobe. However, the imaging algorithm using CS approach will lose efficacy in strong clutter environment. To solve this problem, a CS SFGPR imaging reconstruction method combined with subspace projection clutter suppression approach is proposed in this paper. First, all frequency domain data at each measurement position are reconstructed from reduced frequency measurements via sparse reconstruction technique. Then subspace projection ground clutter suppression technique is used to suppress the strong ground clutter. Finally, the orthogonal matching pursuit (OMP) algorithm is utilized to reconstruct the underground target image. Synthetic and experimental data processing results have verified the effectiveness and accuracy of the proposed imaging method.
1. INTRODUCTION
Stepped frequency ground penetrating radar (SFGPR) system has received increasing attention in the GPR community in recent years due to its advantages of higher dynamic range and stronger immunity to radio interference [1–3]. However, with the further motivation of various application requirements, GPR system is constantly developing towards the direction of channel, polarization, multi-band and high-resolution [4, 5], which makes SFGPR system suffer from problems of huge data samples, long data collection time, etc. Therefore, how to shorten the data acquisition time of SFGPR system and improve imaging speed become an urgent problem to be solved. In recent years, Donoho and Cand`es et al. have developed an information theory, known as compressed sensing (CS) theory [6, 7], which is gaining increasing interest in the field of radar imaging [8]. Under the framework of CS theory, signal sampling can greatly break through the limitation of Nyquist sampling theorem, which can bring a great convenience for the signal acquisition, storage, transmission and processing. Therefore, CS theory provides an opportunity to solve the technical problems faced by SFGPR.
With the further development of CS theory, considerable work has been done to apply CS to SFGPR system establishment and image reconstruction in order to reduce the data acquisition time and improve the image quality [9–16]. In practical SFGPR measurement situation, since the distance between antennas and ground is very short, the wave reflected from the ground is much stronger than that from underground targets. This will result in the degradation of the reconstructed image quality for CS based SFGPR imaging algorithm [11–13]. Therefore, before the application of CS imaging procedure, the appropriate clutter suppression method should be utilized to mitigate the strong ground reflected clutter.
Received 15 January 2016, Accepted 19 March 2016, Scheduled 30 March 2016 * Corresponding author: Yanpeng Sun ([email protected]).
1 College of Computer Science and Engineering, Northeastern University, Shenyang 110819, China. 2College of Electronic Information
Previously, a wide variety of clutter suppression algorithms have been extensively reported in the literature, such as background subtraction method, scaled and shifted method, subspace projection and digital filtering method [17–22]. In these methods, the dominant surface reflection can be mitigated by using the uniformly sampled data. However, in CS imaging process, the sampled data are significantly reduced in both spatial domain and frequency domain. So it is not easy to directly apply the traditional clutter suppression approach to random compressive SFGPR measurement data.
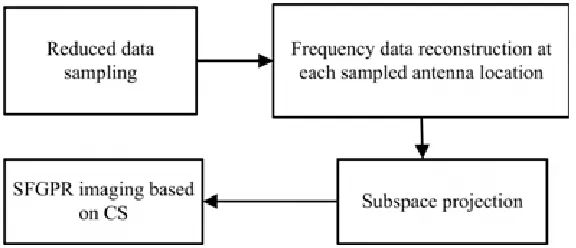
In order to alleviate the above problem, a CS SFGPR imaging reconstruction method combined with subspace projection clutter suppression approach is proposed in this paper. First, all frequency domain data at each measurement position are reconstructed by utilizing the sparse property of the received signal. Then subspace projection clutter suppression technique is used to suppress the relatively strong ground clutter. Finally, the underground target image is obtained with less sidelobe by using the conventional CS imaging algorithm. The whole processing steps are shown in Figure 1.
Figure 1. Flowchart of the proposed imaging method.
2. COMPRESSIVE SENSING
CS theory is a new signal sampling theorem, through which the original signal can be accurately recovered from a number of data samples by nonlinear reconstruction algorithm. The data used in CS method is far less than that of the Nyquist theorem. We assume that one-dimensional signal x∈CN can be expressed by an overcomplete dictionary matrix Ψ= [ψ1 ψ2 . . . ψN] as follows
x=Ψα= N
n=1
ψnαn (1)
whereΨis anN×N overcomplete dictionary matrix. α= [α1 α2 . . . αN]T is anN×1 column vector. When α is sparse and only hasK(K N) nonzero components,x is said to be sparse onΨ.
According to CS theory, aQ×N projection matrixΦis used to randomly select a few compressive samples from x, and the compressive samples can be written as
y=Φx=ΦΨα (2)
Sinceα is a K-sparse vector, we can get α by solving the following optimization problem as
minαl0 subject to y=ΦΨα (3)
As Eq. (3) is an NP-hard problem, Donoho and Cand`es et al. have pointed out that the problem can be cast intol1 norm regularization problem as follows [6, 7]
minαl1 subject to y=ΦΨα (4)
3. CS SFGPR IMAGING
We assume that the SFGPR system works in N frequencies ranging from f1 to fN with a constant frequency step Δf. Then the n-th working frequency is
fn=f1+ (n−1) Δf n= 1,2,· · · , N (5)
In SFGPR system, the received signal at each antenna location is the superposition of waves reflected by subsurface targets and the ground. Assume that P is the number of subsurface targets. Then the signal received at them-th antenna location can be expressed as
ym = ρgexp (−j2πfτg) + P
p=1
ρpexp (−j2πfτm,p) (6)
ym = [ym,1 ym,2 . . . ym,N]T (7)
f = [f1 f2 . . . fN]T (8)
where ym,n denotes the m-th antenna’s received signal at the n-th working frequency, ρg the complex reflection coefficient of the ground,ρp the complex reflection coefficient of thep-th subsurface target,τg the two-way signal time delay between them-th antenna location and the ground, andτm,p the two-way signal traveling time from them-th antenna to the p-th subsurface target.
In order to get the two-dimensional image of the investigated area, the imaging area is divided into L(P L) uniform grids along the horizontal direction and depth direction. Assume that
sl(l= 1,2, . . . , L) denote the reflectivity distribution function of the discretized grids,sl can be defined as
sl=
ρp the amplitude for thel-th time delay grid
0 no target for thel-th time delay grid (9)
Elements sl can be stacked to a column vector S. Then the measured data at the m-th antenna location can be expressed in matrix multiplication form as
ym=ΨmS (10)
whereΨm is an N×Ldictionary matrix, and it can be expressed as
Ψm = [e−j2πfτm,1 · · · e−j2πfτm,l · · · e−j2πfτm,L] (11)
whereτm,lis the two-way signal propagation time delay from them-th antenna location to thel-th grid. Considering that there are totalM antenna locations, we can combine the full set of data measured at M antenna locations usingN frequencies and define the total measurement vector as
Y =ΨS (12)
whereΨ= [ΨT1 ΨT2 · · · ΨTM]T and Y= [yT1 y2T · · · yTM]T.
In practice, the number of targets is usually much less than the number of discretized grids, and the vector S is a sparse vector. According to CS theory, we can recover S from a reduced set of
Q1Q2(Q1Q2 L) measurements. Mathematically, the compressive measurements can be implemented
by multiplying the total measurement vector Y by a Q1Q2 ×M N projection matrix Φ. Thus the
reduced measured data can be expressed as
˜
Y=ΦY=ΦΨS=ΘS (13)
where Θ = ΦΨ. Considering that the reduced measurements can be implemented by the spatial-frequency undersampling pattern, the projection matrixΦcan be written as
Φ= (Φs⊗ IQ1)·diag
Φ(0)f · · ·Φ(fm)· · ·Φ(fM−1)
(14)
where ⊗denotes Kronecker product; IQ1 is aQ1×Q1 identity matrix; Φs is aQ2×M matrix, which
is constructed from randomly selecting Q2 rows from an M ×M identity matrix; Φf(m) is a Q1×N
Φs determines the reduced antenna locations, whereasΦ(fm) determines the reduced frequencies at the
m-th antenna location.
It is known that ifΘsatisfies the restricted isometry property, the sparsity vectorScan be recovered by solving the following problem
minSl
1 subject to Y˜ =ΘS (15)
A type of greedy algorithm called orthogonal matching pursuit (OMP) [23, 24] is used to solve the problem to provide the fast and accurate result.
4. PROPOSED IMAGING METHOD
In CS based imaging algorithm, the frequency data samples are selected differently from one antenna location to another. In this case, the traditional clutter suppression methods will lose efficacy. In this section, we give a detailed description of the proposed imaging method. The proposed imaging method is composed of three steps: At first, all SFGPR frequency domain data at each sampled antenna position are recovered from randomly reduced frequency measurements by using the sparse reconstruction technique. Then the subspace projection technique is utilized to suppress strong ground-reflected wave. At last, the CS imaging method described in Section 3 is used to reconstruct the image of the investigation area.
4.1. Data Reconstruction at Each Antenna Location
At each measurement location, we can divide the detected time window into J uniform discrete grids and obtain a J ×1 time delay vector τ = [τ1 τ2 . . . τJ]T. Then at the m-th antenna location, the reduced frequency measurements can be expressed as
˜
ym =Φ(fm)AKm (16)
where A is the N ×J dictionary matrix andKm the J ×1 amplitude vector. The j-th column of A can be written as
[A]j = exp (−j2πfτj) (17)
Because the number of target echoes is much less than the number of divided time delay grids,Km is a sparse vector. According to CS theory, the recovery of Km can be done by solving the following equation
minKml1 subject to ˜ym =Φ(fm)AKm (18)
Once the amplitude vector Km is obtained, we can recover the full set of frequency data for the
m-th antenna location by the following expression
ym=AKm (19)
4.2. Subspace Projection Clutter Suppression
After the process described in Section 4.1 scan by scan, we can reconstruct the full set of uniform frequency data at all sampled antenna locations. Then subspace projection clutter suppression method can be used to mitigate the strong ground-reflected wave. The reconstructed signals at Q2 antenna
locations withN frequencies can be arranged into an N×Q2 matrixT.
Subspace projection method decomposes the received signal matrix by singular value decomposition (SVD). Because the ground reflection and targets reflections are distributed into different subspaces, the signal reflected by subsurface targets can be obtained by wiping off the subspace where the ground reflection lies in. The SVD ofT is given by
where U is anN ×N unitary matrix, and V is aQ2×Q2 unitary matrix. SuperscriptH denotes the
Hermitian transpose. Λis anN ×Q2 diagonal matrix and can be expressed as
Λ=
Σ 0 0 0
(21)
whereΣ= diag(λ1, λ2, . . . , λQ2). λi are the singular values andλ1 ≥λ2 ≥. . .≥λQ2.
As the received wave reflected by ground is much stronger than that reflected by subsurface targets, the ground subspace can be constructed by the firstK dominant singular vectors
Tground = K
i=1
uivHi (22)
Then, the subspace where the targets reflection waves lie in can be constructed by
Starget =I−TgroundTHground (23)
whereI is an identity matrix. The signal reflected by subsurface targets can be acquired by projecting the received signalY on targets subspace
Ytarget=StargetY (24)
After the strong ground reflection being suppressed from the received signal, the CS imaging method depicted in Section 3 can be utilized to reconstruct the image of investigation domain.
5. DATA PROCESSING AND RESULT ANALYSIS
The experiment is carried out in order to evaluate the performance of the proposed imaging method. First, the method is tested with the synthetic SFGPR data in Section 5.1. Then the experiment is conducted with real SFGPR data in Section 5.2.
5.1. Synthetic SFGPR Data
In the SFGPR data experiment, the data acquisition system is established by the MATLAB platform. The SFGPR system operating frequency ranges from 1 GHz to 4 GHz with a frequency step of 30 MHz, resulting inN= 101 frequency measurements at each antenna location. A total of 30 antenna locations with 0.01 m displacement are used for system data collection. The antenna phase center is at a standoff distance 0.01 m from the ground. Therefore, the full measurements volume of the SFGPR system comprises M ×N = 30×101 = 3030 data samples. In the experiment, we consider that there are two targets buried underground at positions p1 = (0.1 m, 0.4 m) andp2 = (0.3 m, 0.4 m). The complex
reflection coefficients of the two targets ρ1=ρ2 = 0.1, and the ground complex reflection coefficient ρg is 1. The investigated area is chosen from 0 cm to 40 cm in the horizontal direction and 30 cm to 50 cm in the depth direction. In order to get the two-dimensional image, the whole area is divided into 41×21 uniform pixels.
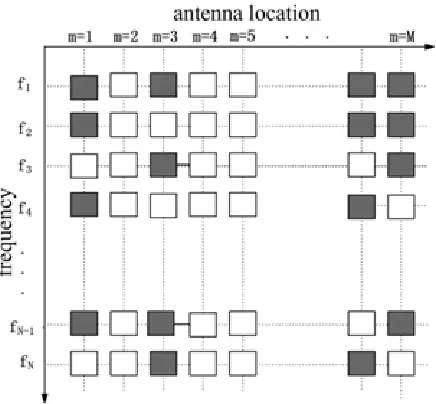
For the proposed imaging method, instead of measuring all the frequency domain data at all antenna locations, we use only a reduced subset of data obtained by measuring a different set of reduced frequencies at a reduced set of antenna location. The corresponding space-frequency sampling pattern is shown in Figure 2, where the horizontal direction denotes the antenna location, and the perpendicular direction represents the system operation frequency. Black blob represents that the datum at the relevant position is sampled, while the white blob stands for the opposite meaning. In this experiment, 15 (50% of 30) antenna locations are randomly chosen from all the antenna locations, and then 20 frequency (about 19.8% of all frequency bins) measurements are differently selected at each chosen antenna location. The reduced data for CS SFGPR imaging account for about 10% of the total data volume.
Figure 2. Data sampling pattern in the spatial-frequency domain.
antenna location
ti
m
e
10 20 30
200
400
600
800
1000
1200
1400
1600
1800
2000
0.005 0.01 0.015 0.02 0.025 0.03 0.035 0.04 0.045
antenna location
ti
m
e
10 20 30
200
400
600
800
1000
1200
1400
1600
1800
2000
0 1 2 3 4 5 6 7
x 10-3
(a) (b)
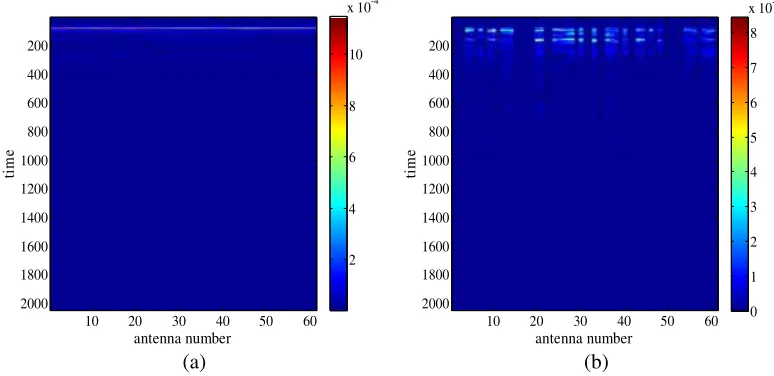
Figure 3. Space-time responses: (a) space-time responses of the full frequency measurement data at all antenna locations; (b) space-time responses of reduced data being processed by the subspace projection method.
the received signal at each antenna location, as shown in Figure 3. Figure 3(a) depicts the space-time responses of the full frequency data at all antenna locations. It can be seen that the ground-reflected wave is so strong that the signals reflected by subsurface targets are totally masked. Figure 3(b) shows the space-time responses of the sampled data after being processed by the subspace projection clutter suppression technique. It is clear that the relatively strong ground-reflected signal is suppressed, and the space-time responses of target-reflected waves are displayed. The comparison of Figures 3(a) and (b) demonstrates that the subspace projection clutter suppression method can successfully remove the ground reflection.
horizontal position (cm) d ept h (c m )
5 10 15 20 25 30 35 40
30 35 40 45 50 -40 -35 -30 -25 -20 -15 -10 -5 0
horizontal position (cm)
dept
h (
c
m
)
5 10 15 20 25 30 35 40
30 35 40 45 50 -40 -35 -30 -25 -20 -15 -10 -5 0
(a) (b)
horizontal position (cm)
d
e
p
th
(cm)
5 10 15 20 25 30 35 40
30 35 40 45 50 -40 -35 -30 -25 -20 -15 -10 -5 0
horizontal position (cm)
d
e
p
th
(cm)
5 10 15 20 25 30 35 40
30 35 40 45 50 -40 -35 -30 -25 -20 -15 -10 -5 0
(c) (d)
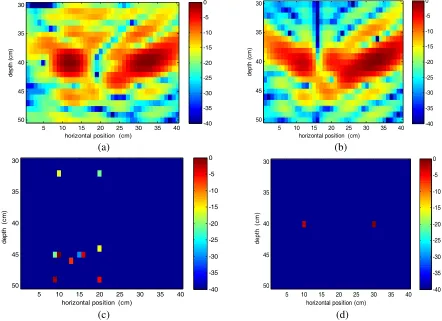
Figure 4. Corresponding reconstructed image results: (a) backprojection image result with full frequency data at all antenna locations; (b) backprojection image result with the all the measurement data processed by subspace projection clutter suppression; (c) standard CS SFGPR imaging result with the recovered frequency data at all selected antenna locations; (d) CS SFGPR imaging result with the proposed imaging method.
result obtained by utilizing the same imaging algorithm with the full measurement data processed by the subspace projection clutter suppression. Figure 4(c) shows the conventional CS SFGPR imaging result with the recovered frequency data at all selected antenna locations. Figure 4(d) shows the CS SFGPR imaging result by utilizing the proposed imaging method. It can be seen from Figures 4(c) and (d) that the targets will not be correctly located if the strong ground-reflected wave is not suppressed. In the proposed imaging algorithm, subsurface targets can be accurately imaged just by using about 10% of the total measurement data. The imaging results testify that the proposed imaging method not only can reduce the data collection volume but also can reconstruct the target image with less sidelobe compared with the imaging result obtained by utilizing the traditional backprojection algorithm.
5.2. Real SFGPR Data
Figure 5. SFGPR system measurement configuration.
antenna number
ti
m
e
10 20 30 40 50 60
200
400
600
800
1000
1200
1400
1600
1800
2000
2 4 6 8 10 x 10-4
antenna number
ti
m
e
10 20 30 40 50 60
200
400
600
800
1000
1200
1400
1600
1800
2000
0 1 2 3 4 5 6 7 8 x 10⁻⁵
(a) (b)
Figure 6. Space-time responses: (a) space-time responses of the full frequency measurement data at all antenna locations; (b) space-time responses of reduced data after being processed by the subspace projection method.
volume of the SFGPR system comprises M ×N = 61×401 = 24461 data samples. There are two sphere targets buried at position p1= (−11 cm, 12 cm) andp2 = (11 cm, 12 cm). The investigated area
is chosen from −30 cm to 30 cm in the horizontal direction and 0 cm to 30 cm in the depth direction. The whole area is partitioned into 61×31 uniform pixels.
According to the CS theory, the investigated area image can be imaged only by a reduced set of measurement data. In the real data experiment, the reduced data are obtained by using the same space-frequency sampling pattern in synthetic SFGPR data experiment. Here, 30 (50% of 61) antenna locations are randomly chosen from all antenna locations, and then 80 frequency measurement data samples (about 20.2% of the full set of frequency data) are differently selected at each chosen antenna location. Therefore, the final reduced data set accounts for about 10.1% of the total data volume.
at all antenna locations. It can be seen that the subsurface target-reflected waves are totally masked by the relatively strong ground-reflected wave. Figure 6(b) shows the space-time responses of the recovered frequency data at all selected antenna locations after being processed by the subspace clutter suppression method. It is obviously seen that the ground-reflected signal is suppressed by subspace projection clutter suppression algorithm and the space-time responses of the relatively weak target are clearly shown up.
After suppressing the strong ground-reflected wave, the conventional CS SFGPR imaging method is used to obtain the two-dimensional image of the investigated area. The corresponding imaging results are shown in Figure 7. Figure 7(a) is the traditional backprojection imaging result with the full frequency measurement data at all antenna locations. Figure 7(b) shows the traditional backprojection imaging result with the full frequency measurement data at all antenna locations after being processed by subspace projection clutter suppression. Figure 7(c) shows the conventional CS SFGPR imaging result with the recovered frequency data at all selected antenna locations. Figure 7(d) shows the CS SFGPR imaging result by utilizing the proposed imaging method, where the subsurface targets can be correctly located just by using approximately 10% of the total measurement. It can be seen from Figures 7(a) and (c) that the targets will not be correctly imaged if strong ground-reflected wave is not suppressed. Comparing Figures 7(b) and 7(d), we can see that the proposed CS SFGPR imaging method can achieve less target sidelobe than the traditional backprojection imaging algorithm.
horizontal position d ept h( m )
-0.3 -0.2 -0.1 0 0.1 0.2 0.3
0 0.05 0.1 0.15 0.2 0.25 0.3 -40 -35 -30 -25 -20 -15 -10 -5 0
horizontal position (m)
d
ept
h(
m
)
-0.3 -0.2 -0.1 0 0.1 0.2 0.3
0 0.05 0.1 0.15 0.2 0.25 0.3 -40 -35 -30 -25 -20 -15 -10 -5 0
(a) (b)
horizontal position
dep
th
(m)
-0.3 -0.2 -0.1 0 0.1 0.2 0.3 0 0.05 0.1 0.15 0.2 0.25 0.3 -40 -35 -30 -25 -20 -15 -10 -5 0 horizontal position dept h (m)
-0.3 -0.2 -0.1 0 0.1 0.2 0.3
0 0.05 0.1 0.15 0.2 0.25 0.3 -40 -35 -30 -25 -20 -15 -10 -5 0
(c) (d)
(m) (m)
(m)
6. CONCLUSION
In this paper, we propose the CS SFGPR imaging method based on subspace projection ground clutter suppression. The measurement data can be significantly reduced both in the spatial domain and frequency domain. In the proposed imaging method, all frequency measurements are independently recovered at each sampled antenna location in the first step. Then the subspace projection clutter suppression technique is used to suppress the strong ground reflection. Finally the conventional CS SFGPR imaging method is used to reconstruct the image of the investigated area. In order to make the proposed imaging method more persuasive, we test it with both the synthetic SFGPR data and real SFGPR experimental data. The imaging results show that the proposed CS SFGPR imaging method can not only reduce the measurement data for imaging, but also successfully reconstruct subsurface image with higher resolution than the traditional back projection image. However, in the real radar experiment, it will cost long time and large computer memory to get the radar imaging result for the proposed imaging method. So how to reduce the reconstruction time and the required memory will be the focus in the further study.
ACKNOWLEDGMENT
This work was supported in part by the National Natural Science Foundation of China under Grant 61302172, in part by the Natural Science Foundation of Liaoning Province under Grant 2014024002 and in part by the Doctoral Startup Foundation of Liaoning Province under Grant 20121035 and 20131085.
REFERENCES
1. Daniels, D. J., “Surface-penetrating radar,” Electron. Commun. Eng. J., Vol. 8, No. 4, 165–182, 1996.
2. Øyan, M. J., S. Hamran, L. Hanssen, and D. Plettemerier, “Ultrawideband gated step frequency ground-penetrating radar,”IEEE Trans. Geosci. Remote Sens., Vol. 50, No. 1, 212–220, Jan. 2012. 3. Nicolaescu, I., “Improvement of stepped-frequency continuous wave ground-penetrating radar
cross-range resolution,” IEEE Trans. Geosci. Remote Sens., Vol. 51, No. 1, 85–92, Jan. 2013.
4. Counts, T., A. C. Gurbuz, W. R. Scott, J. H. McCellan, and K. Kim, “Multistatic ground-penetrating radar experiments,” IEEE Trans. Geosci. Remote Sens., Vol. 45, No. 8, 2544–2553, Aug. 2007.
5. Zhuge, X. and A. G. Yarovoy, “Three-dimensional near-field MIMO array imaging using range migration techniques,”IEEE Trans. Image Proc., Vol. 21, No. 6, 3026–3033, Jun. 2012.
6. Donoho, D., “Compressed sensing,”IEEE Trans. Inf. Theory, Vol. 52, No. 4, 1289–1306, Apr. 2006. 7. Candes, E. J., J. Romberg, and T. Tao, “Robust uncertainty principles: Exact signal reconstruction from highly incomplete frequency information,”IEEE Trans. Inf. Theory, Vol. 52, No. 2, 489–509, Feb. 2006.
8. Cetin, M., I. Stojanovic, N. O. Onhon, K. R. Varshney, S. Samadi, W. C. Karl, and A. S. Willsky, “Sparsity-driven synthetic aperture radar imaging: Reconstruction, autofocusing, moving targets, and compressed sensing,” IEEE Signal Process. Mag., Vol. 31, No. 4, 27–40, Jul. 2014.
9. Gurbuz, A. C., J. H. McClellan, and W. R. Scott, “A compressive sensing data acquisition and imaging method for stepped frequency GPRs,”IEEE Trans. Signal Process, Vol. 57, No. 7, 2640– 2650, Jul. 2009.
10. Suksmono, A. B., E. Bharata, A. A. Lestari, A. G. Yarovoy, and L. P. Ligthart, “Compressive stepped-frequency continous-wave ground penetrating radar,” IEEE Geosci. Remote Sens. Lett., Vol. 7, No. 4, 665–669, Oct. 2010.
12. Tuncer, M. A. C. and A. C. Gurbuz, “Ground reflection removal in compressive sensing ground penetrating radars,” IEEE Geosci. Remote Sens. Lett., Vol. 9, No. 1, 23–27, Jan. 2012.
13. Yang, J., T. Jin, X. Huang, J. Thompson, and Z. Zhou, “Sparse MIMO array forward-looking GPR imaging based on compressed sensing in clutter environment,”IEEE Trans. Geosci. Remote Sens., Vol. 52, No. 7, 4480–4494, Jul. 2014.
14. Soldovieri, F., R. Solimene, L. L. Monte, M. Bavusi, and A. Loperte, “Sparse reconstruction from GPR data with applications to rebar detection,” IEEE Trans. Instrum. Meas., Vol. 60, No. 3, 1070–1079, Mar. 2011.
15. Ambrosanio, M. and V. Pascazio, “A compressive-sensing-based approach for the detection and characterization of buried objects,”IEEE J. Sel. Topics Appl. Earth Observ. Remote Sens., Vol. 8, No. 7, 3386–3395, Jul. 2015
16. Krueger, K. R., J. H. McClellan, and W. R. Scott, “Efficient algorithm design for GPR imaging of landmines,”IEEE Trans. Geosci. Remote Sens., Vol. 53, No. 7, 4010–4021, Jul. 2015
17. Mayordomo, A. M. and A. Yarovoy, “Optimal background subtraction in GPR for humanitarian demining,”Proc. 5th Eur. Radar Conf., 48–51, Oct. 2008.
18. Kovalenke, V., A. Yarovoy, and L. P. Ligthart, “A novel clutter suppression algorithm for landmine detection with GPR,”IEEE Trans. Geosci. Remote Sens., Vol. 45, No. 11, 3740–3751, Nov. 2007. 19. Abujarad, F., A. Jostingmeier, and A. S. Omar, “Clutter removal for landmine using different signal processing techniques,” Proc. 10th Int. Conf. Ground Penetrating Radar, 697–700, Delft, The Netherlands, Jun. 2004.
20. Hayashi, N. and M. Sato, “F-k filter designs to suppress direct waves for bistatic ground penetrating radar,”IEEE Trans. Geosci. Remote Sens., Vol. 48, No. 3, 1433–1444, Mar. 2010.
21. Wu, R., J. Liu, T. Li, Q. Gao, H. Li, and B. Zhang, “Progress in the research of ground bounce removal for landmine detection with ground penetrating radar,” PIERS Proceedings, 336–340, Hangzhou, China, Aug. 22–26, 2005.
22. Solimene, R., A. Cuccaro, A. Dell’ Aversano, I. Catapano, and F. Soldovier, “Ground clutter removal in GPR surveys,” IEEE J. Sel. Topics Appl. Earth Observ. Remote Sens., Vol. 7, No. 3, 792–798, Mar. 2014.
23. Mallat, S. and Z. Zhang, “Matching pursuit with time-frequency dictionaries,”IEEE Trans. Signal Process., Vol. 41, No. 12, 3397–3415, Dec. 1993.
24. Tropp, J. and A. Gilbert, “Signal recovery from random measurements via orthogonal matching pursuit,”IEEE Trans. Inf. Theory, Vol. 53, No. 12, 4655–4666, Dec. 2007.