67
© Global Society of Scientific Research and Researchers
http://asrjetsjournal.org/
Molecular Characterization and Genetic Variation of
Root-knot Nematode (Meloidogyne spp.,) in Selected
Legume Production Areas of Eastern Kenya
Jacinta kavuluko
a*,
Charity Gichuki
b, Waceke Wanjohi
c, Steven Runo
da,c,dKenyatta University, P. O. Box 43844-0100, Nairobi, Kenya
bMeru University of Science and Technology, P. O. Box 972-60200, Meru, Kenya aEmail: [email protected]
bEmail: [email protected] cEmail: [email protected]
dEmail: [email protected]
Abstract
Root-knot nematodes are sedentary endoparasites of plant roots and the primarynematode pathogens of most
cultivated crops worldwide, includinglegumes. Root- Knot Nematodes of the genus Meloidogyne is the most
economically important nematode pests affecting cowpea and pigeon pea in Eastern Kenya. This study sought to
identify the Meloidoigyne species of root-knot nematodes on selected legumes in Mbeere district and
characterize the genetic diversity of the species using small subunit (SSU) rDNA. PCR amplifications of the
extracted purified DNA were carried out using primers specific for the intergenic spacer region between the 5S
and 18S ribosomal DNA and the expected size of about 720bp was obtained. Purified PCR products were then
sequenced and thirteen 5S-18S rDNA sequences obtained. The sequences were aligned using CLUSTALW2,
Sequence statistics, pairwise differences, and estimates of divergence were determined with MEGA5.
Nucleotide diversities were estimated in DnaSPv5. Phylogenetic tree was drawn using Phylowin and edited in
MEGA5. From the findings of the study it has been established that root knot nematodes affecting the cowpea
and pigeon pea in Mbeere district are M. javanica, M. incognita and M. arenaria. Judging from the extent of
differences in base composition biases between sequences, it was concluded that the sequences under study have
not evolved with the same pattern of substitution.
68
Sequences from the species under study were closely related to sequences retrieved from sequences databases
especially those sequences which were less divergent due to less substitutions, deletions and insertions. It can be
concluded that SSUrDNA are useful in identification, inferring genetic diversity and phylogenetic relationships
between the isolated root knot nematodes. There is need for a rapid and reliable method to identify populations
of root-knot nematodes in order to design effective control programs.
Keywords: Phylogenetic relationships between the Meloidogyne species; intergenic region between 18S and 5S
genes; SSU rDNA analysis; Mbeere.
1.Introduction
Cowpea plays a critical role in the lives of millions of people in Africa and other parts of the developing world,
where it is a major source of dietary protein that nutritionally complements staple low-protein cereal and tuber
crops, and is a valuable and dependable commodity that produces income for farmers and traders [1, 2]. Dry
grain for human consumption is the most important product of the cowpea plant, but fresh or dried leaves (in
many parts of Asia and Africa) [3, 4], fresh peas (the southeastern USA and Senegal), and fresh green pods
(humid regions of Asia and in the Caribbean) may be the most important in some local situations.
Pigeon pea (Cajanus cajan (L) Millsp.) is an important grain legume crop of rain-fed agriculture in the semi-arid
tropics.Cowpea and pigeon pea are grown in many regions where root-knot nematodes (RKNs) are a major
problem in production fields. Root-knot nematodes (Meloidogyne spp.) are economically important plant
pathogens, displaying marked sexual dimorphism. Males are vermiform and active. Females are pyriform or
saccate and sedentary, laying eggs in a gelatinous matrix (“egg sac”). Usually only the roots are attacked, and
these are induced to form characteristic galls (“knots”) on many host plants. They are the primarynematode
pathogens of most crop species worldwide, including many cultivated legumes [5]. The major root-knot
nematode (RKN) species, Meloidogyne incognita, M. javanica, M.arenania, and M. hapla, are geographically
widespread and capable of infecting and damaging a wide range of plant hosts, making them economically
important agricultural pests [6].
Control of root-knot nematodes, Meloidogyne spp., bycrop rotation or through the use of resistant cultivars can
be accomplished only if the species and host races to be controlled are known. Accurate identifications are
necessary because some species or races attack certain crop plants, whereas others do not, and resistance
developed in one crop cultivar is not necessarily effective against all species or races of root knot nematodes.
Because of the importance ofidentification in the design of effective control programs, there is need for a rapid
and reliable method to identify populations of root-knot nematodes.
Though root-knot nematodes (RKNs) are of worldwide economic importance, they are the most difficult to
identify to species level due to their high level variability within the species and existence of biotypes whose
identities cannot be verified morphologically. Identification of RKN has heavily relied on morphological
features and morphometric attributes of the females, males, and second stage juveniles [6,7], also through
69
and imprecision: The morphological variability of the perineal patterns may be absent or difficult to observe [9];
in morphometric studies, most characters show overlapping ranges while others have limited usefulness. In
karyological studies; the small chromosomes used are difficult to observe and count. Use of host range is useful
yet time consuming as it requires a minimum of 30 days to produce RKN inoculums [8]. These are further
compounded by the occurrence of biotypes. Due to the above shortcomings, nucleic acid based techniques have
been developed to overcome these limitations. In this study; identification and characterisation of RKN was
done using nematode small-sub unit ribosomal DNA (rDNA). The phylogenetic relationship between the
Meloidogyne spp. isolated from the selected sites in Mbeere district was also established.
2.Materials and methods
2.1. Study sites and sampling
Sampling was done in three selected sites in Mbeere district (Gachoka, Mwea, and Siakago zones). Each of the
sites was divided into 2 localities from which 10 cowpea and 10 pigeon pea plants infected by RKNs were
randomly selected and uprooted. They were packaged in paper bags and transported to Kenyatta University
where infected plants were used to raise pure cultures [10].
2.2. DNA extraction and purification
Single females were handpicked from the infected cowpea and pigeon pea plants from each site, and inoculated
on tomato (Lycoperscion esculentum) seedlings variety Moneymaker. The seedlings were maintained under
greenhouse conditions at 20-28ºCfor 35 days. Plants were then harvested and females used for DNA extraction
according to a protocol used for cyst nematodes [11] and adjusted to optimize laboratory conditions following
[12]. DNA pellet was stored at -20 ºC and used for further analysis. DNA concentration was calculated using the
Gene Quant spectrophotometer (Biochrom,Cambridge-UK).
2.3. SSUrDNA PCR amplification
PCR amplifications of the extracted DNA were carried out for each isolate in a reaction volume of 10µl. The
primers used were code 194 and code 195[13];specificity of these primers is 5S- 18S ribosome region (figure
1).
Figure 1: Meloidogyne rDNA cistrons showing the position of the PCR primers. Schematic diagram (not to
scale) showing the position of the PCR primers (194/195) used to amplify the intergenic (IGS) region between
18S and 5S genes. The annealing locations of the oligonucleotide primers and their orientations are indicated by
70
PCR was carried out in a thermal cycler under the following conditions: Initial preheating at 94ºC for 5
minutes, 40 cycles of (94 ºC for 1 minute; 52ºC for 2 seconds; 72ºC for 90 seconds) and final extension step at
72ºC for 5 minutes. The amplified PCR products were electrophoretically fractionated in 1X TAE buffer in 1%
agarose gel (Seakem®, Cambrex Bio science; Rockland, USA) and visualized by staining with 0.003% ethidium
bromide (0.02 μg/ml). Hyperladder I DNA ladder (bioline) was used as molecular size markers. Gels were viewed on a UV transilluminator.
The bands were excised from the gel and purified with the Qiaquick PCR Cleanup kit (Qiagen Operon,
Alameda, CA). The amplicons were concentrated by ethanol precipitation for direct sequencing. The amount of
DNA obtained was quantified using a spectrophotometer [14].
2.4. Phylogenetic analysis
Nucleotide sequences were aligned using CLUSTAL W [15]. Sequence statistics, pairwise differences, and
estimates of divergence were determined with MEGA5 [16]. Nucleotide diversities were estimated with another
computer program; DnaSPv5 [17]. Nucleotide diversities and divergences were based on observed numbers of
differences only. Gaps were treated as missing data with pairwise exclusion. Molecular phylogenetic
relationships were constructed using discrete character-based (maximum parsimony and maximum likelihood
respectively) algorithms implemented in the Phylowin with all characters unordered and unweighted and edited
in MEGA5. During the analyses involving alignment from the secondary structure, phylogeny trees were rooted
alternately with the most divergent of the species under study in order to compare tree topologies.
3.Results
3.1. SSU rDNA analysis
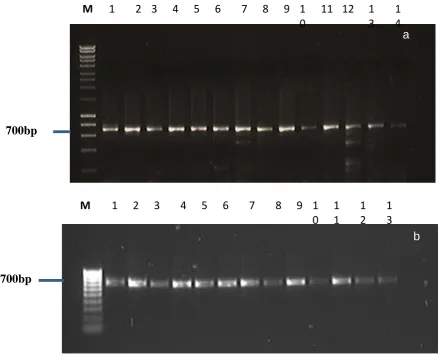
Using primers 194 and 195, there was no obvious size polymorphisms evident in the PCR products produced
from the Meloidogyne species under study. The size of the single bands is about 700bps (figure 2a). It was
therefore not possible to identify the species using PCR hence the need for purifying the PCR products for
sequencing (Figure 2b).
3.2. Genetic diversity between the Meloidogyne species
3.2.1. rDNA sequences
Two microlitres (2µl) of the purified PCR product using forward primer (code 194) was sequenced with the
applied Biosystems Big Dye Terminator cycle sequencing in a DNA automated sequencer (SegoliLab,
International Livestock Research Institute - ILRI, Nairobi Kenya). The partial 5s rDNA genome sequences were
assembled and edited using BioEdit sequence alignment editor [18]; gaps and ambiguities were eliminated from
the final sequences.
71
in this study varied from 663 to 802 bp.Figure 2(a): 1% agarose gel of PCR products amplified using primers specific for the 18S and 5S SSUrDNA of
Meloidogyne species M: Hyperladder 1 (bioline) (b): 1% agarose gel of purified PCR products of representative
Meloidogyne species ready for sequencing: M: Hyperladder IV ( bioline).
3.2.2. Sequence alignments
The sequences of 5s rDNA were aligned using the default parameters of Clustalw2.1 [15]. A total of 13
sequences were aligned. Conserved regions have stars (*) below the nucleotide bases and the rest show the
variable regions (Figure 3A).
3.2.3. Blasted and aligned sequences
The sequences of 5S rDNA were used as queries to search similar sequences in sequences databases at NCBI
via the blast algorithms. The retrieved sequences were aligned against the sequences obtained from this study
(J1 to J13). Alignments were done using the default parameters of CLUSTALW2.1 [15]. Samples J1 to J13 are
Meloidogyne species from cowpea and pigeon pea from Mbeere while the rest are sequences selected and
downloaded from GenBank with accession numbers (GQ395506.1, FJ555690.1, GQ395518.1, and
M
1
2
3
4
5
6
7
8
9
1
0
11
12
1
3
1
4
700bp
M
2
3
4
5
6
7
8
9
1
0
1
1
1
2
1
3
1
700bp
a
72
GQ395510.1). They were selected because they had a species identity of between 98 to 99%. The sequences
under study aligned to the GenBank downloaded sequences showing high level of conservation as shown by the
stars (*) under the base sequences. The results are shown below
A)
J10
GTTTAAAGGAAAACTCAAATTGGGCTAATCTAGAAACTCGTGGAGAGAAATAATAAGATT 151
J12
GTTTAAAGGAAAACTCAAATTGGGCTAATCTAGAAACTCGTGGAGAGAAATAATAGGATT 173
J5
GTTTAAAGGAAAACTCAAATTGGGCTAATCTAAAAACTCGTGGAGAGAAATAATAGGATT 173
J1
GTTTAAAGGAAAACTCAAATTGGGCTAATCTAGAAACTCGTGGAGAGAAATAATAGGATT 176
J7
GTTTAAAGGAAAACTCAAATTGGGCTAATCTAGAAACTCGTGGAGAGAAATAATAGGATT 171
J8
GTTTAAAGGAAAACTCAAATTGGGCTAATCTAGAAACTCGTGGAGAGAAATAATAGGATT 172
J4
GTTTAAAGGAAAACTCAAATTGGGCTAATCTAGAAACTCGTGGAGAGAAATAATAGGATT 169
J6
GTTTAAAGGAAAACTCAAATTGGGCTAATCTAGAAACTCGTGGAGAGAAATAATAGGATT 169
J2
GTTTAAAGGAAAACTCAAATTGGGCTAATCTAGAAACTCGTGGAGAGAAATAATAGGATT 168
J3
GTTTAAAGGAAAACTCAAATTGGGCTAATCTAGAAACTCGTGGAGAGAAATAATAGGATT 173
J9
GTTTAAAGGAAAACTCAAATTGGGCTAATCTAGAAACTCGTGGAGAGAAATAATAGGATT 171
J13
GTTTAAAGGAGAACTCAAATTGGGCTAATCTAGAAACTCGTGGAGAGAAATAATAGGATT 174
73
GGTTAAAAGAAAAATCCAATTGGGCCAAACCAAAAACCCCGGGAAAAAAATTAAAAGAAT 172
* ***** ** ** ** ******** ** * * **** * *** * **** * * ** *
J10 AAAAAATTTTTTGAAAAATTTAAAGTTTATTATTATAATAAGCTTTGTTTTTTGAAAAAT
211
J12 AAAAAATTTTTTGAAAAATTTAAAGTTTATTATTATAATAAGCTTTGTTTTTTGAAAAAT
233
J5 AAAAAATTTTTTGAAAAATTTAAAGTTTATTATTATAATAAGCTTTGTTTTTTGAAAAAT
233
J1 AAAAAATTTTTTGAAAAATTTAAAGTTTATTATTATAATAAGCTTTGTTTTTTGAAGAAT
236
J7 AAAAAATTTTTTGAAAAATTTAAAGTTTATTATTATAATAAGCTTTGTTTTTTGAAGAAT
231
J8 AAAAAATTTTTTGAAAAATTTAAAGTTTATTATTATAATAAGCTTTGTTTTTTGAAGAAT
232
J4 AAAAAATTTTTTGAAAAATTTAAAGTTTATTATTATAATAAGCTTTGTTTTTTGAAGAAT
229
J6 AAAAAATTTTTTGAAAAATTTAAAGTTTATTATTATAATAAGCTTTGTTTTTTGAAGAAT
229
J2 AAAAAATTTTTTGAAAAATTTAAAGTTTATTATTATAATAAGCTTTGTTTTTTGAAGAAT
228
J3 AAAAAATTTTTTGAAAAATTTAAAGTTTATTATTATAATAAGCTTTGTTTTTTGAAGAAT
233
J9 AAAAAATTTTTTGAAAAATTTAAAGTTTATTATTATAATAAGCTTTGTTTTTTGAAGAAT
231
J13 AAAAAATTTTTTGAAAAATTTAAAGTTTATTATTATAAAAAACTTTGTTTTTTGAAGAAT
234
J11 AAAAAATTTTTTTAAAAATTTAAAGTTTATTAATAAAATAAACTTTGTTTTTTGAAAAAA
74
************ ******************* ** ** ** ************** **
J1 ACAAATTTCGCTGAGGCAAAGTGGGCGTGGATTT
-CGATGTTCGCTGTTCGCGGGAATGG 117
J7 ACAAATTTCGCTGAGGCAAAGTGGGCGTGGATTT
-CGATGTTCGCTGTTCGCGGGAATGG 112
gb|GQ395506.1 ACAAATTTCGCTGAGGCAAAGTGGGCGTGGATTT
-CGATGTTCGCTGTTCGCGGGAATGG 105
J8 ACAAATTTCGCTGAGGCAAAGTGGGCGTGGATTT
-CGATGTTCGCTGTTCGCGGGAATGG 113
gb|FJ555690.1
ACAAATTTCGCTGAGGCAAAGTGGGCGTGGCTTTTCGATGTTCGCTGTTCGCGGGAATGG 100
J12
ACAAATTTCGCTGAGGCAAAGTGGGCGTGGCTTTTCGATGTTCGCTGTTCGCGGGAATGG 114
gb|GQ395518.1
ACAAATTTCGCTGAGGCAAAGTGGGCGTGGCTTTTCGATGTTCGCTGTTCGCGGGAATGG 106
gb|GQ395510.1|
ACAAATTTCGCTGAGGCAAAGTGGGCGTGGCTTTTCGATGTTCGCTGTTCGCGGGAATGG 106
J5
ACAAATTTCGCTGAGGCAAAGTGGGCGTGGCTTTTCGATGTTCGCTGTTCGCGGGAATGG 114
J2 ACAAATTTCGCTGAGGCAAAGTGGGCGTGGATTT
-CGATGTTCGCTGTTCGCGGGAATGG 109
J4 ACAAATTTCGCTGAGGCAAAGTGGGCGTGGATTT
-CGATGTTCGCTGTTCGCGGGAATGG 110
J6 ACAAATTTCGCTGAGGCAAAGTGGGCGTGGATTT
-CGATGTTCGCTGTTCGCGGGAATGG 110
J3 ACAAATTTCGCTGAGGCAAAGTGGGCGTGGATTT
-CGATGTTCGCTGTTCGCGGGAATGG 114
J9 ACAAATTTCGCTGAGGCAAAGTGGGCGTGGATTT
75
J10 A---ATTTCGCTGAGGCAA-GTGGGCGTGGATTT-CCATGTTCGCTGGTCGCGGGAATGG
92
J13 ACAAATTTCGCTGAGGCAAAGTGGGCGTGGATTT
-CCATGTTCGCTGGTCTCGGGAATGG 115
J11 ACAAATTTCGCTGAGGCAAAGTGGCCGTGGATTT
-CCAAGGTCCCCGGTCCCGGGAAAGG 113
* *************** **** ***** *** * * * ** * * ** ****** **
J1
TTTAAAGGAAAACTCAAATTGGGCTAATCTAGAAACTCGTGGAGAGAAATAATAGGATTA 177
J7
TTTAAAGGAAAACTCAAATTGGGCTAATCTAGAAACTCGTGGAGAGAAATAATAGGATTA 172
gb|GQ395506.1
TTTAAAGGAAAACTCAAATTGGGCTAATCTAGAAACTCGTGGAGAGAAATAATAGGATTA 165
J8
TTTAAAGGAAAACTCAAATTGGGCTAATCTAGAAACTCGTGGAGAGAAATAATAGGATTA 173
gb|FJ555690.1
TTTAAAGGAAAACTCAAATTGGGCTAATCTAGAAACTCGTGGAGAGAAATAATAGGATTA 160
J12
TTTAAAGGAAAACTCAAATTGGGCTAATCTAGAAACTCGTGGAGAGAAATAATAGGATTA 174
gb|GQ395518.1
TTTAAAGGAAAACTCAAATTGGGCTAATCTAGAAACTCGTGGAGAGAAATAATAGGATTA 166
gb|GQ395510.1|
TTTAAAGGAAAACTCAAATTGGGCTAATCTAGAAACTCGTGGAGAGAAATAATAGGATTA 166
J5
TTTAAAGGAAAACTCAAATTGGGCTAATCTAAAAACTCGTGGAGAGAAATAATAGGATTA 174
J2
TTTAAAGGAAAACTCAAATTGGGCTAATCTAGAAACTCGTGGAGAGAAATAATAGGATTA 169
J4
76
J6TTTAAAGGAAAACTCAAATTGGGCTAATCTAGAAACTCGTGGAGAGAAATAATAGGATTA 170
J3
TTTAAAGGAAAACTCAAATTGGGCTAATCTAGAAACTCGTGGAGAGAAATAATAGGATTA 174
J9
TTTAAAGGAAAACTCAAATTGGGCTAATCTAGAAACTCGTGGAGAGAAATAATAGGATTA 172
J10
TTTAAAGGAAAACTCAAATTGGGCTAATCTAGAAACTCGTGGAGAGAAATAATAAGATTA 152
J13
TTTAAAGGAGAACTCAAATTGGGCTAATCTAGAAACTCGTGGAGAGAAATAATAGGATTA 175
J11
GTTAAAAGAAAAATCCAATTGGGCCAAACCAAAAACCCCGGGAAAAAAATTAAAAGAATA 173
***** ** ** ** ******** ** * * **** * *** * **** * * ** **
Figure 3: Nucleotide sequence alignments showing conserved and variable regions. A) J1 to J13 are from
selected legumes in Mbeere district. B) Sequences under study and GenBank generated sequences. Conserved
regions have stars (*) below the nucleotide bases and the rest show the variable regions.
3.3. Pairwise distance matrix
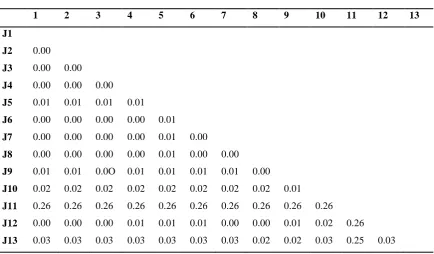
The pairwise distances among the Meloidogyne spp. 5S rDNA sequences are shown in table 1 below. Judging
from the extent of differences in base composition biases between sequences, it was concluded that the
sequences under study have not evolved with the same pattern of substitution. Sequence J11 has a higher base
substitution per site from between the rest of the sequences, which is 0.26 while sequence J13 has a low base
substitution between all the other sequences except between J11. The analysis involved 13 nucleotide
sequences. Codon positions included were 1st+2nd+3rd+Noncoding. All positions containing gaps and missing
data were eliminated. There were a total of 466 positions in the final dataset. The overall average evolutionary
divergence (mean distance) over all sequence pairs was 0.042. Evolutionary analyses were conducted in
MEGA5 using the Maximum Composite Likelihood model [16].
3.4. Nucleotide substitution
The probability of transitional substitutions (between purine to purine or pyrimidine to pyrimidine) is high
compared to the transversional substitutions (purine to pyrimidine or vice versa). The pattern of nucleotide
substitution was done using alignments of Meloidogyne species under study (J1-J13) compared to the sequences
77
substitution (r) from one base (row) to another base (column). Substitution pattern and rates were estimated
under the Tamura-Nei model [16] with rates of different transitional substitutions in bold and those of
transversional substitutions are shown in italics in the table below. C/T transitional substitutions having the
highest incidence. Relative values of instantaneous r should be considered when evaluating them. The sum of r
values is made equal to 100. The nucleotide frequencies were A = 32.83%, T = 38.46%, C = 12.75% and G =
15.95%. Codon positions included were 1st+2nd+3rd+Noncoding. The transition/transversion rate ratios are k1
= 3.169 (purines) and k2 = 73.15 (pyrimidines). The overall transition/transversion bias is R = 13.739, where R =
[A*G*k1+ T*C*k2]/[(A+G)*(T+C)].
Table 1: Estimates of Evolutionary Divergence between 13 aligned Sequences
1 2 3 4 5 6 7 8 9 10 11 12 13
J1
J2 0.00
J3 0.00 0.00
J4 0.00 0.00 0.00
J5 0.01 0.01 0.01 0.01
J6 0.00 0.00 0.00 0.00 0.01
J7 0.00 0.00 0.00 0.00 0.01 0.00
J8 0.00 0.00 0.00 0.00 0.01 0.00 0.00
J9 0.01 0.01 0.0O 0.01 0.01 0.01 0.01 0.00
J10 0.02 0.02 0.02 0.02 0.02 0.02 0.02 0.02 0.01
J11 0.26 0.26 0.26 0.26 0.26 0.26 0.26 0.26 0.26 0.26
J12 0.00 0.00 0.00 0.01 0.01 0.01 0.00 0.00 0.01 0.02 0.26
J13 0.03 0.03 0.03 0.03 0.03 0.03 0.03 0.02 0.02 0.03 0.25 0.03
Table 2: Maximum Composite Likelihood Estimate of the Pattern of Nucleotide Substitution for 20 aligned
sequences
A T/U C G
A - 0.98 0.27 1.19
T 0.82 - 19.96 0.38
C 0.82 71.38 - 0.38
G 2.59 0.98 0.27 -
3.5. Nucleotide diversity for the 13 aligned sequences
The thirteen 5S-18S rDNA Sequences obtained in this study varied from 663 to 802 bp. They had a total of 663
78
informative sites as shown in the table 3 below. The sequences had a nucleotide diversity of 0.62919 as
analyzed in DNA Sequence Polymorphism (DnaSP version 5 [17] and MEGA5.
Table 3: Results from Tajima's Neutrality Test for 13 aligned sequences
m S ps Θ Π D
13 663 1.000000 0.322247 0.629191 4.399088
The abbreviations used are as follows: m = number of sites, S = Number of segregating sites (polymorphic
sites), ps= S/m, Θ = ps/a1, and π = nucleotide diversity. D is the Tajima test statistic. Statistical significance:
***, P < 0.001 [19].
3.6. Phylogenetic relationships between the Meloidogyne species
Small subunit Ribosomal DNA has been a popular target, because highly conserved sequences are interspersed
with less conserved regions, enabling phylogenetic studies at various taxonomic levels.
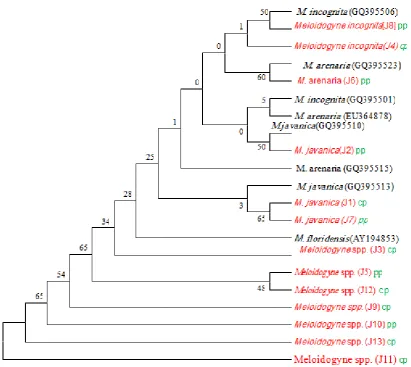
Sequences J8 and J4 are sister taxa to M. incognita (GQ395506) while J6 and M. arenaria (GQ395523) are
sister taxa. Sequence J2, J1 and J7 are sister taxa to M. javanica (GQ395510 and 395513 respectively) but in
different subgroups. J5 and J12 seem to be sister taxa within the same subgroup. Meloidogyne spp. (J11) is
depicted as a sister taxon to the remaining species, being more divergent it forms the basal taxon to the rest of
the species. The relationships are not supported by high bootstrap analyses.
The samples under study did not give identical sequences for the blasted sequences for the same species this
could be due to substitutions mostly transitional as shown in table 2 above. The species did not take the same
rate of substitutions. This is shown in table 1, figure 3A and 3B which showed that J11 was more divergent
followed by J13 which were both from Gachoka infecting cowpea plant. Some species could not be identified
since they did not cluster with the GenBank downloaded sequences hence could only be referred to as
Meloidogyne spp.
4.Discussion
PCR amplifications of the extracted purified DNA were carried out using primers 194 and 195 [13]. The
194/195 ribosomal primers successfully amplified fragments of the expected size from extracted DNA.The size
of the PCR product obtained following amplification of the intergenic spacer region between the 5S and 18S
ribosomal genes is about 720 bp, this agrees with work done by [20] whose findings grouped M. incognita, M.
javanica, M. arenaria as having 720 bp. The purified PCR products were sequenced with the forward primer
(code 194) and thirteen 5S rDNA sequences obtained in this study varied from 663 to 802 bp. Sequence J13 was
79
Figure 4: Maximum likelihood tree based on 5s-18s rDNA gene sequences. The accession numbers of the
GenBank-downloaded sequences are shown in parentheses. Numbers next to branches are bootstrap values from
MP analyses, isolates under study are shown in red colour while selected legumes cowpea (cp) and pigeon pea
(pp) are shown in green.
The others had lengths varying from 669 to 690 bp. Sequences have not evolved with the same pattern of
substitution, as judged from the extent of differences in base composition biases between sequences. Sequence
J11 seems to have undergone high rate of substitutions compared to the rest of the sequences under study
followed by J13 with the least being sequence J4 and J8. The study favoured a higher rate of transitional
substitution compared to transversional substitution with C/T substitution having the highest degree of
incidence. Some of the substitutions of J11 are at 17, 59, 89,99,93,97,107,111,138,141,155 base pairs. This
explains why it is more divergent than the rest of the species and it does not cluster with the other species in the
phylogram.
Within the rDNA repeats from a wide variety of organisms, the IGS region is the least conserved. However, in
this study little sequence variation was found in the region between the 18S and 5S genes for the group
comprising M. incognita, M. arenaria, or M. javanica, despite the populations originating from two different
80
parthenogenetic mode of reproduction of Meloidogyne species that theoretically give rise to clonal progenies
[8]. Nevertheless, the existence of variation in the form of mixtures of clones originated by mutation cannot be
discarded.
The samples under study did not give 100% identical sequences for the blasted sequences for the same species
this could be due to substitutions mostly transitional, they seemed more divergent may be because of deletions ,
insertions and substitutions as observed in the alignments done by clustalW2.
Several isolates of Meloidogyne clustered separately in the phylogram and J11 was depicted as the basal taxon
to the rest. Some differences between the sequences may be due to a natural variation within the population
[21]. However, artefacts during amplification may cause some variations and these also explain some
dissimilarity between the sequences under study and GenBank downloaded sequences.
Some authors have reported differences within rDNA sequences among isolates belonging to the same species,
implying that some Meloidogyne spp. are more molecularly heterogeneous than previously thought [22,23].
From the findings of the study it has been established that root knot nematodes affecting the selected legumes
are M. javanica, M. incognita and M. arenaria. The species under study were closely related to the blasted
sequences especially sequences which were less divergent due to less substitutions , deletions and insertions.
Sequence J4 and J8 aligned well with blasted sequence accession number GQ395506 whose identity is M.
incognita. Sequence J11 was the basal taxon being more divergent than the other species.
Extent of sequence divergence is used as a parameter to estimate relatedness of taxa [24]. SSU sequence
information has been used to estimate the phylogenetic history of phylum Nematoda [25].
5.Conclusion
The SSUrDNA has been a useful tool for identifying, showing variability and inferring phylogenetic
relationships between the species collected from Mbeere district. SSUrDNA also does not rely on the expressed
products of the genome unlike the isozyme phenotypes.
The Meloidogyne species affecting cowpeas and pigeon peas in the selected sites in Mbeere district are M.
arenaria, M. incognita and M. javanica. The farms where the infected samples were collected practiced mixed
cropping hence the Meloidogyne species affecting the cowpea and pigeon pea in Mbeere did not seem to favor
either of the legumes.
The obtained data showed that despite reproduction among the studied species being mitotic parthenogenesis,
intrapopulation variations have occurred within the isolated Meloidogyne spp.
Acknowledgements
81
research through grant.Recommendations
More identification can be done on other crops in Mbeere in order to establish the species diversity of
Meloidogyne species.
For a study of differences between very similar isolates, as observed in the study, some less conserved DNA
sequence will be more useful. Although rDNA region is specific at the species level in the genus Meloidogyne
for example, and may be used for species identification, it is unlikely to be useful for the identification of very
similar isolates as it is highly conserved.
References
[1] A.S. Langyintuo, J. Lowenberg-DeBoer, M. Faye, D. Lambert, G. Ibro, B. Moussa,et al. “Cowpea
supply and demand in West Africa.” Field Crops Resource,vol. 82, pp. 215–231, 2003.
[2] B. B. Singh. “Recent genetic studies in cowpea,” In: Challenges and Opportunities for Enhancing
Sustainable Cowpea Production, C.A. Fatokun, S.A. Tarawali, B.B. Singh, P.M. Kormawa, M. Tamo,
Ed. Ibadan, Nigeria:IITA,2002,pp. 3–13.
[3] K. Ahenkora, H. K. Adu-Dapaah, and A. Agyemang. “Selected nutritional components and sensory
attributes of cowpea (Vigna unguiculata [L.] Walp.) leaves.” Plant Foods Human Nutrition,vol. 52, pp.
221–229, 1998.
[4]S. S. Nielsen, T. A. Ohler, and C. A. Mitchell. “Cowpea leaves for human consumption: production,
utilization, and nutrient composition.” In: Advances in Cowpea Research, B.B. Singh, D.R. Mohan
Raj, K.E. Dashiell, L.E.N. Jackai, Ed. Sayce, Devon, UK: Copublication of International Institute of
Tropical Agriculture (IITA) and Japan International Research Center for Agricultural Sciences, 1997,
326–332.
[5] K. Barker. “Introduction and synopsis of advancements in nematology” In: Plant Nematode
Interactions, K.R. Barker, G.A. Pederson , G.L. Windham, Ed. Madison, WI: American Society of
Agronomy, Crop Science Society of America, Soil Science Society of America, 1998, 1–20.
[6] J. D. Eisenback and H. H. Triantaphyllou. “Root-knot nematodes: Meloidogyne species and races”
Manual of Agricultural Nematology, pp. 191-274, 1991.
[7] S. B. Jepson. Identification of Root-knot Nematodes (Meloidogyne species). Wallingford,UK: CABI
Publishing, 1987, pp. 265.
82
advanced treatise on Meloidogyne, Biology and control vol. 1. J. N. Sasser, C. C. Carter, Ed. Raleigh:
North Carolina State University Graphics, 1985, pp. 113 126 .
[9] T. J. Baum, P.M. Gresshoff, S. A. Lewis and R. A. Dean. “Characterization and phylogenetic analysis
of four root- knot nematode species using DNA amplification fingerprinting and automated
polyacrylamide gel electrophoresis.” Molecular Plant-Microbe Interactions,vol. 7, pp. 39-47,1994.
[10] J. M. Kavuluko, C. Gichuki, J.W. Waceke and S.M. Runo. “Characterisation of root-knot nematodes
(Meloidogyne spp.) from selected legumes in Mbeere District Kenya using isoenzyme phenotypes.” In
“Transforming Agriculture for improved livelihoods through Agricultural Product Value Chains: The
Proceedings of the 12th KARI Biennial Scientific Conference” Nairobi Kenya, 8- 12th Nov 2010, pp.
92- 97
[11] S. Bekal, J.P. Gauthier and R. Rivoal. “Genetic diversity among a complex of cereal cyst nematodes
inferred from RFLP analysis of the ribosomal internal transcribed spacer region.” Genome, vol. 40,
pp. 479-486, 1997.
[12] O. Randig, F. Leroy, M. Bongiovanni and P. Castagnone-Sereno. “RAPD characterisation for single
females of the root-knot nematodes, Meloidogyne spp.” European Journal of Plant Pathology ,vol. 107
pp. 639–643. 2001.
[13] V. C. Blok, M.S. Phillips and M. Fargette. “Comparison of sequences from the ribosomal DNA
intergenic region of Meloidogyne mayaguensis and other major tropical root-knot nematodes.”
Nematology, vol. 2, pp. 16-21,1997.
[14] Sambrook and Russel. Molecular cloning. A laboratory manual. New York: Cold spring harbour
publishers. 2001
[15] J. D. Thompson, T. J. Gibson, F. Plewniak , F. Jeanmougin and D. G. Higgins. “The Clustal-x
Windows interface: flexible strategies for multiple sequence alignment aided by quality analysis
tools.” Nucleic Acids
Research,vol. 25, pp. 4876–4882, 1997.
[16] K. Tamura, J. Dudley, M. Nei and S. Kumar. “MEGA4: Molecular Evolutionary Genetics Analysis
(MEGA) software version 4.0.” Molecular Biology and Evolution,vol. 24 pp. 1596- 1599, 2007.
[17] P. Librado and J. Rozas. “DnaSP v5: A software for comprehensive analysis of DNA polymorphism
data.”Bioinformatics,vol 25 pp. 1451-1452, 2009.
83
Windows 95/98/NT.” Nucleic Acids Symposium Ser,vol. 41 pp. 95-98, 1999.
[19] F. Tajima. “ Statistical methods to test for nucleotide mutation hypothesis by DNA polymorphism.”
Genetics,vol. 123, pp. 585-595, 1989.
[20] M. A. M. Adam, M. S. Phillips and V. C. Blok . “Identification of Meloidogyne spp. from north east
Libya and comparison of their inter- and intro-specific genetic variation using RAPDs.” Nematology ,
vol. 7, pp. 599–609,2000.
[21] S. A. Subbotin, P.D. Halford, A. Warry and R.N. Perry. “Variations in ribosomal DNA sequences and
phylogeny of Globodera parasitising solanaceous plants.” Nematology , vol. 2, pp. 591–604, 2000.
[22] M. S. Tigano, R. M. D. G. Carneiro, A. Jeyaprakash, D. W. Dickson and B. J. Adams. “Phylogeny of
Meloidogyne spp. based on 18S rDNA and the intergenic region of mitochondrial DNA sequences.”
Nematology , vol. 7,pp. 851–862, 2000.
[23] P. De Ley and W. Bert. “Video capture and editing as a tool for the storage, distribution and
illustration of morphological characters of nematodes.” Journal of Nematology , vol.34, pp. 296–
302,2002.
[24] J. G. Files and D. Hirsh . “Ribosomal DNA of Caenorhabditis elegans.” Journal of Molecular Biology,
vol. 149, pp. 223, 1981.
[25] M. L. Blaxter, P. Deley, J. R. Garrey, L. X. Liu, A. V. Scheldeman, J.R. Vanflenten et al.