Scholarship@Western
Scholarship@Western
Electronic Thesis and Dissertation Repository
8-23-2013 12:00 AM
Capacity Assessment of a Transmission Tower under Wind
Capacity Assessment of a Transmission Tower under Wind
Loading
Loading
Thomas G. MaraThe University of Western Ontario
Supervisor Dr. H.P. Hong
The University of Western Ontario
Graduate Program in Civil and Environmental Engineering
A thesis submitted in partial fulfillment of the requirements for the degree in Doctor of Philosophy
© Thomas G. Mara 2013
Follow this and additional works at: https://ir.lib.uwo.ca/etd Part of the Structural Engineering Commons
Recommended Citation Recommended Citation
Mara, Thomas G., "Capacity Assessment of a Transmission Tower under Wind Loading" (2013). Electronic Thesis and Dissertation Repository. 1527.
https://ir.lib.uwo.ca/etd/1527
This Dissertation/Thesis is brought to you for free and open access by Scholarship@Western. It has been accepted for inclusion in Electronic Thesis and Dissertation Repository by an authorized administrator of
(Thesis format: Integrated Article)
by
Thomas Goodwin Mara
Graduate Program in Civil and Environmental Engineering
A thesis submitted in partial fulfillment of the requirements for the degree of
Doctor of Philosophy
The School of Graduate and Postdoctoral Studies The University of Western Ontario
London, Ontario, Canada
ii
Abstract
Transmission towers play a vital role in power distribution networks and are often subject to
strong wind loads. Lattice tower design is often based on a linear elastic response to wind
loading using methodology derived for atmospheric boundary layer (ABL) winds. A number
of failures have been attributed to high intensity wind (HIW) events such as downbursts and
tornadoes. This thesis investigates extreme winds on a self-supported lattice transmission
tower and ultimately makes comparisons of the capacity under ABL and HIW. The
force-deformation relation between the base shear and the displacement of the tip of the tower are
used to represent the capacity curve of a structure under wind loading.
Wind tunnel testing is used to evaluate the aerodynamic behaviour of a typical tower
cross-arm section, which serves as the basis for selection of wind loading expressions for the
numerical model. Recommendations are made for further investigation of lattice
aerodynamics, including a more robust definition of the drag coefficient. Capacity estimates
obtained using the incremental dynamic analysis (IDA) and nonlinear static pushover (NSP)
procedures are compared, which indicate good agreement for ABL winds. The analyses
consider both geometric and material nonlinearity. The NSP analysis is used to estimate the
capacity of the tower under various wind profiles for the transverse and longitudinal wind
directions, and it is shown that the capacity curve obtained under typical downburst scenarios
can be approximately enveloped by those obtained under rectangular and ABL wind profiles.
An uncertainty propagation analysis is carried out using the simple Monte Carlo technique,
which shows that the coefficient of variation of the tower capacity is small compared to that
associated with extreme wind load effects. Oblique wind directions are considered for ABL,
rectangular and downburst wind loading, which associate critical wind speeds with direction.
The resulting capacity curves are used to develop the capacity surface of the tower. It is
shown that a conservative approximation of the tower capacity curve, or surface, under
downburst wind is made if a fully correlated ABL wind loading profile is used as the wind
iii
Keywords
Electric transmission structures, lattice towers, nonlinear analysis, capacity curve, inelastic
iv
Co-Authorship Statement
This thesis has been prepared in Integrated Article format as specified by the School of
Graduate and Post-doctoral Studies at the University of Western Ontario. Statements
regarding the co-authorship of individual chapters are as follows:
Chapter 2: Experimental investigation of lattice section aerodynamics
All wind tunnel experiments were designed and carried out by T.G. Mara; the experiments
involving the cross-arm section were carried out with the guidance of J.K. Galsworthy. The
manuscripts comprising Chapter 2 were prepared by T.G. Mara. A paper co-authored by
T.G. Mara and J.K. Galsworthy, which discusses the aerodynamics of cross-arm sections,
will be submitted for potential publication in a peer-reviewed journal. A second paper,
authored by T.G. Mara, which discusses the relationship between the drag coefficient and
solidity ratio of lattice frames, has been accepted to the Journal of Engineering Mechanics.
Chapter 3: Comparison of capacity assessment methods for a lattice transmission tower
A numerical model of the tower was initially developed by C.-S. Lee; significant changes to
the components, loading and output of the tower model were implemented by T.G. Mara.
Analysis and interpretation was carried out by T.G. Mara under the supervision of H.P.
Hong. The manuscript for Chapter 3 was prepared by T.G. Mara and modifications were
completed under the supervision of H.P. Hong.
Chapter 4: Capacity of a transmission tower under ABL and downburst wind loading
Analysis and interpretation was carried out by T.G. Mara. Each component of this chapter
was completed under the supervision of H.P. Hong, with input from T.C.E. Ho. The
manuscript for Chapter 4 was prepared by T.G. Mara and modifications were completed
under the supervision of H.P. Hong, and with the input of C.-S. Lee and T.C.E. Ho. A paper
co-authored by T.G. Mara, H.P. Hong, C.-S. Lee and T.C.E. Ho has been submitted for
v
downburst loading
Analysis and interpretation was carried out by T.G. Mara under the supervision of H.P.
Hong. The manuscript for Chapter 5 was prepared by T.G. Mara and modifications were
completed under the supervision of H.P. Hong. A paper co-authored by T.G. Mara and H.P.
Hong is included in the Proceedings of the 3rd Specialty Conference on Disaster Prevention
and Mitigation, 2013 CSCE Annual Conference.
Chapter 6: Effect of wind direction on the response and capacity surface of a
transmission tower
Analysis and interpretation was carried out by T.G. Mara under the supervision of H.P.
Hong. The manuscript for Chapter 6 was prepared by T.G. Mara and modifications were
completed under the supervision of H.P. Hong. A paper co-authored by T.G. Mara and H.P.
Hong has been submitted for potential publication in a peer-reviewed journal.
vi
Acknowledgments
First and foremost, I would like to thank Dr. H.P. Hong, who has acted as a supervisor for
this work as well as a mentor in the field of academia. His guidance, advice and patience
throughout the completion of this thesis, as well as other endeavors, is much appreciated, and
I am grateful to him for providing the opportunity to work on a variety of interesting
engineering projects.
During my time at Western I have been lucky enough to be surrounded by great friends,
colleagues, collaborators, and mentors. It would be near to impossible to compile a complete
list of these important people in my life, but as I reflect on the previous four years, some
names are worth particular mention. Dr. Eric Ho has acted as a mentor in the field of wind
engineering for many years now, and I am grateful to him for discussion on research ideas,
reading and offering feedback on my work, and providing the opportunity to get involved in
various projects. The crew at the BLWTL, particularly Darren Garnham, Peter Case, Steve
Farquhar, Gerry Dafoe and Anthony Burggraaf have assisted in various parts of my
experimental work, in addition to being great friends. Conversations with Dr. Nicholas
Isyumov, Dr. Jon Galsworthy and Dr. Barry Vickery have greatly contributed to my
approach to research, and I am grateful for their input and willingness to get involved in
various aspects of my work. Lastly, I’d like to acknowledge Dr. David Gatey for many great
conversations on wind and everything else, whether over a coffee or single malt.
The financial support from the National Sciences and Engineering Research Council of
Canada (NSERC) is gratefully acknowledged for supporting me personally, as well as a
number of the projects with which I have been involved. I also acknowledge the financial
support received from the University of Western Ontario throughout the duration of my
program.
Finally, I am extremely thankful to my family for providing the moral (and occasionally
financial) support to complete this degree. Their unwavering support throughout my life has
been extraordinary, and I am grateful that they have provided the opportunity and means to
vii
Dedication
viii
Table of Contents
Abstract ... ii
Co-Authorship Statement... iv
Acknowledgments... vi
Dedication ... vii
Table of Contents ... viii
List of Tables ... xii
List of Figures ... xiii
Nomenclature ... xvi
Preface... xxi
Chapter 1 ... 1
1 Introduction ... 1
1.1 Experimental and analytical techniques ... 2
1.1.1 Wind tunnel testing ... 2
1.1.2 Nonlinear static pushover analysis ... 3
1.1.3 Incremental dynamic analysis ... 3
1.2 Objective of thesis... 3
1.3 Organization of thesis ... 4
1.3.1 Experimental investigation of lattice section aerodynamics ... 4
1.3.2 Comparison of capacity assessment methods for a lattice transmission tower ... 5
1.3.3 Capacity of a transmission tower under ABL and downburst wind loading ... 6
1.3.4 Effect of relative orientation on the capacity of a transmission tower under downburst loading ... 6
1.3.5 Effect of wind direction on the response and capacity surface of a transmission tower ... 7
1.4 Research highlights ... 7
1.5 References ... 8
Chapter 2 ... 10
2 Experimental investigation of lattice section aerodynamics ... 10
2.1 Aerodynamics of cross-arm sections ... 11
2.1.1 Background ... 11
ix
2.1.4 Wind tunnel test results and discussion ... 19
2.1.5 Comparison of experimental data to design criteria ... 22
2.1.6 Conclusions and recommendations... 30
2.2 Influence of solid area distribution on the drag coefficient of lattice frames ... 32
2.2.1 Background ... 32
2.2.2 Wind tunnel experiment ... 35
2.2.3 Results and discussion ... 38
2.2.4 Conclusions and recommendations... 43
2.3 Summary of experimental work ... 45
2.4 Acknowledgements ... 46
2.5 References ... 46
Chapter 3 ... 50
3 Comparison of capacity assessment methods for a lattice transmission tower ... 50
3.1 Introduction ... 51
3.2 Analysis procedure, modeling and wind load ... 52
3.2.1 Nonlinear static pushover analysis ... 52
3.2.2 Incremental dynamic analysis ... 53
3.2.3 Model of a transmission tower ... 54
3.2.4 Modeling and application of wind loads ... 54
3.3 Comparison IDA and NSP capacity curves ... 63
3.4 Conclusions ... 71
3.5 References ... 72
Chapter 4 ... 74
4 Capacity of a transmission tower under ABL and downburst wind loading ... 74
4.1 Introduction ... 74
4.2 Modeling of the transmission tower, ABL wind loads and effects ... 78
4.2.1 Numerical model of transmission tower ... 78
4.2.2 Loads under synoptic wind ... 82
4.2.3 Capacity curves for ABL and rectangular wind ... 83
4.2.4 Uncertainty propagation analysis ... 90
4.3 Downburst wind loads ... 92
x
4.4 Capacity curves for downburst wind loading ... 98
4.4.1 Capacity curves from transient and NSP analyses ... 98
4.4.2 Sensitivity of capacity curves to downburst parameters ... 100
4.5 Conclusions ... 103
4.6 Acknowledgements ... 105
4.7 References ... 105
Chapter 5 ... 108
5 Effect of relative orientation on the capacity of a transmission tower under downburst loading ... 108
5.1 Introduction ... 108
5.2 Modeling of transmission tower and wind loads ... 110
5.2.1 Numerical model of transmission tower ... 110
5.2.2 Wind load provisions in codes ... 111
5.2.3 Downburst wind loads ... 113
5.3 Capacity curves for the transmission tower ... 116
5.3.1 Capacity curves using the NSP method ... 116
5.3.2 Capacity curves for downburst wind profiles ... 117
5.4 Conclusions ... 123
5.5 Acknowledgements ... 124
5.6 References ... 124
Chapter 6 ... 126
6 Effect of wind direction on the response and capacity surface of a transmission tower ... 126
6.1 Introduction ... 126
6.2 Modeling of the transmission tower and wind loads ... 129
6.2.1 Numerical model of transmission tower ... 129
6.2.2 Wind loads specified in CSA-2010... 132
6.2.3 Application of wind loads to the tower model ... 133
6.3 Capacity curves and surfaces for the tower under ABL and rectangular wind profiles ... 138
6.3.1 Effect of wind direction on the capacity curve ... 138
6.3.2 Capacity surfaces and comparison to the capacity surface under downburst wind load ... 143
xi
6.6 References ... 150
Chapter 7 ... 152
7 Conclusions and Recommendations ... 152
7.1 Summary ... 152
7.2 Conclusions ... 154
7.2.1 Experimental investigation of lattice section aerodynamics ... 154
7.2.2 Comparison of capacity assessment methods for a lattice transmission tower ... 157
7.2.3 Capacity of a transmission tower under ABL and downburst wind loading ... 157
7.2.4 Effect of relative orientation on the capacity of a transmission tower under downburst loading ... 159
7.2.5 Effect of wind direction on the response and capacity surface of a transmission tower ... 160
7.3 Recommendations for future work ... 161
7.4 References ... 163
Copyright Permissions ... 164
xii
List of Tables
Table 2.1. Geometric and aerodynamic parameters for MH Type A402 HVDC guyed tower
for the a) transverse plane and b) longitudinal plane. The parameters for the major cross-arm
(Panel 6) appear in bold. ... 16
Table 2.2. List of experimental configurations for the 2-D frame. ... 37
Table 3.1. a) Nominal section properties of the structural members of the tower and wires and b) structural steel distribution by panel. ... 55
Table 3.2. Tabulation of values for use of CSA-2010 for the transmission tower... 62
Table 4.1.a) Nominal section properties of the structural members of the tower and wires, b) structural steel distribution by panel, c) nominal section properties of the conductors, and d) properties and uncertainty associated with structural steel. ... 80
Table 4.2.a) Nominal wind load calculated using CSA-2010 for the tower shown in Figure 3.1 and b) nominal wind load calculated using CSA-2010 for the conductor. ... 84
Table 4.3. Yield and maximum capacities and corresponding wind speed for the tower in the longitudinal and transverse directions. ... 87
Table 4.4. Statistics of tower capacity under longitudinal and transversal loading (based on 50 simulations). ... 90
Table 4.5. Ratios of yield and maximum capacities (kN) under downburst wind loading to those associated ABL and rectangular wind profiles. ... 103
Table 6.1. a) Nominal section properties of the structural steel member of the tower and wires, b) structural steel distribution by panel and c) nominal section properties of the conductors. ... 131
Table 6.2. Tabulation of values for use of CSA-2010 for transmission tower. ... 134
Table 6.3. Calculated wind loads using CSA-2010 for oblique wind directions. ... 135
Table 6.4. Loads and critical wind speeds for ABL and rectangular wind profiles. ... 136
xiii
List of Figures
Figure 2.1. Sign convention for lattice transmission towers. ... 12
Figure 2.2. Elevation views of MH Type A402 HVDC guyed tower showing each design
plane. ... 17
Figure 2.3. Cross-arm model shown in wind tunnel at a) 0° (transverse), b) 45°, and c) 90°
(longitudinal)... 18
Figure 2.4. Experimental drag coefficients for cross-arm at orthogonal directions compared
to previous work and code values. ... 20
Figure 2.5. Experimental effective drag decomposed into the transverse and longitudinal
directions. ... 22
Figure 2.6. Net effective drag for the cross-arm based on parameters in Table 2.1 using
codes and experimental data. ... 25
Figure 2.7. Transverse effective drag for the cross-arm based on parameters in Table 2.1
using codes and experimental data. ... 26
Figure 2.8. Longitudinal effective drag for the cross-arm based on parameters in Table 2.1
using codes and experimental data. ... 26
Figure 2.9. Transverse effective drag for the cross-arm showing modified IEC calculation of
wind loads. ... 28
Figure 2.10. Comparison of the ASCE vector resultant approach to the existing (orthogonal)
ASCE-74 approach. ... 29
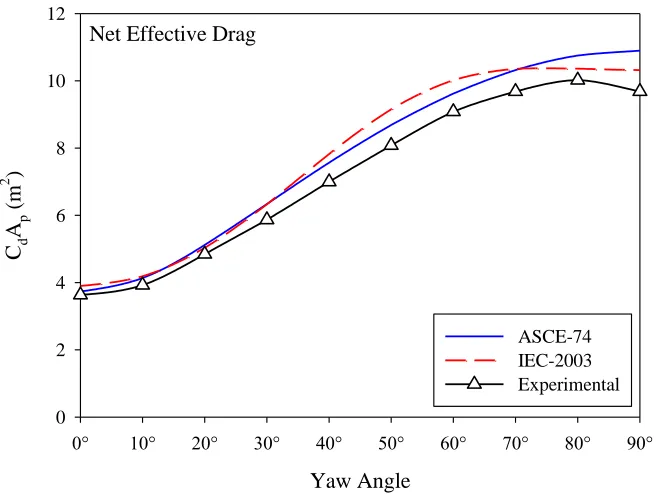
Figure 2.11. Effective drag as calculated using ASCE-74 (blue) and IEC-2003 (red). ... 30
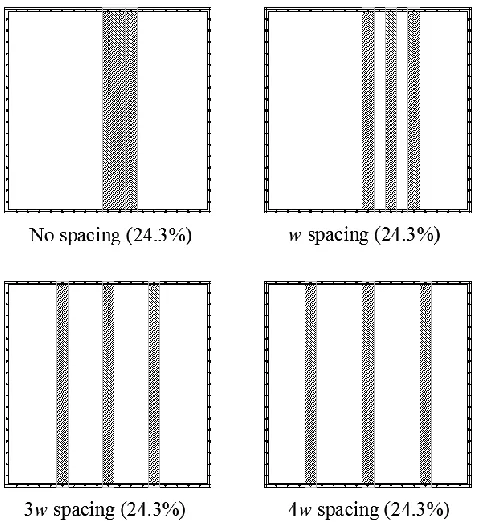
Figure 2.12. Examples of configurations with consistent solidity ratio of 24.3% (clockwise
from top left: configurations 3, 19, 35, 31). ... 36
Figure 2.13. Photo of 2-D frame in the wind tunnel (configuration 30 shown). ... 38
Figure 2.14. Mean drag force as a function of solidity ratio for various member spacing
ratios. ... 39
Figure 2.15. Drag coefficient as a function of solidity ratio for various member spacing
ratios. ... 40
Figure 2.16. Drag coefficient as a function of number of adjacent members for various
member spacing ratios. ... 42
Figure 3.1. Force-deformation or capacity curve for an inelastic system. ... 53
Figure 3.2. Self-supported transmission tower: a) 3-D isometric and plan view, and b)
definition of panels for application of wind loads. ... 55
Figure 3.3. Mode shapes and frequencies of the numerical tower model (carried out in
ANSYS®). ... 57
Figure 3.4. Simulated time histories for a) wind at 10 m and 46.9 m (tip of tower) heights for
xiv
Figure 3.6. Results of the NSP analysis showing a) capacity curves for each wind direction
and b) trajectory of tip displacement for each wind direction. ... 64
Figure 3.7. Comparison of IDA and NSP capacity curves for transverse direction. ... 65
Figure 3.8. Comparison of IDA and NSP capacity curves for longitudinal direction. ... 67
Figure 3.9. Comparison of IDA and NSP capacity curves for wind at 45°. ... 68
Figure 3.10. Capacity curves for 9 IDA and the NSP method for the longitudinal direction. 70 Figure 3.11. Comparison of IDA capacity curves based on 1-minute and 5-minute time histories. ... 71
Figure 4.1. Transmission tower: a) 3-dimensional view, b) definition of loading panels according to code-based design procedure. ... 79
Figure 4.2. Mode shapes and frequencies of the analytical tower model. ... 81
Figure 4.3. Force-deformation or capacity curve for an inelastic system. ... 85
Figure 4.4. Capacity curves for ABL and rectangular wind distributions in a) longitudinal direction, b) transverse direction... 88
Figure 4.5. Capacity curves resulting from uncertainty analysis (50 simulations) for the structural properties of the tower for ABL wind distribution in the a) longitudinal direction, and b) transverse direction. ... 91
Figure 4.6. Elevation plot showing the parameters in the numerical downburst simulation (downburst outflow profile is scaled to r/Djet = 1.3, Djet = 500m). ... 93
Figure 4.7. Variation of horizontal velocity wind profiles with a) Djet, and b) r/Djet. ... 94
Figure 4.8. Horizontal outflow velocity time history at various heights in a downburst outflow. ... 95
Figure 4.9. Time history of the total applied horizontal force due to downburst passage varying with a) effect of Djet in the longitudinal direction, b) effect of r/Djet in the longitudinal direction, c) effect of Vjet in the longitudinal direction, d) effect of Djet in the transverse direction, e) effect of r/Djet in the transverse direction, f) effect of Vjet in the transverse direction. ... 97
Figure 4.10. Force-deformation curves for transient downburst passage with varying Vjet and results from NSP method for a) longitudinal direction, and b) transverse direction. ... 99
Figure 4.11. Capacity curve showing the a) effect of Djet in the longitudinal direction, b) effect of r/Djet in the longitudinal direction, c) effect of Djet in the transverse direction, d) effect of r/Djet in the transverse direction. ... 101
Figure 5.1. Self-supported transmission tower in a) isometric elevation view and b) plan view. ... 111
Figure 5.2. Elevation view of tower showing downburst touchdown and outflow (outflow profile is scaled relative to downburst having Djet = 500 m). ... 113
xv
downburst profiles used in the analysis. ... 115
Figure 5.5. Example capacity curve for a nonlinear inelastic system. ... 116
Figure 5.6. Capacity curves for selected wind directions for a) downburst scenario 1, b)
downburst scenario 2 and c) downburst scenario 3. ... 118
Figure 5.7. Variation with wind direction of a) yield capacity and b) tip displacement... 121
Figure 5.8. Capacity curves for the transverse and longitudinal wind directions showing
variation with Djet. ... 122
Figure 6.1. Details of transmission tower: a) Isometric and plan views, and; b) definition of
loading panels for code-based design. ... 130
Figure 6.2. Transverse, longitudinal and resultant wind loads for the transmission tower as
calculated with CSA-2010. ... 137
Figure 6.3. Force-deformation (capacity) curve for an inelastic system showing equal energy
method... 139
Figure 6.4. Capacity curves and direction of resultant total applied horizontal force and
corresponding tip deflection for a) ABL wind profile, and b) rectangular wind profile. ... 140
Figure 6.5. 3-D plot of capacity surface of the tower under a) ABL wind profile and b)
rectangular wind profile. ... 144
Figure 6.6. 3-D plot of capacity surface of the tower interpolated from capacity curve subset
(wind at 0°, 50°, and 90°) under ABL wind profile (lower surface) and rectangular wind profile (upper surface)... 145
Figure 6.7. 3-D plot of capacity surface for ABL (orange) and rectangular (grey) wind
profiles compared with a) downburst with jet diameter of 500 m (green) and b) downburst with jet diameter of 1000 m (green). Capacity surface for ABL wind profile is shown as the lower surface, the downburst capacity surface is shown as the middle surface, and the
rectangular capacity surface is shown as the upper surface. ... 147
Figure 6.8. 3-D plot of capacity surface for ABL (orange) and rectangular (grey) wind
xvi
Nomenclature
The nomenclature used throughout the thesis is listed by chapter as follows (code specific
values for Chapter 2 are indicated in parenthesis):
Chapter 2
Agross gross area of a lattice frame
Aml net area of the longitudinal face (ASCE-74)
Amt net area of the transverse face (ASCE-74)
Anet net area of a lattice frame
Ap projected area of a frame subject to wind load
At total wind loading on the panel in the direction of the wind (N) (IEC-2003)
B arbitrary constant (B = γwQKzKztV2 Gt1) (ASCE-74)
Cd drag coefficient of a lattice frame
Cfl drag coefficient of the longitudinal face (ASCE-74)
Cft drag coefficient of the transverse face (ASCE-74)
Cxt1 drag coefficient of face 1 (IEC-2003)
Cxt2 drag coefficient of face 2 (IEC-2003)
D arbitrary constant (D = qoGt2) (IEC-2003)
Fd drag wind load
Fd´ vector resultant wind force (ASCE-74)
Fl longitudinal wind force (ASCE-74)
Fl´ longitudinal component of vector resultant wind force (ASCE-74)
Ft transverse wind force (ASCE-74)
Ft´ transverse component of vector resultant wind force (ASCE-74)
FL(ψ) longitudinal wind force at yaw angle ψ
FT(ψ) transverse wind force at yaw angle ψ
Gt1 gust response factor for the tower (ASCE-74)
Gt2 combined wind factor (IEC-2003)
Kz wind pressure exposure factor (ASCE-74)
Kzt wind pressure topographic factor (ASCE-74)
Q numerical constant (ASCE-74)
xvii t2
V wind speed at the height of a frame or panel
qo dynamic wind pressure at reference height (IEC-2003)
ϕ solidity ratio of a lattice frame
θ yaw angle of wind (measured from transverse face) (IEC-2003)
ρ density of air
ψ yaw angle of wind (measured from the transverse face) (ASCE-74)
γw importance factor for wind load (ASCE-74)
CdAp effective drag of a lattice frame (m2)
Chapter 3
At total wind loading on the panel in the direction of the wind (N)
Ac total load on the line (N)
drag coefficient of a section
Cxc drag coefficient of the line
Cxti drag coefficient for the corresponding i-th face
exponential decay coefficient
( ) Davenport coherence function
( ) fluctuating drag force at height z and time t
GL span factor based on the length of the span
Gc combined wind factor for the line
Gt combined wind factor for the tower panel
( ) longitudinal turbulence intensity at height z
L wind span of the wires (m)
( ) power spectral density function of longitudinal turbulence (Kaimal)
̅̅̅̅̅̅ mean wind speed at 10 m height
( )
̅̅̅̅̅̅ mean wind speed at height z
Vref arbitrary reference mean wind speed
d diameter of the line (m)
frequency of longitudinal turbulence (Hz)
time interval for ARMA algorithm
xviii
α power law coefficient
moving average (MA) coefficient with order p
autoregressive (AR) coefficient with order q
μ density of air
( ) normalized fluctuating wind speed (zero mean, unit variance)
θ yaw angle of wind (measured from transverse direction)
ρ density of air
τ air density correction factor
Chapter 4
At total wind loading on the panel in the direction of the wind (N)
Ac total load on the line (N)
Cxc drag coefficient of the line
Cxti drag coefficient for the corresponding i-th face
Djet jet diameter of simulated downburst (m)
GL span factor based on the length of the span
Gc combined wind factor for the line
Gt combined wind factor for the tower panel
L wind span of the wires (m)
Vjet jet velocity of simulated downburst (m/s)
VR reference wind speed
V3s,10m 3-second gust wind speed at height of 10 m
V10-min,10m 10-minute mean wind speed at height of 10 m
Vhor horizontal wind speed resulting from downburst
d diameter of the line (m)
r distance from downburst to point of interest
ts downburst simulation time scale parameter
Ω angle between the wind direction and the wires
α power law coefficient
μ density of air
xix
Chapter 5
At total wind loading on the panel in the direction of the wind (N)
Ac total load on the line (N)
Cxc drag coefficient of the line
Cxti drag coefficient for the corresponding i-th face
Djet jet diameter of simulated downburst (m)
GL span factor based on the length of the span
Gc combined wind factor for the line
Gt combined wind factor for the tower panel
L wind span of the wires (m)
Sti total surface area projected normally on the corresponding i-th face (m2)
Vhor horizontal wind speed resulting from downburst
Vjet jet velocity of simulated downburst (m/s)
VR reference wind speed
d diameter of the line (m)
i any point along conductor span between towers
r distance from downburst to point of interest
Ω angle between the wind direction and the wires
α power law coefficient
μ density of air
θ yaw angle of wind (measured from transverse direction)
τ air density correction factor
Chapter 6
At total wind loading on the panel in the direction of the wind (N)
Ac total load on the line (N)
Cxc drag coefficient of the line
Cxti drag coefficient for the corresponding i-th face
Djet jet diameter of simulated downburst (m)
GL span factor based on the length of the span
xx t
L wind span of the wires (m)
Sti total surface area projected normally on the corresponding i-th face (m2)
V3s,10m 3-second gust wind speed at height of 10 m
V10min,10m 10-minute mean wind speed at height of 10 m
V10min,10m,MAX 10-minute mean wind speed at height of 10 m resulting in collapse
V10min,10m,YLD 10-minute mean wind speed at height of 10 m resulting in yield
Vhor horizontal wind speed resulting from downburst
Vjet jet velocity of simulated downburst (m/s)
VR reference wind speed
d diameter of the line (m)
r distance from downburst to point of interest
z height above ground (m)
Ω angle between the wind direction and the wires
α power law coefficient
μ density of air
θ yaw angle of wind (measured from transverse direction)
xxi
Preface
The portions of the experimental data presented in Chapter 2 dealing with cross-arm lattice
sections were collected during the author’s Masters degree at the University of Western
Ontario. However, the focus of the thesis (Mara 2007) was not on the comparison of wind
tunnel data to recommended wind loading equations, but rather the aerodynamics of the
section under inclined winds (i.e., downbursts). The difference between accepted
expressions for wind loads on cross-arm sections and those measured experimentally has
recently become an interest of the author, primarily due to his involvement in the committee
charged with the updating of ASCE Manual No. 74: Guidelines for Electrical Transmission
Line Structural Loading (ASCE 2010). The comparisons and recommendations presented
here have not yet appeared in publication and were not included in the author’s Masters
thesis. However, access and interpretation of the experimental data provided the grounds for
selecting the analytical wind loads applied in Chapters 3 through 6, and are therefore
included in this thesis. The experimental work comprising the second portion of Chapter 2
was carried out independently by the author in order to further investigate differences
observed between experimental and codified drag coefficients. As a result, Chapter 2 is an
amalgamation of two papers; the first addresses the drag coefficient of cross-arm lattice
sections, while the second addresses the relationship between the drag coefficient and
solidity ratio (Mara 2013).
References
ASCE. (2010). Guidelines for electrical transmission line structural loading. ASCE Manuals
and Reports on Engineering Practice No. 74 (3rd edition), ASCE, New York, USA.
Mara, T.G. (2007). “The effects of multi-directional winds on lattice sections.” M.E.Sc.
Thesis, University of Western Ontario.
Mara, T.G. (2013). “Influence of solid area distribution on the drag of a 2-D lattice frame.” J.
Chapter 1
1
Introduction
Transmission towers play a vital role in society as components of electrical transmission
networks and distribution systems. Specifications for wind loads on transmission
structures are provided in the design codes Canadian Standards Association (CSA) C22.3
No. 60826-10 (referred to herein as CSA-2010) (CAN/CSA 2010) and the ANSI National
Electric Safety Code (NESC) (ANSI 2006), as well as recommended in ASCE Manual
No. 74: Guidelines for Electrical Transmission Line Structural Loading (referred to
herein as ASCE-74) (ASCE 2010). Many transmission and distribution companies also
have proprietary load and resistance criteria. CSA-2010 adopts the International
Electrotechnical Commission (IEC) Standard 60826:2003 (IEC 2003) for design criteria
of overhead transmission lines. These codes and guidelines assume a linear elastic
response under wind loading and do not discuss the inelastic behavior of transmission
structures. As a result, nonlinear inelastic analysis of transmission towers is not
frequently carried out in design practice, but becomes necessary for the assessment of
ultimate behavior and structural reliability of the tower under wind load.
A large number of transmission line failures throughout the world have been attributed to
high intensity winds (HIW) (e.g., Dempsey and White 1996, McCarthy and Melsness
1996, Li 2000). The design methodology provided in current wind loading codes and
guidelines is pertinent to, and has been developed based on, synoptic wind events
characterized by typical atmospheric boundary layer (ABL) winds. That is, parameters
which describe the wind profile with height and quantify effects of turbulence (i.e., gusts)
may not provide a proper description of the wind loading conditions under HIW such as
downburst, thunderstorm gust fronts or tornadoes. The assessment of tower designs
under HIW loading is therefore of great interest for both new and existing structures.
This thesis investigates the nonlinear inelastic response of transmission towers under
synoptic wind and HIW loading and provides a comparison of the tower capacities (i.e.,
transmission tower design is modeled in the structural analysis software ANSYS®
(ANSYS 2007), which is selected due to its handling of nonlinear material properties and
3-D numerical simulation capability. The analysis considers both material and geometric
nonlinearity. A comparison is made between two methods for nonlinear inelastic
analysis, the nonlinear static pushover (NSP) method and incremental dynamic analysis,
and it is shown that an adequate approximation of the capacity curve of the tower can be
obtained using the NSP method. Capacity curves for different wind loading conditions at
many directions to the tower are obtained, and are used to develop the capacity surface of
the tower.
1.1
Experimental and analytical techniques
As this thesis is prepared in Integrated Article format, detailed descriptions of the
experimental and analytical techniques are provided in their corresponding chapters.
Brief descriptions of the experimental and analytical techniques used in the thesis are
provided in the following subsections.
1.1.1
Wind tunnel testing
Due to the complexity of wind flow through lattice sections, the majority of wind loading
provisions in codes and guidelines have been derived from wind tunnel data. Through
wind tunnel experimentation, the aerodynamic coefficients (i.e., drag and lift coefficients)
can be properly assessed and used to assist in the design of prototype structures. One
challenge that exists for reduced-scale experiments with lattice sections is the physical
size of the members, which often prohibits testing of an entire structure (i.e., an entire
transmission tower). As a result, wind tunnel tests are often limited to sections of the
overall structure. The section model which is discussed in Chapter 2 corresponds to the
cross-arm portion of a lattice transmission tower, and is carried out at a scale of 1:10.
The choice of this scale allows for the details of the angled steel to be properly
represented, which is an important feature for geometric similarity. The second
experiment is parametric, and does not directly relate to a prototype structure. The wind
tunnel testing components of the thesis were carried out in Tunnel I and Tunnel II at the
1.1.2
Nonlinear static pushover analysis
The primary analysis procedure used in this thesis is the nonlinear static pushover (NSP)
method, which has most commonly been used for the evaluation of the nonlinear inelastic
response of structures to earthquake-induced ground motion (Krawinkler and Seneviratna
1998). The NSP method is used to evaluate the nonlinear force-deformation relation and
identify the yield and maximum capacity of a structure by monotonically increasing the
applied forces while maintaining a constant loading profile. The results are presented as
capacity curves, which relate the total applied horizontal force on the structure (which is
equal to the base shear if inertia forces are negligible) to the deflection of the tip of the
tower. As the NSP method is an approximate method, a comparison is first carried out to
the incremental dynamic analysis, which considers the time history of the response of a
structure under dynamic loading.
1.1.3
Incremental dynamic analysis
The incremental dynamic analysis (IDA) method is commonly used in earthquake
engineering to assess the inelastic behavior and capacity of structures under seismic
excitation (Vamvatsikos and Cornell 2002). The application of IDA for wind loading
differs slightly from its application for earthquake loading, and is described in detail by
Banik et al. (2010). Through the IDA method for wind loading, time histories of the
maximum total base shear force and corresponding tip displacement are obtained, and
these values are used to develop the capacity curve of the tower under ABL wind loading.
The resulting capacity curves are compared to those obtained using the NSP method
described earlier.
1.2
Objective of thesis
As mentioned earlier, current design for transmission towers under wind loading is often
carried out based on the elastic response to traditional ABL winds. This procedure has
two shortcomings: i) that the inelastic behavior of transmission towers affects their
capacity; and ii) that wind loads deviating from ABL winds likely result in different load
effects. The former is of interest if reliability analysis of either point structures or
towers and the assessment of existing towers for HIW loading. The objectives of the
thesis are summarized as follows:
Assess the relationship of drag load to angle of attack for unique lattice sections,
and compare with existing wind loading expressions.
Provide guidelines for the future investigation of lattice section aerodynamics
which may expand the definition of the drag coefficient to include geometric
characteristics in addition to the solidity ratio.
Develop the capacity curve for the transmission tower under ABL wind loading for two nonlinear inelastic structural analysis methods and compare the results.
Obtain the capacity curve, as well as identify the yield and maximum capacities,
of the transmission tower under ABL and downburst wind loading.
Quantify the uncertainty of the calculated capacities, based on the uncertainty of
the structural materials, and compare it to that associated with extreme wind
loads.
Develop capacity surfaces of the transmission tower under different types of wind
loading from various directions.
1.3
Organization of thesis
This thesis is prepared in Integrated Article format. A description of the impetus and
objective for each chapter are provided in the following sections.
1.3.1
Experimental investigation of lattice section aerodynamics
Relatively little experimental work has been carried out on lattice towers in comparison
to other structures such as tall buildings or bridges. Even fewer studies have been
directed at unique sections, such as cross-arms or bridges of transmission towers, for
which the definition of the drag coefficient (based on solidity ratio) in wind loading codes
tower are used to illustrate the behavior of the drag coefficient with angle of attack (yaw
angle), and differences are noted between the data and the loading expressions for yawed
wind in ASCE-74 (ASCE 2010). The expressions for yawed wind in CSA-2010 are
shown to provide a better estimate of the wind loads for the cross-arm section for yawed
winds. Thus, the CSA-2010 expressions for wind loading are applied to the numerical
transmission tower analysis carried out in subsequent chapters. A significant difference
between the drag coefficient measured experimentally and those recommended by codes
is observed for the longitudinal face, which is attributed to the non-uniform solid area
distribution of the cross-arm geometry. To further investigate this aspect, wind tunnel
tests are carried out for a parametric 2-D lattice frame which shows that the drag
coefficient may not be fully described by the solidity ratio. While additional work needs
to be carried out in this regard, the results of the study identify the important parameters
and provide guidelines for the progression of research.
1.3.2
Comparison of capacity assessment methods for a lattice
transmission tower
Through a comparison of the NSP and IDA methods for a 2-D numerical model of a
transmission tower carried out by Banik et al. (2010), it was shown that the NSP method
is sufficient for the estimation of the capacity curve of the tower. Moreover, it was
shown that the capacity curves obtained through the NSP analysis are representative of
the peak wind load effects on the structure. In this chapter, comparisons are made
between the NSP and IDA methods for a 3-D numerical model of a transmission tower,
which includes the effects due to vertical coherence in the wind. It is shown that the NSP
method provides an adequate approximation of the capacity curve of the tower compared
to the IDA method, and that the duration of the time history used for the IDA has little
effect on the resulting capacity curve for the time intervals considered. The NSP method
is employed for the estimation of the transmission tower capacity in the subsequent
1.3.3
Capacity of a transmission tower under ABL and downburst
wind loading
Current design codes for lattice transmission structures contain very limited advice on the
treatment of HIW, and structural design is often carried out using wind load profiles and
response factors derived for ABL winds. Due to the paucity of full-scale HIW data, the
structural engineering community has turned to numerical simulations of these events to
aid in the assessment and design of structures. Downburst configurations resulting in the
peak wind speeds on the transmission tower are identified and extracted from a numerical
simulation of a stationary downburst carried out by Hangan et al. (2003), and are used to
assess the capacity curve of the transmission tower under downburst wind loading. The
capacity curves obtained through the NSP analysis are compared to the time history
response of the tower under a transient downburst passage, and are shown to agree well.
The capacity curve of the tower under downburst wind loading is shown to remain
relatively consistent under various downburst sizes, and the capacity curves for the
transverse and longitudinal directions under various downburst scenarios are shown to be
approximately bound by the capacity curves for a rectangular wind loading profile and an
ABL wind loading profile. An uncertainty propagation analysis is carried out, based on
the simple Monte Carlo technique considering material and geometric uncertainty, which
indicates that the coefficient of variation of the tower yield capacity is small compared to
those associated with extreme wind speeds.
1.3.4
Effect of relative orientation on the capacity of a transmission
tower under downburst loading
The wind loads on a transmission tower vary significantly with wind direction due to
both the geometry of the tower and the contribution of the wires. Based on the findings
which indicate that the capacity curves in the transverse and longitudinal wind directions
are approximately bound by the rectangular and ABL wind profiles on the upper and
lower bound, respectively, the analysis is extended to consider wind at oblique directions.
While this is relatively straightforward for the ABL and rectangular winds, the
application of the downburst wind field to the tower model is more complex. The
compared, and it is shown that the capacity of the tower varies with both wind direction
and size of downburst. The methods used for the application of the simulated downburst
wind field to the numerical tower model are discussed, and it is shown that the capacity
curves obtained for downburst wind loading are similar in behavior with the exception of
very small downburst events.
1.3.5
Effect of wind direction on the response and capacity surface
of a transmission tower
The wind loads on a transmission tower vary significantly with wind direction due to
both the geometry of the tower and the contribution of the wires. The NSP method is
used to obtain the capacity curves for 11 wind directions under ABL and rectangular
wind loading, and it is shown that the yield and maximum capacities of the tower vary
with wind direction. The deformation trajectories are projected on the horizontal plan for
each wind direction, and it is shown that they do not overlap for closely spaced directions
(i.e., 10°). As the deformation trajectories are sufficiently smooth, it is suggested that the
capacity curves obtained for the individual wind directions can be used to form the
capacity surface of the transmission tower. Capacity surfaces for the tower are developed
for the ABL and rectangular wind profiles, and it is shown that they do not intersect. It
was previously shown that the capacity curves for the transverse and longitudinal wind
directions under ABL and rectangular wind profiles can provide approximate bounds to
the capacity curves obtained for downburst wind loading. To confirm that this conjecture
holds for oblique wind directions, the capacity surfaces for three downburst scenarios are
developed and compared to those for ABL and rectangular wind profile. Except in the
case of very small downbursts, the capacity surfaces developed for the rectangular and
ABL wind profiles are shown to envelope those for the downburst wind profiles.
1.4
Research highlights
Contributions to the field of design and analysis of transmission towers are summarized
below:
Experimental data describing the relationship of drag force to angle of attack for a
agreement with the wind load expressions in CSA-2010 (CSA 2010) than for
those in ASCE-74 (ASCE 2010).
Experimental data which shows the relationship between solid area distribution
and the drag coefficient of a 2-D lattice frame are presented, which suggests that
current definitions of the drag coefficient (which are purely based on the solidity
ratio) should be further developed for use with unique lattice sections such as
cross-arms and bridges.
A comparison of the IDA and NSP methods for obtaining the force-deformation
relationship of a structure is carried out, which shows that the capacity curves
obtained by the NSP analysis provide an adequate approximation of those
obtained by the IDA method.
The NSP method is used to develop the capacity curve of a transmission tower
under ABL, rectangular and downburst wind loading, which indicates that the
capacity curve under downburst is approximately enveloped by those obtained for
ABL and rectangular winds.
The NSP method is used to develop the capacity curves of a transmission tower
for many wind loading directions, and the curves are used to develop the capacity
surface for the tower.
The capacity surfaces resulting for ABL and rectangular wind load profiles are
shown to approximately envelope that for downbursts of typical size.
1.5
References
ANSYS® (2007). ANSYS Multiphysics, Release 9.0. ANSYS Inc., Canonsburg, PA.
ANSI. (2006). National Electrical Safety Code. ANSI C2. IEEE, Piscataway, NJ.
ASCE. (2010). Guidelines for electrical transmission line structural loading. ASCE
Manuals and Reports on Engineering Practice No. 74 (3rd edition), ASCE, New York,
Banik, S.S., Hong, H.P. and Kopp, G.A. (2010). “Assessment of capacity curves for
transmission line towers under wind loading.” Wind Struct., 13(1), 1-20.
Canadian Standards Association (CSA) (2010). Design criteria of overhead transmission
lines. CAN/CSA-C22.3 No. 60826-10, CSA, Toronto, Canada.
Dempsey, D. and White, H.B. (1996). “The cause of most transmission structure outages
in the world is high intensity winds.” Transmission and Distribution World, 48(6), 32-42.
Hangan, H., Roberts, D., Xu, Z. and Kim, J.-D. (2003). “Downburst simulations.
Experimental and numerical challenges.” Proc. of the 11th International Conference on
Wind Engineering, Lubbock, TX, USA.
International Electrotechnical Commission (IEC) (2003). Design criteria of overhead
transmission lines. IEC Standard 60826:2003, 3rd edition.
Krawinkler, H. and Seneviratna, G.D.P.K. (1998). “Pros and cons of a pushover analysis
of seismic performance evaluation.” Eng. Struct., 20(4-6), 452-464.
Li, C.Q. (2000). “A stochastic model of severe thunderstorms for transmission line
design.” Prob. Eng. Mech., 15(4), 359-364.
McCarthy, P. and Melsness, M. (1996). “Severe weather elements associated with
September 5, 1996 hydro tower failures near Grosse Isle, Manitoba, Canada.”
Environment Canada, Winnipeg, Canada.
Vamvatsikos, D. and Cornell, C.A. (2002). “Incremental dynamic analysis.” Earthquake
Chapter 2
2
Experimental investigation of lattice section
aerodynamics
The drag coefficient of a lattice frame is a fundamental parameter for the calculation of
the resulting wind loads. While values for the drag coefficient of most bluff bodies have
been well-established in the literature, those for lattice frames have been less examined.
One of the primary reasons for this is that the interaction of wind with lattice sections is
more complex than that for a bluff body. A 3-D lattice frame is often considered to have
a windward face and a leeward face; the interaction of the wind as it passes through the
windward face significantly affects the drag force on the leeward face. This mechanism
is referred to as shielding, and is, for all intents and purposes, impossible to assess
analytically. As a result, wind tunnel testing has played a large role in the development
of expressions for the drag coefficient of 3-D lattice frames. In wind design codes, the
specified drag coefficient is based solely on the solidity ratio, although different
expressions are provided for sections comprised of flat-sided or round members; this is
the case for both 2-D and 3-D frames.
The following sections describe the findings of wind tunnel tests carried out on two
different models. The first model is a 3-D lattice frame, which represents the cross-arm
section of a guyed transmission tower, and is used to illustrate the behavior of the drag
force with yaw angle (angle of attack of the wind). The second model is a basic 2-D
frame, and is used to illustrate that the commonly-used definition for the drag coefficient
should likely be refined to consider characteristics in addition to solidity ratio. The
findings of the experimental work suggest that the existing equations in ASCE Manual
No. 74: Guidelines for Electrical Transmission Line Structural Loading (ASCE 2010a)
for yawed wind should be used with caution for the calculation of wind loads on lattice
towers, and that the drag coefficient of lattice sections should be expressed as a function
2.1
Aerodynamics of cross-arm sections
Lattice transmission towers play a crucial role in the efficient transmission of electricity
and are used throughout the world. Guyed and self-supported lattice transmission towers
are typically comprised of two unique geometries: the vertical tower body and the
horizontal conductor support cross-arm. A great deal of research has been directed at the
evaluation of aerodynamic coefficients of the compact and symmetric form often seen in
the vertical portion of the tower, however much less information is available for
cross-arm sections. Wind tunnel tests carried out on a typical cross-cross-arm design indicate that the
drag loads vary significantly with wind direction, and exhibit a relationship which differs
from the design procedure provided in ASCE Manual No. 74: Guidelines for Electrical
Transmission Tower Structural Loading (herein referred to as ASCE-74) (ASCE 2010a).
The wind tunnel data suggest that ASCE-74 does not provide a conservative design
estimate of the transverse tower loads for skewed wind directions. This is a result of the
orthogonal approach taken in ASCE-74, which calculates the transverse and longitudinal
wind loads independently. A recommendation for an alternative to the current wind load
calculation procedure in ASCE-74 is made, which is most pertinent to portions of the
tower with significantly different geometric and aerodynamic characteristics in the
transverse and longitudinal planes. While the design wind loads for the transverse
direction are quite dependent on the contributions of the wires, the wind loads on the
tower structure remain important.
2.1.1
Background
Power distribution and utility companies around the world rely on networks of towers
and conductors to efficiently transmit and distribute electrical power. Many codes,
regulations and guidelines are currently in use throughout the world. Documents
commonly referenced in North America include: ANSI National Electric Safety Code
(NESC-2006); ASCE Manual No. 74 (ASCE-74); CAN/CSA C22.3 No. 60826-10
(CSA-2010); and International Electrotechnical Commission Standard 60826:2003 (IEC-2003).
Note that CSA-2010 adopts IEC-2003 and therefore contains an identical treatment of
aerodynamics. It is acknowledged that ASCE-74 is not explicitly a code, however it is
documents are herein referred to as codes. The design of transmission towers, lines and
components depend on a large number of variables including: system demand; local
geography, topography and obstacles; local wind climate; local potential for ice
accretion; geometric design options for the tower structure; and political boundaries.
Many of these variables are clearly beyond the control of the designer due to
environmental or political reasons. The discussion in this chapter is limited to the wind
loads on the tower structure, with particular focus on the aerodynamics of the cross-arm
section used for the support of conductors in guyed or self-supported lattice transmission
towers.
The wind loads on transmission towers are often interpreted as loads in the transverse
(perpendicular to the conductors) and longitudinal (parallel to the conductors) directions.
While no wires, conductors or otherwise, are considered in this section, the wind loading
of the tower is referenced using this terminology. The angle of the wind with respect to
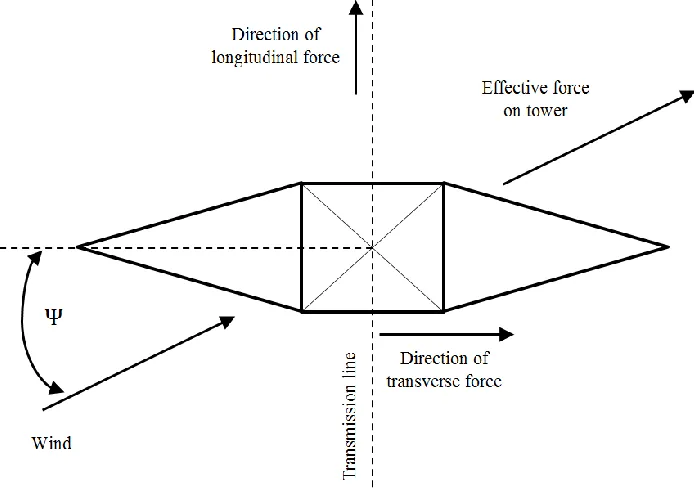
the tower is referred to as the yaw angle, which is taken as 0° for wind in the transverse
direction and 90° for wind in the longitudinal direction. This sign convention is shown in
Figure 2.1 and is consistent with that used in ASCE-74.
The variation of wind loads on the tower structure with respect to yaw angle, with
particular focus on the contribution of the cross-arm section, are discussed in this chapter.
While a great deal of research has been directed at the evaluation of the aerodynamic
coefficients (i.e., drag coefficient) of 3-D lattice frames which are either square or
triangular in plan, very few studies involving other geometries commonly used in tower
design (i.e., cross-arms, bridges) have been carried out. In the case of guyed or
self-supported towers, these are the cross-arms used for conductor support. In delta
configurations, these types of configurations are found in the bridge of the tower. The
application of code-specified drag coefficients for these types of sections may not be
appropriate, as the provided drag coefficients, and their implied use in the codes, are
based on the notion that: i) the sections have similar geometric and aerodynamic
parameters in the transverse and longitudinal planes; ii) the sections have similar aspect
ratios (about the plan view) in the transverse and longitudinal planes; and iii) that the
distribution of member area within a representative section is relatively uniform. While
the latter is often true for bridge sections of a delta configuration, neither cross-arms nor
bridges conform to the former two criteria. As it will be seen, this has implications on
the calculation of the wind load in the transverse and longitudinal directions, the extent of
which vary depending on the design approach taken.
Wind tunnel tests were carried out to assess the drag coefficient of the cross-arm section
of a prototype tower design as a component of a larger research initiative (see Hangan et
al. 2008). Very little aerodynamic data pertaining solely to the assessment of the drag
coefficient for a cross-arm section are available in the literature. Only two studies
involving unique lattice sections could be found in the literature: de Oliveira e Silva et al.
(2006) presents wind tunnel data for various sections of delta towers, and Mara et al.
(2010) presents experimental data for a tower cross-arm under inclined winds. It was
concluded by de Oliveira e Silva et al. (2006) that the IEC-2003 expression was sufficient
for the description of wind loads on the investigated sections. In the following chapter,
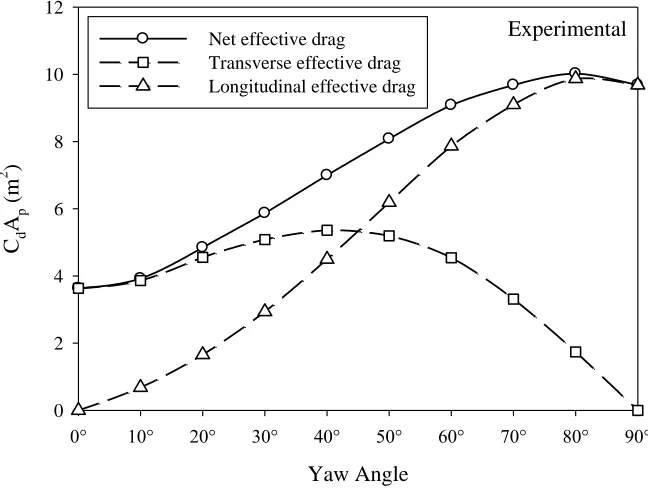
experimental data are expressed as the net drag on the cross-arm, as well as decomposed
into drag in the transverse and longitudinal directions. The results are compared to the
relationship of wind load with yaw angle in ASCE-74 and IEC-2003. It is shown that the
procedure in IEC-2003, which accounts for wind loads arising from differences in the
transverse and longitudinal aspect ratios. It is recommended that the IEC-2003 method,
or a modified procedure of the calculation of wind loads using existing expressions in
ASCE-74, be used for the calculation of wind loads on these types of sections (or
preferably for the entire tower). It is acknowledged that for some tower designs the wind
load contribution from the cross-arm section may be small in relation to the overall loads
on the tower, although this ratio will vary among tower designs (Mara and Ho 2011).
2.1.2
Aerodynamics of lattice sections
The basic calculation of the drag wind load, Fd, on a lattice section is
Fd = 0.5 ρV2CdAp (2.1)
where ρ is the density of air, V is the wind speed at the height of the section, Cd is the
drag coefficient and Ap is the projected area subject to wind load. In most wind design
codes, the drag coefficient for a lattice frame or tower section is specified as a function of
solidity ratio, ϕ,
ϕ = Anet / Agross (2.2)
where Anet and Agross are the net and gross areas of the face of a frame or tower section.
Early investigations of the force coefficients of lattice frames were focussed on the
assessment of wind loads on bridge trusses or girders (Flachsbart 1932, Biggs 1954,
Pagon 1958). At the time of these experiments, it was generally accepted that a
relationship existed between the solidity ratio and the drag coefficient, and drag force
data were often obtained at full scale. The relationship between the drag coefficient and
solidity ratio for single trusses proposed by Pagon (1958) remained in the ANSI Standard
until 1982 (ANSI 1982), although much of the design work for lattice towers remained
on an ad hoc basis. As accessibility to wind tunnel laboratories increased and more
experiments could be carried out at reduced scales, studies which extend beyond a single
or double truss emerge in the literature. Sykes (1981) and Bayar (1986) found similar
(1978), Sykes (1981) and Bayar (1986) carried out wind tunnel tests on 3-D lattice
trusses and towers, investigating aerodynamic coefficients, shielding and turbulence
effects. de Oliveira e Silva et al. (2006) tested multiple delta configurations to assess the
IEC-2003 expression for yawed winds on complex sections; the findings indicated that
the IEC-2003 expression was adequate. The effect of shielding for lattice frames was
also assessed via building frames by Georgiou and Vickery (1979), Whitbread (1979) and
Kopp et al. (2010). Mara et al. (2010) investigated the behaviour of the drag coefficient
of 3-D frames under winds having significant vertical components (i.e., downbursts,
thunderstorm gust fronts). Comparison between model-scale and full-scale wind tunnel
test data for a triangular 3-D lattice tower section was made by Mara and Galsworthy
(2011), which showed good agreement between measurements of the drag coefficient at
model- and full-scale.
The majority of these experiments, as well as others in the literature, have focussed on
sections which are relatively symmetric about both planes of loading (i.e., similar
geometric and aerodynamic characteristics, as well as aspect ratio, in the transverse and
longitudinal planes), and have a relatively uniform distribution of solid area throughout
the section. These conditions are indeed representative of the majority of sections
comprising most lattice tower designs, however they are not applicable to cross-arm or
bridge geometries. In the following sections, the differences which arise between the
wind tunnel data for the cross-arm model and the wind loads calculated using ASCE-74
and IEC-2003 are discussed.
2.1.3
Wind tunnel experiment
Many challenges exist when attempting model-scale experimentation on lattice sections,
primarily due to the physical size and detailing of the members. This aspect has
contributed to a relatively small amount of wind tunnel data for lattice sections available
in the literature when compared to those available for buildings and other structures. The
scarcity of published data may also be attributed to the proprietary nature of the utility
Following a series of transmission tower failures under high intensity winds (see
McCarthy and Melsness 1996), a research initiative was commenced by Manitoba Hydro
(MH) to better understand the wind effects on transmission structures (Hangan et al.
2008). For the wind tunnel testing component, static models were built for the evaluation
of the drag coefficient of a cross-arm section under inclined winds (Mara 2007). A
model of a MH Type A402 HVDC guyed tower cross-arm was constructed using angled
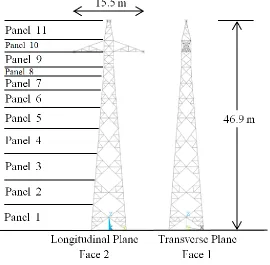
brass sections at a scale of 1:10. An elevation view of the entire tower is shown in Figure
2.2, in which the modeled cross-arm corresponds to Panel 6. The geometric and
aerodynamic parameters for each panel are listed in Table 2.1. All member connections
were soldered and rigid. Cross-section widths of the angle members ranged from 5.5 mm
to 9.5 mm, and were scaled directly from the prototype design. The particular tower
design considered has two cross-arms; the cross-arm which was modeled represents the
major arm that supports the weight of the conductors, rather than the minor
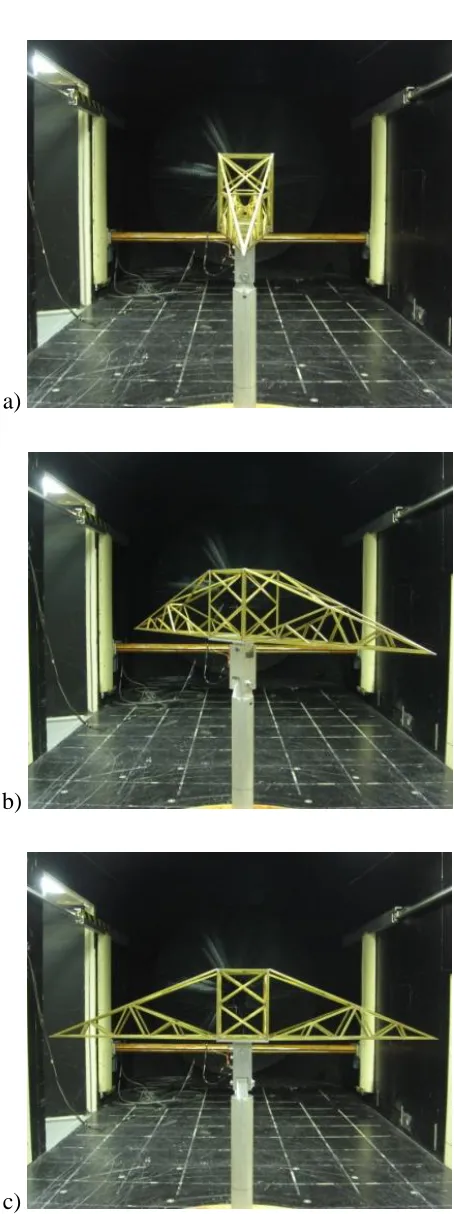
cross-arm used for the guy connections. The model was mounted on a strut in order to elevate
the cross-arm above the boundary layer on the tunnel floor. The wind load accumulated
by the strut was consistent among all test configurations, and was treated as a tare
subtraction from the overall measurement of the drag force. The cross-arm model is
shown installed in the wind tunnel at yaw angles 0°, 45° and 90° in Figure 2.3.
Table 2.1. Geometric and aerodynamic parameters for MH Type A402 HVDC guyed
tower for the a) transverse plane and b) longitudinal plane. The parameters for the major
cross-arm (Panel 6) appear in bold.
a)
Panel Total Area (m2) Net Area (m2) Height (m) Solidity Cd (ASCE) Cd (IEC)
1 5.12 1.15 3.05 0.23 2.90 2.77
2 14.95 1.93 10.55 0.13 3.42 3.23
3 14.72 2.3 19.38 0.16 3.27 3.08
4 14.03 2.52 27.95 0.18 3.16 2.99
5 5.04 1.51 33.36 0.30 2.54 2.50
6 3.84 2.07 36.25 0.54 1.80 1.88