Optimal Allocation of SVC for Enhancement
of Voltage Stability Using Harmony Search
Algorithm
K.Jyotshna Devi1, N.Madhuri2
Assistant Professor, Dept of EEE, SVPCET, Puttur, Andhra Pradesh, India1
PG Student, Dept of EEE, SVPCET, Puttur , Andhra Pradesh , India2
ABSTRACT: In this paper, a meta-heuristic optimization technique known as Harmony Search Algorithm is used to
determine the optimal location and size of static Var compensator (SVC) in a transmission network. The demand for electricity is increasing day-by-day and is giving rise to voltage instabilility problems. voltage stability status in a stressed Power system could be improved with effective reactive power compensation and it can be achieved by significant use of SVC. A multi-objective optimization problem is defined to minimize real power losses, improve the voltage profile and reduce L-index. Here L-index is used to find the critical buses in the system for optimal location of shunt connected FACTS controller known as Static Var Compensator(SVC). Harmony Search Algorithm (HSA) is applied to find the optimal sizes of SVC for solving Multiobjective optimization problem. Simulations are performed on IEEE 14-bus and IEEE 30-bus test systems.The results for base case and 125% overloading cases show that the optimal location and sizing of SVC minimizes real power losses, improves voltage profile and reduces L-index.
KEYWORDS: Meta-heuristic, Voltage stability, SVC, L-index, Harmony search algorithm, Multi-objective
optimization.
I. INTRODUCTION
In this paper SVC is used for shunt compensation. It is a shunt-connected Static VAR Generator or absorber whose output is adjusted to exchange capacitive or inductive current so as to provide voltage support. It can also reduce power losses in the system when it is installed in a proper location. Here L-index is used to find the weak bus in the system to place the SVC device and it is also for Voltage Stability analysis. L-index gives scalar number to each load bus. This index value ranges from 0 (no load system) to 1(Voltage collapse). The bus with highest L-index value will be the weakest bus in the system and hence this method helps in identifying the weak load bus which need critical reactive power support. Minimization of L-index is also one of the objectives of the optimization problem. A Meta-Heuristic algorithm Known as HSA is proposed to find the optimal sizes of SVC for objective of optimization such as Minimization of Real power loss, and Improvement of Voltage profile.
II.BACKGROUND
In the earlier decades several meta heuristic optimization algorithm have been introduced. These algorithms are principally inspired by nature analogy. Due to the applicability in the bulk range of problem, all the algorithms are also called as general purpose approaches. There are several optimization techniques such as Evolution strategies (ES)-1965, Genetic algorithm (GA)-1975,
Simulated annealing (SA)-1983, Ant colony optimization (ACO)-1992, Particle swarm optimization (PSO)-1995, Harmony search algorithm (HSA)-2001, Bee colony optimization (BCO)-2004, Gravitational search algorithm (2009)
Harmony search algorithm
Geem et.al discovered Harmony search algorithm in 2001. Harmony search algorithm is a Meta heuristic technique which is inspired by musical performance process. HS optimization techniques works as a musical appliance which are played to obtain the ideal harmony between the components which are involved in the process for ideal solution. It is based on rules and unpredictability to emulate natural phenomena. Another benefit is that both types of functions discontinuous and continuous can be considered by HS algorithm, because it does neither require differential gradients nor initial value setting for variables. HSA is totally divergence free and also escape local optima.
Sirjani et.al was implemented improved harmony search algorithm to find the optimal location and sizing of SVC with the objective of voltage profile enhancement and reduction in power system losses. The effectiveness of proposed algorithm was checked on IEEE-30 bus test system. The results have been compared with PSO techniques for similar optimal solution then it was found that performance of IHS was better as compared to PSO.
Sanjari et.al implemented HSA to obtain the ideal location of shunt fact devices in the smart grid to improve voltage stability. SVC was considered as the compensation devices. The effectiveness of proposed techniques was checked on IEEE-14 bus test system. Result shows an enhancement of voltage profile and maximization in voltage collapse margin.
Kazemi et.al proposed an algorithm based on harmony search to find the optimal location of FACTS devices with the objective of power system security enhancement. Three types of FACTS-TCSC, SVC and UPFC were considered. Simulation results were checked on IEEE-30 bus test system and it was found that power system security has been improved by optimal placement of FACTS devices. These results were also compared with GA for similar optimal solution but harmony search algorithm has superior performance as compared to GA
III.PROBLEM STATEMENT
The main objective function of this paper is to find the optimal rating of SVC for objective optimization. This is mathematically stated as [16]-[18]:
Minimize F= [f1, f2, f3] (1) Where f1 represents the real power losses as
And f3 is the L-index of the jth bus and is given by:
The minimization problem is subject to the following equality and inequality Constraints:
i) Load Flow Constraints:
(ii) Voltage constraints:
(iii) Reactive Power Generation Limit:
(iv) Reactive Power Generation
(v)Transformer Tap setting limit:
(vi)Transmission line flow limit:
IV. SVC IDEAL MODELLING
Fig 1: Equivalent steady-state circuit of svc
Fig 2: circuit diagram of svc connected to an infinite bus
From Fig.1, the current drawn and reactive power injected By the SVC can be expressed as:
The reactive power generated by an SVC is given by
V. VOLTAGE STABILITY INDEX
In [21], Kessel et al. was developed a voltage stability index based on the solution of the power flow equation. The L-index is a quantitative measure for the estimation of the distance of actual state of the system stability limit. It describes the stability of the complete system. Voltage stability index Lj for any load bus can be defined as given in equation (13)
VI. POWER SYSTEM VOLTAGE STABILITY
At any point of time, a power system operating condition should be stable, meeting various operational criteria, and it should also be secure in the event of any credible contingency. Present day power systems are being operated closer to their stability limits due to economic and environmental constraints. Maintaining a stable and secure operation of a power system is therefore a very important and challenging issue. Voltage instability has been given much attention by power system researchers and planners in recent years, and is being regarded as one of the major sources of power system insecurity. Voltage instability phenomena are the ones in which the receiving end voltage decreases well below its normal value and does not come back even after setting restoring mechanisms such as VAR compensators, or continues to oscillate for lack of damping against the disturbances. Voltage collapse is the process by which the voltage falls to a low, unacceptable value as a result of an avalanche of events accompanying voltage instability . Once associated with weak systems and long lines, voltage problems are now also a source of concern in highly developed networks as a result of heavier loading.
Harmony Search Algorithm
The harmony search algorithm (HSA) is a new meta-heuristic algorithm [22] – [23] inspired by the operation of orchestra music to find the best harmony between components which are involved in the operation process, for optimal solution. It is simple in concept from natural musical performance processes. The musicians starting with some discrete musical notes based on player experience so finally HSA gives optimum value.
Algorithm to Find Optimal Sizes of Svc Using Harmony Search Algorithm
Step 1: Initialize all the parameters and constants of the Harmony search algorithm. They are QSVCminimum and QSVC maximum, hms, HMCR, PARmin and PARmax.
Step 2: Run the load flow program and find the total real power loss of the original system.
Step 3: Initialize the harmony memory i.e., generates [hms x n] number of initial solutions randomly within the limits, where hms is the harmony memory size and n is the number of static var compensators (SVC).
Step 4: obtain the loss reduction (fitness value) using equation (14)Fitness Value = Minimize F= [f1, f2, f3] (14)Repeat the same procedure for all the rows of the harmony vector to find Fitness values and obtain the best fitness value by comparing all the fitness values.
Step 5: Start the improvisation and iteration count is set to one.
Step 6: Improvisation of the New Harmony is generating a new harmony. A New Harmony vector is generated based on the following steps:
(i) Random selection: It is used to select one value randomly for a certain element of the new vector from the possible range (Qsvcmin, Qsvc max) of values.
(ii) Memory consideration: It is used to choose the value for a certain element of the new vector from the specified HM range.
xi=x'i_{x'1,x'2,…x HMS
i } with probability HMCR (15) x'i_ xi with probability (1-HMCR) (16)
Step 7: Pitch adjustment: It is used to adjust the values of the New Harmony vector obtained in step7. (Between PARmin and PARmax). (bw - band width varies between a higher value and a lower value from first iteration to last iteration)x'i=x'i±rand(0,1)*bw (17)
Step 8: Find the fitness values corresponding to the New Harmony generated and pitch adjusted insteps 6 and 7. Step 9: Apply Greedy Search between old harmony and New Harmony by comparing fitness values.
Step 10: Update harmony memory, by replacing the worst harmony with the new best Harmony. Obtain the best fitness value by comparing all the fitness values.
Step 11: The improvisation (iteration) count is incremented and if iteration count is not reached maximum then go to step 7.
VII. RESULTS AND DISCUSSION
IEEE 14 bus system [24] contains 5 generator buses (bus numbers: 1,2,3,6 and 8), 9 load buses (bus numbers: 4, 5, 7,9,10,11,12,13 and14) and 20 transmission lines including 3 transformers The details of the system data including 3 transformer nominal values are given in [24].The load has been increased from normal load by125% for IEEE 14-bus test system. As the load on the system increases L-index, real power losses at load buses also increases. The results of the corresponding are shown in tables 1- 4.However L-Index is used to find the Weak buses in the system to find the optimal location of Static VAR Compensator (SVC). When the load on the system increases buses 9 and 14 has more L-index and so these buses are the best locations to place the SVC. A Meta-heuristic algorithm known as Harmonic search Algorithm is used to find the optimal size of SVC to achieve objectives. And finally when The SVC devices are placed at the buses 9 and 14 with optimal sizes and the corresponding results such as real power loss, voltage Profile and L-index with different loading Conditions are shown in tables 1-4.
IEEE 30 bus system contains 6 generator buses (bus numbers: 1,2,5,8,11 13), 24 load buses (bus numbers:3, 4, 6, 7, 9,10,12,14,15,16,17,18,19,20,21,22,23,24,25,26,27,28,29,30) and 41 transmission lines including 4 transformers. The load has been increased from normal load by125% for IEEE 30-bus test system. As the load on the system increases L-index, real power losses at load buses also increases. The results of the corresponding are shown in tables 5-8.However L-Index is used to find the Weak buses in the system to find the optimal location of Static VAR Compensator (SVC). When the load on the system increases buses 7 and 26 has more L-index and so these buses are the best locations to place the SVC. A Meta-heuristic algorithm known as Harmonic search Algorithm is used to find the optimal size of SVC to achieve objectives. And finally when The SVC devices are placed at the buses 7 and 26 with optimal sizes and the corresponding results such as real power loss, voltage Profile and L-index with different loading Conditions are shown in tables 5-8.
Table: 1 Results Of The IEEE 14 Bus Test Systems
LOADING CONDITION REAL POWER LOSS WITHOUT SVC SVC OPTIMAL LOCATION HSA
RATING OF SVC
REAL POWER LOSS WITH SVC NORMAL
LOADING
13.3934 9
14
24.5573 6.9526
13.3336
125% LOADING 22.7259 9
14
36.1120 8.9587
22.1941
150% LOADING 35.5578 9
14
61.9958 15.2668
34.3739
175% LOADING 51.61 9
14
106.7474 15.6894
49.6396
200% LO ADING 70.8595 9
14
134.3521 19.2670
68.9691
Table: 2 L-Index and Voltage Profiles At Basecase And 125% Loading
BASE CASE LOADING 125% LOADING
BUS NO WITHOUT SVC WITH SVC WITHOUT SVC WITH SVC
L-INDEX VOLTAGE L-INDEX VOLTAGE L-INDEX VOLTAGE L-INDEX VOLTAGE
1 0.0000 1.0600 0.0000 1.0600 0.0000 1.0600 0.0000 1.0600
2 0.0000 1.0450 0.0000 1.0450 0.0000 1.0250 0.0000 1.0350
3 0.0000 1.0100 0.0000 1.0100 0.0000 0.9800 0.0000 1.0000
4 0.0116 1.0183 0.0115 1.0198 0.0123 0.9883 0.0118 1.0079
5 0.0020 1.0200 0.0020 1.0211 0.0021 0.9926 0.0021 1.0097
7 0.0000 1.0608 0.0000 1.0659 0.0000 1.0302 0.0000 1.0623
8 0.0000 1.0900 0.0000 1.0900 0.0000 1.0700 0.0000 1.0900
9 0.0123 1.0541 0.0120 1.0642 0.231 1.0176 0.1920 1.0635
10 0.0061 1.0495 0.0060 1.0579 0.0066 1.0119 0.0061 1.0554
11 0.0038 1.0561 0.0038 1.0604 0.0040 1.0213 0.0038 1.0583
12 0.0084 1.0550 0.0084 1.0572 0.0090 1.0204 0.0084 1.0540
13 0.0106 1.0501 0.0105 1.0542 0.0113 1.0139 0.0106 1.0502
14 0.0248 1.0343 0.0240 1.0521 0.369 0.9925 0.241 1.0483
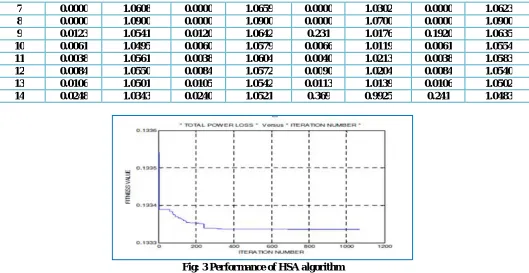
Fig: 3 Performance of HSA algorithm
Table 3: Results of the IEEE 30 bus test system
Loading condition
Real power loss Without SVC
SVC optimal location
HSA
Rating of SVC Real power loss with
SVC
Normal Loading 17.5985
7 26
28.3797
4.1207 17.5482
125% Loading 30.3738
7 26
55.0686
5.2598 29.6083
150% Loading 47.2228
7 26
75.3181
6.8942 46.3663
175% Loading 69.3379
7 26
57.2011
11.3811 68.2022
200% Loading 96.5636
7 26
58.3231
10.7663 94.6174
TABLE 4: L-INDEX AND VOLTAGE PROFILES AT BASE CASE AND 125% LOADING
BASE CASE LOADING 125% LOADING
BUS NO
WITHOUT SVC WITH SVC WITHOUT SVC WITH SVC
L-INDEX
VOLTAGE
L-INDEX
VOLTAGE
L-INDEX
VOLTAGE
L-INDEX
VOLTAGE
2 0 1.0430 0 1.0430 0 1.0130 0 1.0330
3 0.0009 1.0215 0.0008 1.0238 0.0009 0.9936 0.0009 1.0126
4 0.0013 1.0129 0.0013 1.0157 0.0014 0.9803 0.0013 1.0033
5 0 1.0100 0 1.0100 0 0.9600 0 1.0100
6 0 1.0121 0 1.0152 0 0.9773 0 1.0058
7 0.0128 1.0034 0.0128 1.0053 0.0140 0.9596 0.0123 1.0234
8 0 1.0100 0 1.0100 0 0.9800 0 1.0000
9 0 1.0510 0 1.0738 0 1.0212 0 1.0429
10 0.0013 1.0444 0.0012 1.0606 0.0014 1.0079 0.0013 1.0317
11 0 1.0820 0 1.0820 0 1.0720 0 1.0820
12 0.0048 1.0574 0.0047 1.0648 0.0050 1.0298 0.0048 1.0483
13 0 1.0710 0 1.0710 0 1.0610 0 1.0710
14 0.0087 1.0424 0.0085 1.0564 0.0093 1.0096 0.0089 1.0296
15 0.0043 1.0378 0.0042 1.0488 0.0046 1.0028 0.0044 1.0239
16 0.0039 1.0447 0.0038 1.0558 0.0041 1.0112 0.0040 1.0321
17 0.0063 1.0391 0.0061 1.0539 0.0067 1.0020 0.0064 1.0251
18 0.0028 1.0279 0.0028 1.0409 0.0031 0.9887 0.0029 1.0112
19 0.0048 1.0253 0.0046 1.0394 0.0052 0.9845 0.0049 1.0076
20 0.0012 1.0293 0.0012 1.0439 0.0013 0.9894 0.0013 1.0126
21 0.0039 1.0321 0.0038 1.0478 0.0042 0.9918 0.0040 1.0168
22 0 1.0327 0 1.0482 0 0.9925 0 1.0178
23 0.0044 1.0272 0.0043 1.0391 0.0047 0.9871 0.0045 1.0119
24 0.0099 1.0216 0.0096 1.0345 0.0108 0.9772 0.0102 1.0066
25 0 1.0189 0 1.0282 0 0.9728 0 1.0143
26 0.0191 1.0012 0.0187 1.0107 0.0212 0.9495 0.0187 1.0120
27 0 1.0257 0 1.0327 0 0.9814 0 1.0192
28 0 1.0107 0 1.0137 0 0.9751 0 1.0029
29 0.0062 1.0059 0.0061 1.0131 0.0069 0.9550 0.0064 0.9939
30 0.0319 0.9945 0.0314 1.0017 0.0357 0.9397 0.0329 0.9793
Fig 4: Performance of HSA algorithm for IEEE 30-bus system base case loading
VIII. CONCLUSION
REFERENCES
[1]. P.Kundur, Power system Stability and control, Newyork: McGraw-Hill, 1994.
[2]. IEEE/CIGRE, Joint taskforce on stability and Definitions, “Definition and classification of power system stability”, IEEE transactions so power system”, vol.19, no.2, pp.1387-1401, May 2004.
[3]. Dubson, H.D.chiang, “Towards a theory of Voltage collapse in electric power systems, Systems and control letters, Vol.13, pp.253-262, 1989
[4]. T.V.cutsem, “Voltage instability: phenomena, counter measures and analysis methods”, proceedings of IEEE, Vol.88, pp.208- 227, Feb, 2000.
[5]. C.W.Taylor, Power system voltage stability, Newyork: McGraw-Hill 1994.
[6]. N.G. Hingorani, L. Gyugyi, and Understanding FACTS: Concepts and Technology of Flexible AC Transmission Systems, New York, IEEE Press, 2000.
[7]. C.A.Canizares, Z.T.faur, “Analysis of SVC and CSC Controllers in Voltage collapse, IEEE Transactions on power systems, vol.14, no.1, February 1999, pp.158-165.
[8]. Sode-Yome and N.Mithulanathan, “comparison of Static voltage stability margin Enhancement” International journal of Engineering Education, UMIST, Vol.41, no.3, july2004.
[9]. Claudia Reis, and F.P.Maciel Barbosa, “A comparison of Voltage stability indices”, IEEEmelcon 2006, may, 16-19, Benalmadena (Malaga),Spain.
[10]. Venkataramana Ajjarapu and Colin cristy, “The continuation power flow: A tool for steady state voltage stability analysis.”, IEEE Transactions on Power systems, vol.7, no.1, pp.416-423, 1992.
[11]. J.G.Sing, S.N.singh, S.C.Srivastava, “Placement of FACTS controllers for enhancing power system load ability”, in proceedings of IEEE Power India Conference, 2006, pp.10-17.
[12]. S.Gerbex, R.Cherkaoui, A.J. Germond, “optimal location of FACTS devices to enhance power System security”, in proceedings of the IEEE power tech conference, 2003, Bologna,vol.3, pp.1-7.
[13]. F.Jurado, J.A. Rodriguez, “optimal location of SVC based on system load ability and contingency analysis”, in proceedings of the emerging Technologies Factory automation Conference, 1999, vol.2, pp.1193-1199.
[14]. D.Thukaram, Abraham Lomi, Selection of static VAR Compensator Location and Size for System Voltage Stability Improvement, Electric Power Systems Research, Vol.54, 2000.
[15]. S.Durairaj, Devaraj and P.S.Kannan, Improved Genetic Algorithm Approach for Multi objective Contingency Constrained Reactive Power Planning, IEEEIndicon 2005 Conference
[16]. Chennai, Dec 2005.
[17]. M.Gitizadeh M.kalantar, A Novel Approach for optimum Allocation of FACTS Device susing Multi- objective Function, Journal of Energy Conversion and Management 2009,pp- 682-690.
[18]. M.Senthil Kumar, Dr.P.RenugaD.Prasad, A Bacterial foraging based Multi-Objective Reactive Power Planning, International Journal of Applied Engineering Research, New delhi, Vol .4, No.8, 2009 pp 1413-1422.
[19]. C.S.Chang, J.S.Huang, Optimal Multi objective SVC Planning for Voltage Stability Improvement, IEE Proc-Gener.Trans.Distrib vol.145, no.2 March 1998, pp 203-209.
[20]. R. Minguez, F. Milano, R. Zarate-Mifiano, "Optimal Network Placement of SVC Devices,"IEEE Trans. on Power Systems, Vo1.22, No.4, Nov. 2007.
[21]. M.Saravanan, S.MaryRajaSlochanal, P.Venkatesh, Prince Stephen Abraham, “Application of particle swarm optimization Technique for optimal location of FACTS devices considering cost of installation and system load ability”, Elsvier, Electric Power Systems Research (2007)276–283, April 18th, 2006.
[22]. P. Kessel.H. Glavitsch, “Estimating the voltage stability of Power system”, IEEETransactions on power Delivery, Vol. pwrd-1, No.3, july1986.
[23]. Z. W. Geem, J. H. Kim and G. V. Loganathan. 2001. A new heuristic optimization algorithm: harmony search. Simulation. 76(2): 6068. [24]. R. SrinivasaRao. 2010. A Hybrid Approach for Loss Reduction in Distribution System using Harmony Search Algorithm. International
Journal of Electrical and ElectronicsEngineering.4: 7.
BIOGRAPHY
K.Jyotshna Devi. She received the B.Tech (Electrical and Electronics Engineering) degree from the Jawaharlal Nehru
Technological University, Anantapur in 2011 and M.Tech (Power Electronics & Electrical Drives) from Jawaharlal Nehru Technological University, Anantapur. She is currently working as assistant professor in the the Dept. of Electrical and Electronic Engineering, S.V.P.C.E.T,Puttur Her area of interest in the field of power electronic converters, Electrical machines and Electric Drives.
N.Madhuri. She received the B.Tech (Electrical and Electronics Engineering) degree from the Jawaharlal