University of New Orleans University of New Orleans
ScholarWorks@UNO
ScholarWorks@UNO
University of New Orleans Theses and
Dissertations Dissertations and Theses
Fall 12-20-2017
Hydrodynamic Controls on the Morphodynamic Evolution of
Hydrodynamic Controls on the Morphodynamic Evolution of
Subaqueous Landforms
Subaqueous Landforms
Timothy L. Nelson
Follow this and additional works at: https://scholarworks.uno.edu/td
Part of the Geology Commons, and the Geomorphology Commons
Recommended Citation Recommended Citation
Nelson, Timothy L., "Hydrodynamic Controls on the Morphodynamic Evolution of Subaqueous Landforms" (2017). University of New Orleans Theses and Dissertations. 2425.
https://scholarworks.uno.edu/td/2425
This Thesis is protected by copyright and/or related rights. It has been brought to you by ScholarWorks@UNO with permission from the rights-holder(s). You are free to use this Thesis in any way that is permitted by the copyright and related rights legislation that applies to your use. For other uses you need to obtain permission from the rights-holder(s) directly, unless additional rights are indicated by a Creative Commons license in the record and/or on the work itself.
Hydrodynamic Controls on the Morphodynamic Evolution of Subaqueous
Landforms
A Thesis
Submitted to the Graduate Faculty of the
University of New Orleans
in partial fulfillment of the
requirements for the degree of
Master of Science
in
Earth and Environmental Sciences
by
Timothy Lawrence Nelson
B.S. University of North Carolina at Chapel Hill, 2013
ii
iii
Acknowledgements
iv
Table of Contents
List of Figures ... vi
List of Tables ... x
Abstract ... xi
Chapter 1 ... 1
Introduction ... 1
Objective ... 10
Key Hypothesis ... 10
Research Questions ... 11
Regional Study Area ... 11
Chapter 2 ... 14
Xbeach Methods ... 14
Initial Conditions ... 14
Model Setup and Forcing ... 15
Simulations ... 15
Delft3d Methods ... 17
Initial Conditions ... 17
Model Setup and Forcing ... 20
Simulations ... 20
Chapter 3 ... 25
Xbeach Results... 25
Ideal Morfac Setting ... 25
Extended Simulation ... 26
Raised Shoal ... 28
Tides ... 28
Offshore Events ... 29
Delft3d Results ... 29
Sediment Transport ... 29
Shoal Aggradation ... 36
Chapter 4 ... 39
v
Cross-shore Processes ... 39
Littoral Activation ... 42
Sediment Transport Patterns ... 43
Shoal Aggradation ... 49
Chapter 5 ... 58
Concluding Statements ... 58
Conclusions ... 59
Future Recommendations ... 59
References ... 61
vi
List of Figures
Figure 1: South Chandeleur shorelines 1855-1989 (adapted from Ritchie et al. 1992). ... 3
Figure 2: Average island area for the Grand Gosier and Curlew Islands 1869-2005 (adapted from Fearnley et al. 2009; 2014 data (0.2 km2) estimated from satellite images). ... 4
Figure 3: Satellite images of the observed bar development and emergence of Curlew Island (images courtesy, Google Earth). ... 4
Figure 4: Oblique aerial photograph of Grand Gosier island after emergence showing
evidence of bar welding (Morgan 2016). ... 5
Figure 5: Wind vectors, observed water levels, and flux during the passage of a cold front for several locations in Atchafalaya-Vermilion Bays. (from Feng 2009). ... 6
Figure 6: Conceptual model for the reemergence of an ephemeral barrier island following hurricane-induced reduction to subaqueous levels. ... 8
Figure 7: Shoal transect used for Xbeach simulations (Sea is left, backbarrier is right). ... 14
Figure 8: Wave height and water level for the passage of the simulated cold front. The solid black line represents a shift from offshore to onshore directed waves. ... 16
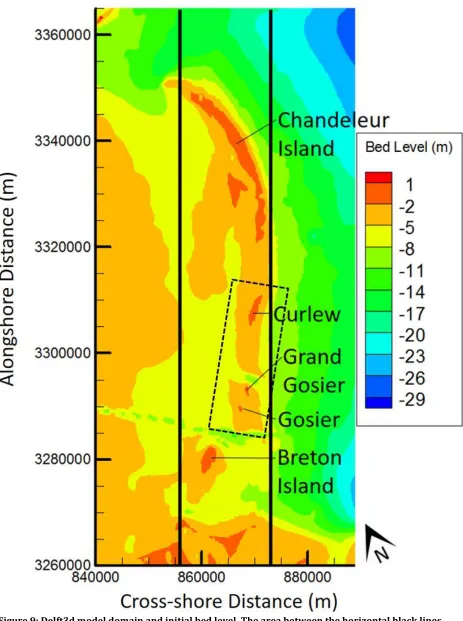
Figure 9: Delft3d model domain and initial bed level. The area between the horizontal black lines represents the region with a finer cross-shore grid resolution. The dashed box shows the section of southern shoals shown in Figure 10. ... 18
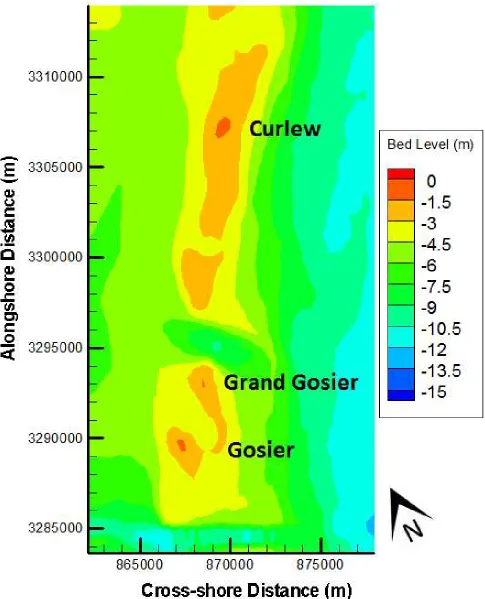
Figure 10: Initial bed level in the vicinity of the southern shoals. ... 19
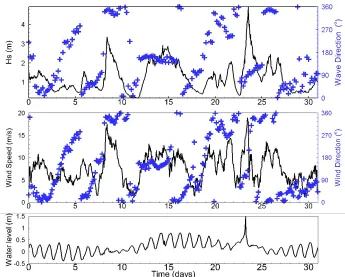
Figure 11: Unaltered wave (top), wind (middle), and water level (bottom) data for Delft3d modeling of the period of 12/17/10 to 1/17/11. ... 20
Figure 12: Altered wave and water level conditions for the four base scenarios considered in Delft3d. ... 22
Figure 13: Evolution of the crest of a shoal subjected to repeated storm and offshore events with morfac values of 1, 2, 4, and 10. ... 25
Figure 14: Shoal crest evolution for a transect subjected to 40 cycles of onshore and
offshore events (Sea is left, backbarrier lagoon is right). ... 26
Figure 15: Aggradation and translation trends for a transect subjected to 40 cycles of
vii
Figure 16: Transect evolution after raising bed levels by 1m following repeated cycles of onshore (ns) and offshore (no) events. ... 28
Figure 18: Shoal evolution when subjected to onshore events (left) and cycles of onshore and offshore events (right). ... 29
Figure 19: Mean total transport magnitudes for the entire island chain for initial and raised bed levels. Previous work suggests that a seasonally fluctuating nodal point in
sediment transport direction exists near the middle of Chandeleur Island (Ellis and Stone, 2006; Georgiou and Schindler, 2009). During the cold front season, this point shifts slightly north of the center of the island. Our results confirm the existence of this point, and, as expected for a winter storm, place it near the cold front season location. Figure 18 shows normalized mean sediment transport for the entire chain. North of the nodal point the dominant longshore transport direction is north, while sediment south of the nodal point moves south. ... 30
Figure 20: Normalized mean total transport vectors showing divergence of longshore transport opposite nodal point (blue line) for the unraised base-case scenario. ... 31
Figure 21: Sedimentation and erosion patterns for the unaltered scenario at initial and raised bed levels. ... 33
Figure 22: Sedimentation and erosion patterns for each of the four base scenarios with unraised bed levels. ... 34
Figure 23: Sedimentation and erosion patterns for each of the four base scenarios with bed levels raised by 1m. ... 35
Figure 24: Alongshore crest elevations for unraised and raised base scenario simulations using morfac values of 1 (top) and 20 (bottom). The transect starts near the MRGO channel (left) and extends to north of Curlew Shoal (right). Results from raised
scenarios have been normalized to initial bed levels. “GG” represents Grand Gosier and “G” represents Gosier. Scenarios are named xpy, where x is the base scenario, and y is the amount that bed levels have been raised. ... 37
Figure 25: Alongshore crest elevations for unraised (top) and raised scenarios 1-4 using morfac values of 1 (left) and 20 (right). The transect starts near the MRGO channel (left) and extends to north of Curlew Shoal (right). Results from raised scenarios have been normalized to initial bed levels. “GG” represents Grand Gosier and “G” represents Gosier. Scenarios are named xpy, where x is the base scenario, and y is the amount that bed levels have been raised. ... 38
viii
Figure 27: Mean total transport vectors for the southern shoals for unraised (left) and raised scenarios. ... 43
Figure 28: Normalized mean total transport for the southern shoals. Residual transport from scenarios that do not consider waves is shown in red. Residual transport from scenarios with no water level variations is shown in blue. Net transport is shown in black. ... 45
Figure 29: Transition from offshore to onshore directed wave induced transport (black) sets up convergence and divergence with water level induced transport (white) reflected in sedimentation and erosion patterns over Curlew Shoal for scenario 1 raised 1m. ... 46
Figure 30: Mean total transport, sedimentation, and erosion patterns around Gosier
(bottom) and Grand Gosier (top) Shoals. Wave induced mean total transport is shown in blue. Water level induced transport is shown in red. Net transport is shown in black. Water level induced transport values are tripled to improve visibility. ... 47
Figure 31: Observed evolution of Gosier island. Following a destructive event, the island transitions from a collar shape, to an “S” shape, to a circular shape. The island takes on a collar shape in 2001 following a destructive event. ... 49
Figure 32: Initial and final bed levels for the shallowest location on Curlew Shoal for 1m raised simulations using a morfac of 20. The horizontal blue line indicates mean water level. This occurs at -1m elevation since these are 1m raised scenarios. ... 51
Figure 33: Crest elevation change for the shallowest location on Curlew Shoal over the course of all morfac 20 simulations. Unaltered wave and water level conditions are plotted (bottom) for reference. Scenarios are named xpy, where x is the base scenario, and y is the amount that bed levels have been raised. ... 52
Figure 34: Shoal crests at the end of the second storm event showing increased landward migration in scenarios with subtidal water level variations. The horizontal blue line indicates mean water level. This occurs at -1m elevation since these are 1m raised scenarios. ... 54
Figure 35: Volume of sediment lost from shoal (above 4m isobath) and upper shoal (above 2m isobath) for the unaltered scenario with unraised, 0.5m raised, and 1m raised bed levels at a morfac of 20. Scenarios are named xpy, where x is the base scenario, and y is the amount that bed levels have been raised. ... 56
ix
x
List of Tables
Table 1: Summary of wave and water level conditions used to force all 32 runs in Delft3d. ... 24
Table 2: Total translation and aggradation at the end of the 10th set of runs with morfac values of 1, 2, 4, and 10. ... 26
Table 3:Change in aggradation and translation rates for scenarios where the storm peak coincides with high tide and low tide. ... 29
xi
Abstract
The southern Chandeleur Islands are an ideal setting to study shoal evolution given their history of submergence and re-emergence. Here, numerical models shed light on the attendant processes contributing to shoal recovery/reemergence following a destructive storm event. Simulations of a synthetic winter storm along a cross-shore profile using Xbeach shows that convergence of wave-induced sediment transport associated with repeated passage of cold-fronts initiates aggradation, but does not lead to reemergence. A Delft3d model of the entire island chain shows that as these landforms aggrade alongshore processes driven by incident wave refraction on the shoal platform, backbarrier circulation and resulting transport become increasingly important for continued aggradation and eventual emergence. Aggradation magnitudes are a function of depth ranging from 2 – 10 mm per event (onset to recovery to near mean sea level). In the absence of big storms, this modest aggradation can be more than one meter in a few years.
1
Chapter 1
Introduction
The debate over the origins of barrier islands began with the emergence theory proposed by de Beaumont (1845). He suggested that sand bars aggrade and eventually emerge above sea level. A second theory by Gilbert (1885) advocates that barrier islands formed after spits, built by longshore transport, elongated and eventually separated from the mainland after a breaching event. A third theory proposed by McGee (1890) suggests that islands formed with the drowning of low-lying areas behind beach ridges and dunes as sea levels rose and mainlands subsided. After centuries of debate, with compelling
evidence for each theory, Schwartz (1971) acknowledged that specific islands may support different theories of origin. He also noted that these three mechanisms may work together and that a combination of the theories could explain the origin of a particular island. Swift (1975) had a similar point of view, suggesting that the debate on barrier island genesis theories by observing present systems is not relevant because barriers formed well offshore at a lower sea level, and migrated to their present position through shoreface retreat. This lead to multiple regional genesis models with a focus on local conditions (Penland et al. 1988; Otvos and Giardino 2004; Simeoni et al. 2007; Otvos and Carter 2013). Penland et al.’s three stage model, for example, includes aspects of both spit detachment, and beach ridge drowning. The island itself is shaped by spit extension on both ends of a headland, but detachment from this mainland happens as a result of subsidence induced submergence following river avulsion and delta lobe abandonment.
While regional genesis models likely explain the origin of barrier island systems as a whole, there have been numerous observations of emergence of smaller barrier islands. Price (1963) observed storm induced nearshore bar development that lead to barrier island emergence with post-storm water level setdown. Since then, barrier emergence has been observed near Chesapeake Bay (Oertel and Overman 2004), North Carolina’s Outer Banks (McNinch and Wells 1999) and across the Gulf Coast (Otvos 1970, 1979, 1981, and 1984; Davis and Hine 1989; Gibbs and Davis 1991; Ritchie et al. 1992; Davis 1994; Davis et al 2003). While the necessary conditions have not been clearly defined, Otvos (1981) acknowledges that emergence requires available sand, characteristics of the hydrodynamic regime, and relatively shallow initial depths.
Otvos’ emergence requirements are met on subaqueous landforms in a variety of environments. Shallow subaqueous shoals aggrade when there is available sediment and a convergence of sediment transport. For cape-associated shoals, this occurs as the
2
keep the shoal a coherent structure by opposing tidal currents (Ridderinkhof 2016). With both cape-associated shoals and ebb tidal deltas, once a shoal is established, wave
refraction and shoaling around the landform will further transport convergence by focusing wave induced transport towards the shallowest locations of the shoal.
Submerged former barrier islands are a type of subaqueous shoal whose
morphodynamic evolution has received little attention. Knowledge of hydrodynamic and geomorphic processes governing the evolution of these landforms is lacking, but they are expected to behave like other submerged shoals such as cape shoals and ebb tidal deltas. As with ebb tidal deltas, sediment transport due to wave asymmetry and residual currents contributes to landward migration and aggradation. Without an offshore component, it is possible that the shoals would lose their coherent structure as they migrate landward. The absence of a nearby shoreline landward of the shoal suggests that there is minimal offshore directed pressure gradient force due to wave setup against the coast. Potential offshore transport mechanisms include return flow following the passage of a storm with significant setup, or residual tidal currents if significant tidal exchange flow is present over the shoal crest. Additionally, offshore transport could potentially occur as a result of the wind and wave climate of the region. As with cape shoals, a convergence of transport across the shoal could be induced by episodic shifts in prevailing wind and wave directions. In addition to potential alongshore convergence of wave-driven transport, a convergence could also be set up by a periodic shift between onshore and offshore directed winds and waves.
One such shoal exists periodically in the ephemeral southern Chandeleur Islands. Gosier, Grand Gosier, and Curlew Islands have experienced repeated cycles of destruction and transgressed reemergence dating as far back as 1772 (Otvos 1981; Penland et al. 1985; Fearnley et al. 2009). Historic shorelines and island areas are shown in Figures 1 and 2, where a recent cycle of destruction and reemergence occurred for all four islands following Hurricanes Besty (1965) and Camille (1969). Gosier Island experienced an additional cycle of destruction and reemergence following Hurricane Fredrick in 1979 (Kahn 1986). Most recently, Hurricane Katrina (2005) reduced all three islands to submerged shoals. After several years with no major tropical storms since 2005, fair-weather processes contributed to the aggradation of the shoals, leading to their reemergence by early 2012 (Morgan 2013). This observed recovery indicates that in the absence of high intensity storms it is possible for available sand to be reworked to aggrade submerged shoals. Analysis of oblique aerial photos of the shoals during reemergence suggests that recovery occurs as a four-stage process (FitzGerald et al. 2015). In the first stage, sands reworked by breaking and shoaling waves are deposited on a shallow shoal. As the shoal aggrades, it transitions to an intertidal bar (stage 2). From here, migrating sand bars weld to the intertidal bar and it becomes an incipient barrier (stage 3). Following emergence, long-term beach accretion and dune building processes build the barrier into a robust barrier (stage 4). Figure 3 shows Curlew shoal’s transition from disorganized shoal to incipient barrier. Evidence of sand bars welding to the shoal is visible on both sides of the shoal. Figure 4 shows
3
4
Figure 2: Average island area for the Grand Gosier and Curlew Islands 1869-2005 (adapted from Fearnley et al. 2009; 2014 data (0.2 km2) estimated from satellite images).
5
Figure 4: Oblique aerial photograph of Grand Gosier island after emergence showing evidence of bar welding (Morgan 2016).
A recent geophysical survey of the region indicates that despite the lack of significant sediment supply (e.g. from a fluvial source), a large volume of sand is still
present in the area. Isopach maps of the barrier island lithesome indicate that 656 x 106 m3
of sand rich deposits are present over the 371 km2 area of the southern Chandeleurs
(Twichell et al. 2009). Recent seafloor change analysis of Grand Gosier Shoals shows that despite a net loss of sediment, the shoal has seen a significant increase in elevation due to reworking of immediately offshore sediment (Flocks and Terrano 2016), suggesting that available sediment is sufficient to allow reworking and reemergence.
The region’s frequent winter storms (20-40 events annual; Georgiou et al. 2005) represent one possible driver contributing to the islands observed recovery. The passage of a front causes rapid changes in wind speed, direction, barometric pressure, temperature, and humidity (Mossa and Roberts 1990). For the Chandeleurs, this means that strong southerly winds rapidly switch to northerly winds (Moeller et al. 1993; Keen 2002). The prefrontal southern winds and associated wind and wave setup, together with the low atmospheric pressure significantly elevate water levels during the passage of the front. Previous work indicates that winds are responsible for ~50% of the total setup, while waves and atmospheric pressure each account for ~25% (Li et al. 2011). As a cold front passes, wave, wind, and atmospheric pressure induced setup dies down, forcing flow offshore. This flow was suggested to be morphologically significant by Miner et al (2009) and was measured and found to be morphologically significant for the northern
6
wind directions to offshore (Li et al. 2011). Figure 5 shows this trend in wind and water levels in the nearby Atchafalaya-Vermilion Bays.
Figure 5: Wind vectors, observed water levels, and flux during the passage of a cold front for several locations in Atchafalaya-Vermilion Bays. (from Feng 2009).
A balance between onshore prefrontal and offshore postfrontal conditions could set up a convergence of sediment transport over the shoal. This would be analogous to the balance between onshore directed transport due to waves and offshore directed transport due to residual tidal currents responsible for the aggradation and migration of ebb tidal deltas (Ridderinkhof 2016). Additionally, offshore directed transport associated with postfrontal setdown could induce seaward transport over the shoal. Despite their
7
Figure 6 presents a conceptual diagram of a potential recovery and reemergence mechanism for an ephemeral barrier shoal. Following a major storm, the island is reduced to a subaqueous shoal (Figure 6, top). At these depths, alongshore transport processes are relatively dormant. Cross-shore processes associated with the frequent, cyclic convergence of onshore and offshore directed transport due to cold front passage initiate constructive shoal reworking. As these processes aggrade the shoal to shallower depths, the littoral zone becomes more active and alongshore processes become more important (Figure 6, middle). Constructive reworking accelerates due to increased convergence of transport from
longshore transport and refractive focusing of wave energy over the shoal. With continued aggradation, the shoal emerges as an incipient barrier island (Figure 6, bottom). Bar
8
9
Recent advances in computer modeling coupled with increased computational capability could potentially shed light on the governing processes contributing to this recovery. A coupled hydrodynamic and morphodynamic numerical model, eXtreme Beach behavior (Xbeach), is capable of modeling nearshore processes on relatively short spatial and temporal scales (Roelvink et al. 2009), allowing for the exploration of controls
governing the evolution of these landforms. Xbeach determines morphological change based on the sediment mass conservation equation, wave- and flow-driven sediment transport parameterizations, wave energy conservation, and momentum conservation. Waves are modeled using a short-wave averaged, wave-group resolving module. This phase resolving approach allows for modelling of complex surf and swash zone sediment transport using the Soulsby-Van Rijn equations (Soulsby 1997). Xbeach is capable of running two-dimensional vertically averaged (2D) and/or two-dimensional horizontally averaged (2DH) models. Typically, however, 1D transect models are still widely used because of their substantially lower computational requirements. This allows users to model significantly longer events in shorter amounts of time while maintaining most relevant nearshore wave processes and resulting morphology (Roelvink et al. 2009). Previous 1D applications of Xbeach have shown success in prediction of erosion despite their inability to consider alongshore variability (van Santen et al. 2012; Pender and Karunarathna 2013; Karanci et al. 2014). One dimensional applications of Xbeach lose the ability to account for alongshore variability in transport, including differences from wave run-up to do wave directional spreading, and alongshore convergence due to depth
induced shoaling around the shoal. Despite these limitations one can gain extensive insight into governing processes contributing to shoal aggradation.
A separate model can be utilized to determine the role of alongshore processes over longer time scales. Delft3d (Lesser et al. 2004) is a coupled hydrodynamic and
morphodynamic model capable of modeling waves, flow, sediment transport, and bed evolution. Waves are modeled using the phase averaged spectral wave module, Simulating WAves Nearhsore (SWAN; Booji et al. 1999; Holthuijsen 2007). This module considers shoaling, refraction, energy dissipation, wave-wave interactions, and wave-current interactions. The module considers energy losses due to depth-induced breaking (Battjes and Jannssen 1978), bottom friction (Hasselmann et al. 1973), and whitecapping (Komen et al. 1984). The flow module calculates currents based on the unsteady depth-averaged shallow water equations. Sediment transport for bed load and suspended sediment is computed using the van Rijn (1993 ,2007) equations. Because it resolves waves spectrally, it is possible to model morphologic change over larger spatial and temporal extents than Xbeach. Unlike a 1D application of Xbeach, a 2D Delft3d model could account for
10
Objective
The key objective of this study is to use numerical models along with available wave, water level, and bathymetric data of a submerged shoal to investigate the role of storms, tidal, and subtidal water level variations in the morphodynamic evolution of subaqueous landforms, as observed in the reemergence and recovery of the southern Chandeleur Islands following Hurricanes Betsy and Camille (1960s), and more recently Hurricanes Ivan (2004) and Katrina (2005).
Key Hypothesis
We hypothesize that shoal aggradation, subsequent recovery and eventual reemergence are linked to constructive rather than destructive processes. We also hypothesize that constructive processes leading to net aggradation and reemergence are initially driven by primarily storm-induced cross-shore transport processes (when the shoal crest is low without an active littoral zone), but subsequently longshore transport can be a key factor for the continued aggradation and re-emergence as the shoal aggrades to shallower depths. Finally, we hypothesize that onshore transport alone cannot be a
continuously constructive process without the additional reworking from offshore directed transport (e.g. during post-frontal conditions) aided further by tidal and sub-tidal water level variations.
H1: Cross-shore transport processes during winter storms are the chief agent of subaqueous shoal recovery following destruction caused by a large hurricane. Shoal aggradation, leading to the reemergence or near reemergence, is driven by frequent and cyclic mild to intermediate storm activity (e.g. winter storms).
We will use modeling to subject a bathymetric profile (extracted across a subaqueous shoal following hurricane Katrina) to winter storm activity over the duration of the event while incorporating both onshore and offshore transport pathways. We will repeat the storm impact over many events (20-30) to represent annual forcing.
H2: Both onshore and offshore transport processes must be present to facilitate
aggradation, driven by combined effects of waves, tidal and subtidal water level variations associated with winter storm activity.
H3: At near-emergence, cross shore transport processes alone cannot promote continued aggradation.
H4: After cross-shore processes initiate aggradation, continued aggradation may occur due to longshore processes.
We will examine the role of longshore transport as a key driver of continued shoal
11
Research Questions
Key research questions to supplement the hypotheses include the following:
(1)Can the passage of moderate-energy winter storms induce aggradation of a subaqueous shoal
(2) what is the effect of post-frontal reworking (winds waves and subtidal variations) on shoal aggradation, migration, and coherency
(3) how does this aggradation rate change as depth decreases
(4) to what extent do sub-tidal water level variations influence shoal aggradation
(5) to what extent do longshore transport processes influence aggradation
(6) can these processes account for aggradation above fair weather mean sea level
Regional Study Area
The Chandeleur Islands of southeastern Louisiana began development following the abandonment of the Mississppi River’s St. Bernard Delta Complex about 2,000 BP (Frazier 1967; Penland et al. 1988; Tornqvist et al 1996; Otvos and Giardino 2004). The deltaic headlands evolved into barrier islands following the conceptual model of Penland et al. (1988). In the absence of a sediment supply, headlands were reworked by marine processes into elongated spits. As the mainland subsided in the absence of a supply of sediment, these spits detached to form barrier islands. With continued subsidence and sea level rise, these islands migrated landward to their current position 5-15km west of the original delta coast (Frazier 1967).
12
A recent period (1996-2005) of concentrated tropical storms accelerated island subaerial land erosion (Fearnley et al. 2009). Since then, the islands have seen limited recovery, despite the fact that there have been relatively few intense storms. Seafloor change analysis revealed a net loss of sand from the entire system (Miner et al. 2009; Georgiou et al. 2009, Flocks and Terrano 2016). This sand deficit, along with the islands recent inability to migrate landward due to expansive seagrass beds and backbarrier marsh (Fearnley et al. 2009) suggests that the system is approaching a transition to inner-shelf shoal. If fact, Fearnley et al. (2009) suggested if the trend continued the islands would lose their subaerial footprint by 2013, a result that was corroborated further by Moore et al. (2014) using a morphological behavior model, who reported that the islands have less than 10% of their lifetime remaining. Even Fearnley et al. (2009) however, noted that under quiescent (storm) conditions, the islands would maintain subaerial exposure through 2039.
Response and recovery from storm events has been highly variable across the island chain (Penland et al. 1988, Fearnley et al. 2009). In the southern section, Breton, Grand Gosier, and Curlew Islands have proven to be a more dynamic and geomorphically complex subsystem. In addition to their cycles of destruction and reemergence, they have seen significantly more erosion and landward migration compared to the northern section of the island. Collectively, the southern islands lost 405.14 x 10⁶ m3 of sediment and up to 8.89m
of elevation from 1870 to 2004, with shoreline retreat rates as high as 17m/yr (Miner et al. 2009).
As transgressive barriers, the key factors driving shoreline evolution in the Chandeleurs are the supply of sediment, the rate of sea level rise, and the frequency and intensity of storms (Georgiou et al. 2005; Georgiou et al. 2010). The islands are impacted by both frequent winter storms, and less frequent but more severe tropical storms. The only modern supply of sand to the system comes from reworking of the underlying St. Bernard distributary deposits through shoreface retreat (Miner et al. 2009). This includes fine sands from the muddy prodelta, delta front, and lagoonal deposits, channel fill, and relict strand plain deposits (Otvos 1981; Rogers et al. 2009; Miner et al. 2009). As the islands migrate onshore, these deposits are reworked from the retreating shoreface, releasing sand that is brought onshore via cross-shore transport mechanisms. This supply of sand however, is insufficient to match the volume of sand lost to storms and longshore transport and a net loss of sand has been estimated at 2.3-6 m3/m/yr (Moore et al. 2014). Recent
morphodynamic models show that a sufficient sediment supply from the shoreface is required to prevent an island from drowning (Lorenzo-Trueba and Ashton 2014),
suggesting that degradation will continue for this system. Miner et a. (2009) also reported that sand is lost laterally to the island flanks due to the presence of a bi-directional
longshore transport (Ellis and Stone, 2006; Georgiou and Schindler, 2009). This sand, and sand that is lost to deepwater sinks during storms cannot be reworked back into the littoral system under fair-weather conditions (Georgiou and Schindler 2009).
13
(Penland and Ramsey 1990). More recent estimates of 4.3mm/yr (Twichell et al. 2013) and 6.4 mm/yr (Moore 2014) fall somewhere between the two.
Tropical storms are the primary driver of geomorphic change for the islands. It has been estimated that hurricanes are responsible for up to 90% of shoreline retreat in
Louisiana (Kahn 1986). The Chandeleurs have been impacted by about 42 hurricanes since the early 1900s (Fearnley et al. 2009), and previous work has shown that these storms are responsible for a large percentage of annual sediment transport (Hayes 1967; Ellis and Stone 2006; Georgiou and Schindler 2009). Numerical modeling indicates that storm induced transport is over 2 orders of magnitude greater than transport during calmer periods (Grzegorzewski and Georgiou 2011), and evidence of this process was reported following the passage of Hurricane Katrina, where the barrier chain lost 86% of their subaerial exposure (Sallenger et al. 2009).
The island system has been extensively studied. Previous work has focused on geomorphic response (Penland et al. 1988), historic shoreline change (Penland et al. 1988; McBride et al 1992; Jaffe et al. 1997; Penland et al. 2005, Miner et al. 2009, Martinez et al. 2009; Terrano et al. 2016), framework geology (Penland et al. 1988; Twichell et al. 2009), storm erosion and recovery (Kahn and Roberts 1982; Kahn 1986; Fearnley et al. 2009; Sallenger et al. 2009; Lindermer et al. 2010; Sherwood et al. 2014), ecology (Poirrier and Handley 2007; O’Connell et al. 2009), longshore transport (Georgiou et al. 2005; Ellis and Stone 2006; Georgiou and Schindler 2009; Miner et al. 2009; Miselis et al. 2015), sand resources (Twichell et al. 2009), and morphological behavior (Moore et al. 2014).
14
Chapter 2
Xbeach Methods
Initial Conditions
To test the cross-shore component of our hypotheses, we used Xbeach to model sediment transport over the shoal and resulting aggradation in the southern Chandeleurs using available bathymetric and sediment data. We drove the model with time-varying water levels, and synthetic time-dependent wave data derived from a combination of observations and model derived data meant to represent a typical cold front passage.
A 9.6km bathymetric transect of Curlew Shoal was obtained from a DEM of the Chandeleur Islands with a 3m resolution (Miner et al., 2009; Twitchel et al. 2009). This transect spans from the 10m isobath seaward of the shoal to the 5m isobath landward of the shoal (Figure 7). The model resolution along the transect was ~20m, except over the shoal, where a finer resolution of ~3m was utilized where water depths are less than 2m.
Figure 7: Shoal transect used for Xbeach simulations (Sea is left, backbarrier is right).
Sediment characteristics for the model were determined from data from Louisiana’s Barrier Island Comprehensive Monitoring (BICM) program (Kindinger et al. 2013). Data from 5 sediment samples taken near the transect during the summer of 2008 were
averaged to determine D50 and D90 values of 153 and 221 μm. Porosity was assumed to be
0.4 and sediment density was assumed to be 2,650 kg/m3. We assume no mud content
15
present, the assumption of sandy substrate is appropriate, as Twitchel et al. (2009; 2013) showed that the sandy isopach thickness extends along the entire subaqueous shoal.
Model Setup and Forcing
Wave conditions were supplied to Xbeach as a table of time dependent conditions. The wave boundary condition parameter “instat = 41” allows the user to input wave conditions by supplying a time series of significant wave height, representative period, mean wave direction, peak enhancement factor and spreading coefficient (representing directional spreading of wave energy). A peak enhancement factor of 1 and spreading coefficient of 20 (degrees) were assumed. Time dependent wind inputs were not possible in this scenario since the model is used in 1D. Waves were applied to weakly reflective 1D boundaries at the ends of the transect, while the lateral boundaries were set as a no
gradient (Neumann) boundary also known as zero flux boundary with respect to sediment transport – ie no alongshore flux.
The default 1D configuration of XBeach version 1.21.3667 was used for this model application. Infragravity waves were modeled using phase resolving, non-linear shallow water equations. Short wave propagation was modeled with a spectral wave model, and sediment transport was calculated with the Thiel-Van Rijn formulation (Van Rijn 1984). The vegetation, quasi 3d effects, ships, short-wave runup, groundwater, non-hydrostatic flow, and bed level time series functions were not used in this model.
Simulations
16
Figure 8: Wave height and water level for the passage of the simulated cold front. The solid black line represents a shift from offshore to onshore directed waves.
A set of model runs was performed to determine the ideal morphodynamic upscaling coefficient (morfac) setting for the models. Morphologically upscaling is a method to increase modeled timescales for sediment transport by increasing bed level changes from each hydrodynamic time step by an acceleration factor (Lesser et al. 2004). Morphodynamically upscaling the model significantly reduces the computational time for each run, and can increase the total length of time simulated. 10 cycles of storm and offshore events were applied to a profile with morfac values of 1, 2, 4, and 10.
To test the hypothesis that at near-emergence, cross-shore transport processes alone cannot promote continued aggradation, we artificially raised the profile by 1m and subjected it to the same conditions. We used the output profile from the 10th run to ensure
that the profile had adjusted to these storm conditions before being raised.
Two additional sets of Xbeach simulations were performed to determine the role of tidal water level variations in driving morphological change over the shoal. A 6-day time series of water level data from NOAA tide station 8760721 (Pilottown, LA) was added to onshore events. The record spans from 1/22/17 to 1/28/17 and includes a 0.41m spring tide. This time series was applied so that the peak storm coincided with both high tide and low tide. Both simulations were subjected to 5 cold front events. Final shoal crest
elevations were compared to investigate the impact of tides on shoal reworking.
An additional set of Xbeach simulations was performed to determine the importance of offshore events in reorganizing the shoal after the storm. In addition to limiting
17
linear berms. To investigate this possibility, the same transect was subjected to 10 onshore events without offshore events.
Delft3d Methods
Initial Conditions
A second model (Delft3d) was used to determine the role of alongshore processes and their contribution to shoal aggradation, and to observe how this role changes as the shoal rises. The model was driven with observed winds, waves, and water level data for a one month period to model winter storm induced morphologic change. The data were collected by the University of New Orleans (UNO) Pontchartrain Institute for
Environmental Sciences (PIES). The observed record was modified to develop four base scenarios and two “residuals scenarios” of varying water level and wave magnitudes to simulate change on the initial shoal bathymetry, and subsequently assess change on the same profile but with bathymetry raised by 0.5m and 1m, producing 32 simulations
The model utilized 110km by 50km grid as the model domain of the entire Chandeleur chain. Alongshore resolution is 500m across the domain. In the cross-shore direction, grid resolution is 500m offshore and in the backbarrier; and ~167m in the vicinity of the islands and shoals. Wave and water level conditions are supplied to the offshore boundary as a time series. Time-dependent spatially constant winds are applied across the domain. Bathymetry (Figures 9 and 10) was derived from the same DEM used for Xbeach simulations (Miner et al., 2009 and Twitchel et al. 2009). Sediment
18
19
20 Model Setup and Forcing
The default configuration of Delft3d version 4.02.03 was used for these simulations. The SWAN module utilized 3rd generation mode for physics. Depth-induced breaking based
on the Battjes and Jannsen model. Spectral wave shape at the boundary followed a
JONSWAP formulation using a peak enhancement factor of 3.3, with a directional spreading of 20degrees was utilized. Bottom friction was determined using a JONSWAP formulation with a coefficient of 0.067m2/s3. Wind growth, whitecapping, refraction, and frequency
shift processes were active. Non-linear triad interactions and wave diffraction were not considered. Accuracy criteria were set to require convergence over 95% percentage of wet grid points with relative change of 0.02m. For the flow module, bottom roughness
calculations utilized a uniform Chezy formulation and a constant value of 67 was used representing sandy bottom. A 720 minute spin-up interval was employed to gradually bring the model to dynamic equilibrium before applying any morphological changes on the bed. Salinity, temperature, pollutant, secondary flow, dredging processes were not utilized.
Simulations
Wave and wind conditions were based on hourly measurements of wave height, wave period, wave direction, wind speed, and wind direction from NOAA buoy 42040. Hourly water levels were determined from local data collected by the University of New Orleans (UNO Pontchartrain Institute for Environmental Sciences (PIES). Subtidal and tidal water level signatures were separated using a low pass filter of a moving average. Data for this one-month period (12/17/10 to 1/17/11) is shown in Figure 11.
21
To test the hypothesis that the effects of waves, tidal water level variations, and subtidal water level variations facilitate shoal aggradation during the passage of a winter storm, the Delft3d model considered four different wave and water level scenarios (Figure 12), and two additional scenarios meant to determine sediment transport due to waves and water level variations. The first, “as is” scenario used unaltered wave and water level data for the period of interest. The second scenario was meant to determine the relative
22
23
To test the hypothesis that after cross-shore processes initiate aggradation, and that continued aggradation occurs due to longshore processes, each scenario was run with original and elevated bed levels. To make results comparable, this was achieved by lowering water levels rather than raising bed levels (Figure 13). Each scenario was run with original bed levels, bed levels elevated 0.5m (water levels lowered by 0.5m), and bed levels elevated 1m (water levels lowered by 1m). Additionally, each scenario was run with morfac values of 1 and 20 to determine the short and long-term effect resulting from these conditions.
Figure 13:Illustration of bed raising technique for a cross-shore profile of the shallowest location of Curlew Shoal. Water levels are lowered to decrease shoal depths and simulate a raised profile. Vertical distance represents depth for the unraised scenario.
24
Run Number Water Levels Wave Heights Initial Bed Morfac
1 Unaltered (Fig 9) Unaltered (Fig 9) Unaltered (Fig 7) 1
2 Unaltered (Fig 9) Unaltered (Fig 9) Unaltered (Fig 7) 20
3 Unaltered (Fig 9) Unaltered (Fig 9) Raised 0.5m 1
4 Unaltered (Fig 9) Unaltered (Fig 9) Raised 0.5m 20
5 Unaltered (Fig 9) Unaltered (Fig 9) Raised 1m 1
6 Unaltered (Fig 9) Unaltered (Fig 9) Raised 1m 20
7 Subtidal Removed Reduced 50% Unaltered (Fig 7) 1
8 Subtidal Removed Reduced 50% Unaltered (Fig 7) 20
9 Subtidal Removed Reduced 50% Raised 0.5m 1
10 Subtidal Removed Reduced 50% Raised 0.5m 20
11 Subtidal Removed Reduced 50% Raised 1m 1
12 Subtidal Removed Reduced 50% Raised 1m 20
13 Surge Removed Peak Storm removed Unaltered (Fig 7) 1
14 Surge Removed Peak Storm removed Unaltered (Fig 7) 20
15 Surge Removed Peak Storm removed Raised 0.5m 1
16 Surge Removed Peak Storm removed Raised 0.5m 20
17 Surge Removed Peak Storm removed Raised 1m 1
18 Surge Removed Peak Storm removed Raised 1m 20
19 Setup and Surge Removed Reduced 50% Unaltered (Fig 7) 1
20 Setup and Surge Removed Reduced 50% Unaltered (Fig 7) 20
21 Setup and Surge Removed Reduced 50% Raised 0.5m 1
22 Setup and Surge Removed Reduced 50% Raised 0.5m 20
23 Setup and Surge Removed Reduced 50% Raised 1m 1
24 Setup and Surge Removed Reduced 50% Raised 1m 20
25 No Water Level Variations Unaltered (Fig 9) Unaltered (Fig 7) 1
26 No Water Level Variations Unaltered (Fig 9) Raised 1m 1
27 No Water Level Variations Unaltered (Fig 9) Unaltered (Fig 7) 20
28 No Water Level Variations Unaltered (Fig 9) Raised 1m 20
29 Unaltered (Fig 9) No Waves Unaltered (Fig 7) 1
30 Unaltered (Fig 9) No Waves Raised 1m 1
31 Unaltered (Fig 9) No Waves Unaltered (Fig 7) 20
32 Unaltered (Fig 9) No Waves Raised 1m 20
25
Chapter 3
Xbeach Results
Ideal Morfac Setting
Figure 14 shows the evolution of the crest of a shoal as it is subjected to 10 cycles of repeated sequences of onshore and offshore conditions using morfac values of 1, 2, 4, and 10. Values of 1, 2, and 4 yield comparable results. The crest aggrades and widens following each storm event. Offshore events widen and rework the shoals. Aggradation or
degradation during storm events is on the order of millimeters. This results in a general trend of steady aggradation. This behavior is not seen with the highest morfac. Offshore events cause excessive degradation, and ultimately, a seaward translation is observed. The excessive degradation during offshore events also causes significant shoal crest lowering. This results in an unnatural shift back and forth between profiles following onshore events and profiles following offshore events. A morfac value of 4 was chosen for future runs in order to decrease computation time while continuing to produce realistic results.
26
Morfac Translation (m)Aggradation (mm)
1 53.61 32.97
2 50.79 32.53
4 45.14 27.56
10 -22.57 4.67
Table 2: Total translation and aggradation at the end of the 10th set of runs with morfac values of 1, 2, 4, and 10.
Extended Simulation
Figure 15 shows the evolution of the crest of a shoal as it is subjected to 40 cycles of repeated sequences of onshore and offshore conditions. Aggradation and translation rates from an extended run (40 cycles) are plotted in Figure 16. The shoal experiences a general trend of net aggradation and landward translation. Aggradation is observed following each onshore event. After the first onshore event, storm induced aggradation is ~3.5mm per event. This rate slowly increases to just less than 5mm per event. Degradation from
offshore events weakens until the 20th cycle, and then strengthens until the 40th cycle. The
resulting total aggradation rate reaches its peak around the 25th cycle, and declines until
the 40th. Onshore event induced landward translation increases with subsequent cycles;
however, seaward translation during offshore increases faster. This causes a net decrease in landward translation rates over the complete set of runs.
27
28 Raised Shoal
After 10 cycles of onshore and offshore runs, the final profile was raised 1m and subjected to the same conditions to determine if aggradation would continue in a shallower environment. Results suggest that storms of that magnitude would have a destructive impact on the shoal (Figure 17). The shoal crest lowers 43.6mm over the course of 7 sets of events. Landward translation continues, and the shoal widens. Offshore conditions cause minimal degradation, and do not change the location of the crest.
Figure 17: Transect evolution after raising bed levels by 1m following repeated cycles of onshore (ns) and offshore (no) events.
Tides
Data for model runs utilizing a spring tide water level time series is summarized in table 3. After 5 sets of onshore and offshore events, simulations where storm peak
conditions coincided with high tide experienced 4.49mm less aggradation and 53.56m more landward migration than scenarios without tides. Scenarios where peak storm
29
Change in Aggradation (mm) Change in Translation (m) High tide at storm
peak Low tide at storm peak High tide at storm peak Low tide at storm peak
Total -4.49 2.01 53.56 5.70
Onshore
Average -0.52 0.20 5.64 0.01
Offshore
Average -0.38 0.20 5.08 1.13
Net Average -0.45 0.20 5.36 0.57
Table 3:Change in aggradation and translation rates for scenarios where the storm peak coincides with high tide and low tide.
Offshore Events
Results indicate that the inclusion of offshore events in simulations serves to increase net aggradation (Figure 18). After 10 runs, the onshore-only transect was wider, shorter, and farther landward than the profile subjected to storm and offshore conditions. Net aggradation for the 10 runs was 15% (4.9mm) less than the 32.9mm observed with offshore events included. Landward translation was 25.4m more.
Figure 18: Shoal evolution when subjected to onshore events (left) and cycles of onshore and offshore events (right).
Delft3d Results
Sediment Transport
Significant sediment transport occurs along the island chain over the course of the Delft3d simulation. Mean total transport magnitudes appear to be a function of depth, and are highest at the shallowest locations (Figure 19). The highest magnitudes of transport of are observed along of Chandeleur Island, but significant transport also occurs near Breton Island as well as Curlew, Grand Gosier, and Gosier Shoals. Transport near these southern shoals increases with both shoal size and proximity to Chandeleur Island. Curlew
30
31
North of the nodal point the dominant longshore transport direction is north, while sediment south of the nodal point moves south.
A previous energy balance for the system determined that energy input into the sound is strongest to the north of the chain. The southern end experienced equal energy gain and loss, while inlets experienced energy loss (Hart and Murray 1978). Our storm produces this same general flow pattern, and it is evident in plots of mean total transport vectors along the chain (Figure 20). There is a noticeable flood dominant transport over the spit platform to the north of Chandeleur Island. Over most of the southern shoals, transport is generally cross-shore balanced and primarily southward. Transport is ebb dominant in southern inlets. Additionally, since water is predominantly entering the basin to the north of the chain and exiting to the south, there is consistent southward transport behind the barrier.
32
These sediment transport patterns due to longshore transport and backbarrier circulation induce significant sedimentation and erosion for the southern shoals. Results are presented in figures 21-23. Higher morfac runs exhibit similar sedimentation and erosion patterns; however, the magnitudes of both sedimentation and erosion are
33
34
35
36 Shoal Aggradation
Since aggradation and degradation also depend on initial depths, plan views of sedimentation and erosion do not accurately depict aggradation or degradation of the shoal. Shoal aggradation can be masked by shoal widening and landward migration of the entire shoal. Figures 24 and 25 depict aggradation and degradation of the shoal crest using an alongshore transect of the shoal crest elevation from south to north. Aggradation and degradation trends indicate southern movement of sediment along the chain. This is evident in the downdrift movement of shoals and inlets, in agreement with previous observations of sediment transport in this region (Georgiou and Schindler 2009), and is also apparent in our mean total sediment transport results. Slight degradation is seen along most of the transect; Gosier experiences significant destructive reworking, and shoal crests lower approximately 1m in every scenario. Grand Gosier experiences slight aggradation in morfac 1 simulations, and degradation in morfac 20 simulations. This degradation weakens as the transect is raised. Curlew Shoal, on the other hand, experiences significant
37
Figure 24: Alongshore crest elevations for unraised and raised base scenario simulations using morfac values of 1 (left) and 20 (right). The top plot shows results for all unraised and raised scenarios with bed levels normalized to the unraised state. The lower plots show initial and final shoal depth for each initial bed level. The transect starts near the MRGO channel (left) and extends to north of Curlew Shoal (right). “GG” represents Grand Gosier and “G” represents Gosier. Scenarios are
named xpy, where x is the base scenario, and y is the amount that bed levels have been raised.
38
Figure 25: Alongshore crest elevations for unraised (top) and raised scenarios 1-4 using morfac values of 1 (left) and 20 (right). Mean sea level is plotted as a horizontal blue line. The transect starts near the MRGO channel (left) and extends to north of Curlew Shoal (right). Results from raised
scenarios have been normalized to initial bed levels. Scenarios are named xpy, where x is the base
39
Chapter 4
Discussion
Cross-shore Processes
The lack of aggradation in unraised Delft3d scenarios suggests that immediately following a large hurricane event, these shoals are unable to aggrade by alongshore processes alone. All four scenarios with morfac values of both 1 and 20 exhibit either destructive or negligible reworking of the shoals (Figure 25). Low sediment transport volumes suggest a relatively inactive littoral zone (Figure 19). Xbeach runs, on the other hand, show potential for constructive reworking and aggradation through cross-shore processes, likely because the phase resolving waves better represent nearshore processes. As the profile is subjected to repeated simulated cold front passages, available sand is reworked onto the crest of the shoal, and the shoal migrates landward. Over the course of 40 events, the profile experienced an average of 3.24mm of net aggradation per cold front passage. Net aggradation steadily increased to a maximum of 3.71mm per event on the 22nd
event. For events 22-40, net aggradation steadily decreased, indicating that the profile crossed a threshold where reworking became less and less constructive. This suggests that eventually there may be a point where this storm induces destructive reworking of the shoal. During this period, the aggradational contribution from onshore events continues to increase; however, rapidly increasing degradation associated with post-frontal, offshore events results in this observed decrease in net aggradation rates (Figure 16). Water level data used in Delft3d runs indicates that subtidal water level variations are about half of our initial estimate. It is possible that aggradation could continue to accelerate if these runs were repeated with a more realistic setdown of 0.5m.
If the seabed profile were to continue to aggrade at the average rate of 3.24mm per event, it would take over 15 years with 30 cold fronts per year for this shoal to aggrade above mean sea level. In reality, the intensity and duration of cold front passages would vary, so this is a rough estimate. Additionally, if the trend in decreasing aggradation rates continues, emergence forced solely by cross-shore processes would take even longer, or not occur at all, making the 15 year window a best case scenario. The observed
reemergence of these shoals took approximately 7 years; suggesting that additional processes become important as the profile rises, and that these additional processes accelerate aggradation. This hypothesis is strengthened by the fact that aggradation does not continue when the profile is raised 1m. The same storm becomes destructive, whereby shoal crest elevation lowers, and landward migration accelerates, hindering overall
aggradation. While this technique does not consider changes in shoal geometry as the shoal rises, this was a necessary simplification as it is not computationally feasible to run enough simulations to aggrade to near emergence.
40
where high tide coincided with peak storm conditions experienced less aggradation. When low tide coincided with the peak in storm intensity, aggradation increased. Aggradation decreases associated with high tide runs were greater than increases during low tide runs; suggesting that, overall, tides serve to decrease aggradation potential. It should be noted that these simulations only consider spring tides where maximum water levels coincide with peak storm intensity. Rising and falling tides coinciding with peak storm intensity were not investigated. Tides were not assessed over a range of water levels or storm intensities, and it is possible that they could have a completely different impact on the shoal under different circumstances. Because tides had both constructive and destructive potential, and because of the complexity associated with determining a representative tide on an event scale simulation, tidal water level variations were not added to long-term simulations.
Results from model runs that do not include offshore events indicate that, despite being destructive, offshore events have an indirect contribution to the aggradation potential of this shoal. While every offshore event causes shoal crest lowering, it sets the profile up for increased aggradation in the next onshore event; resulting in net aggradation. Additionally, offshore events appear to retain the shoal’s coherency as it aggrades.
Simulations that do not include offshore events have final profiles that are wider and farther landward. While aggradation is still observed, aggradation rates decrease as more events are simulated (Figure 26). Simulations that include offshore events experience increasing rates of aggradation for the first 22 events. In the absence of a sediment input, constructive reworking requires profiles to narrow in order to rise. The widening
41
Figure 26: Aggradation rates for complete cycles of cold front passage (red) and cycles that do not include offshore events (blue). Aggradation rates begin to decline immediately in runs that do not consider offshore events.
Across all scenarios, results suggest that a balance exists between landward migration and aggradation rates. Significant increases in landward migration tends to be related to decreased aggradation or even degradation. Results from the onshore only and low tide at peak storm simulations show increased landward migration and decreased aggradation. Raised scenarios experience extreme migration and significant degradation. In the extended set of simulations, maximum aggradation rates coincide with a decrease in translation rates. As with ebb tidal deltas, this suggests that if onshore directed forces aren’t balanced by offshore directed forces, aggradation will not continue. On the other hand, extended simulations suggest that some degree of net onshore migration increases aggradation. While aggradation rates initially increase as translation slows, the system reaches a point where translation stops for several consecutive cycles. This marks the threshold where aggradation rates begin to decline. If these trends continue, the shoal may reach a point where it is unable to aggrade or migrate landward. This is analogous to in-place drowning observed on barrier island systems (Kumar 1975, Nummedal et al. 1984, Lorenzo-Truba and Ashton 2014), but occurs on time scales short enough for sea level rise to be insignificant. This form of drowning is driven by destructive lowering of bed levels and sediment loss rather than rising sea levels.
While results indicate that cross-shore processes are capable of inducing constructive reworking and aggradation of a shoal, it is important to note that this is
merely a proof of concept. It is not an attempt to quantify how many cold front passages are necessary to cause emergence, and it is not a comprehensive attempt to constrain
magnitudes of forces capable of inducing constructive reworking. This is an event scale model repeatedly forced with one simplified synthetic cold front passage. Actual conditions will vary and will be much more complicated than this example. Potential combinations of bed levels, shoal geometries, prefrontal durations, postfrontal durations, wave intensities,
0.0 0.5 1.0 1.5 2.0 2.5 3.0 3.5 4.0 4.5
1 2 3 4 5 6 7 8 9 10
A gg ra d at io n ( m m ) Event
42
setups, setdowns, and tidal water level variations are too numerous to be tested with this model. We attempt to determine the contribution of a particular variable (or process) towards aggradation potential, but it is important to remember that this variable (process) has not been tested in every possible scenario. Interactions between forces have not been comprehensively tested. For example, applying our synthetic cold front to a raised profile results in destructive reworking. However, it is possible that constructive reworking could be observed if setup magnitudes were greater or if wave heights were smaller.
Additionally, any attempt to determine what magnitudes of each of these forces induces constructive reworking would need to consider sequences of events, not just individual events. For example, results from simulations that do not include offshore events indicate that these destructive events actually set up the profile for net aggradation during future events. Similarly, an event with destructive wave heights could potentially set up a shoal geometry that is more conducive to aggradation during future, less intense events. It is important to not over-interpret these results as limitations in computational power and available data make it impossible to fully constrain each potential variable. Results indicate this shoal can aggrade when subjected to one simplified, repeated, representative event, and give limited insight into how this behavior changes with reasonable deviations in forcing mechanisms.
Littoral Activation
Results for each scenario indicate that as bathymetry is raised, the littoral zone becomes more active (Figure 19). The largest increases in transport occur at shallower initial depths. This results in increased littoral transport south of the nodal point on Chandeleur Island, and increased transport along the southern shoals. These trends in littoral activation contribute to the constructive reworking and aggradation on Curlew Shoal. Because Curlew Shoal is closest to the areas of highest sediment transport on Chandeleur Island, it would be the first shoal to receive any sediment travelling south due to longshore transport. Additionally, the inlet between Curlew Shoal and Chandeleur Island is significantly shallower and narrower than the inlet between Curlew and Grand Gosier Shoals. This is indicative of less energy in the inlet and a greater chance of sediment bypassing. A sediment input to Curlew Shoal would serve to amplify constructive reworking. Magnitudes of transport decrease in the downdrift direction, resulting in a decreased sediment supply to Gosier and Grand Gosier Shoals. This could be responsible for the lack of significant aggradation in this region of the shoals. An increase in activity of the littoral zone would also serve to amplify transport patterns over the shoals themselves; increasing magnitudes of both constructive and destructive reworking. Because Curlew Shoal has the largest footprint, this activation occurs over a larger spatial extent, and morphological change accelerates as the profile rises. Gosier and Grand Gosier Shoals have a smaller spatial extent. While the littoral zone still becomes more active, it does so over a smaller area and the increase in morphologic change as the profile rises is less apparent. This applies to both constructive reworking over Grand Gosier, and destructive reworking over Gosier.
43
and the southern shoals. This would serve to rework any overwash deposits that occur during high energy events. This transport decreases with distance from Chandeleur Island because of significant offshore flow through inlets between shoals. As with longshore transport, this would serve to increase sediment supply and reworking, particularly around Curlew Shoal.
Sediment Transport Patterns
In addition to increasing the magnitude of transport, raising the bathymetry significantly changes transport patterns near the southern shoals. As the region rises, offshore transport through inlets slowly increases while transport over the shoal switches from alongshore to strongly onshore (Figure 27). In the unraised scenario, sediment behind and over the shoal is transported alongshore towards the south, and offshore through inlets. Results are similar with morfac values of both 1 and 20. When the
bathymetry is raised 0.5m, transport over the shallowest parts of Curlew and Grand Gosier Shoals changes from alongshore to onshore. The magnitude of this transport is comparable to transport volumes offshore through inlets. When bathymetry is raised by 1m, landward transport over the shoals begins to dominate. This onshore transport appears to drive the constructive reworking observed on both shoals. Curlew has the strongest onshore
transport and experiences the greatest amounts of constructive reworking. Gosier, on the other hand, retains downdrift dominant transport as the profile rises. Gosier has no onshore transport, and experiences destructive reworking.
44
Splitting wave and water level contributions to mean total transport indicates that, while mean total transport over the shoals is onshore, onshore wave induced transport is countered by a weaker offshore transport due to tidal and subtidal residual currents (Figure 28). This sets up a cross-shore convergence of sediment transport similar to the convergence that drove aggradation in Xbeach runs. This is analogous to the balance of offshore and onshore transport that drives accretion and promotes aggradation on ebb tidal deltas (Ridderinkhoff et al. 2016). This convergence of transport is strong over Curlew Shoal (Figure 29) and Grand Gosier Shoal (Figure 30). This likely accounts for the
45
46
47
48
In addition to the general downdrift orientation, mean total transport vectors at the edges of both Gosier and Grand Gosier Shoals have a significant offshore component on the northern end and onshore component on the southern end (Figure 30). On the southern end, mean total transport appears to be driven by onshore wave-induced sediment
transport. Offshore transport due to residual currents is minimal, and mean total transport most resembles the wave induced transport vector. On the northern end, mean total
49
Figure 31: Observed evolution of Gosier island. Following a destructive event, the island transitions from a collar shape, to an “S” shape, to a circular shape. The island takes on a collar shape in 2001 following a destructive event.
Shoal Aggradation
Since crest elevation change is less apparent in simulations using a morfac value 1, this discussion focuses on morfac 20 simulations. However, it should be noted that Grand Gosier Shoal experiences slight aggradation in morfac 1 simulations. Degradation observed in morfac 20 runs is due to the intense storm later in the simulation. Storms of this
magnitude are not typical in a representative month during cold front season, so a morfac of 20 may apply unrealistic weight to change induced by this storm. Grand Gosier Shoal appears to support aggradation when subjected to this storm once, but unrealistically repeated events induce degradation. This implies that Grand Gosier Shoal would experience aggradation over the course of a representative cold front season. Because Curlew Shoal experiences a rapid recovery following the storm, it is still able to experience net constructive reworking.
Sediment transport patterns are reflected in morphologic change evident in alongshore plots of crest elevations. While most of the shoal experiences degradation, Curlew Shoal experiences significant aggradation in raised scenarios. This aggradation is greatest in 1m raised simulations. This is due to the sediment supply, increased littoral activation, and convergence of transport unique to Curlew Shoal. Crest elevation change is more consistent between raised and unraised simulations on Gosier and Grand Gosier Shoals because littoral activation is occurring over a smaller area.