ISSN (Print) : 2320 – 3765 ISSN (Online): 2278 – 8875
I
nternational
J
ournal of
A
dvanced
R
esearch in
E
lectrical,
E
lectronics and
I
nstrumentation
E
ngineering
(An ISO 3297: 2007 Certified Organization)
Vol. 4, Issue 1, January 2015
Optimization of Multistage Decimation
Processing Using Genetic Algorithm
Richa
Assistant Professor, Dept. of ECE, UIET, CSJM University, Kanpur, Uttar pardesh, India
ABSTRACT: Sample rate conversion requires less computation when implemented in multiple stages. The
optimization problem for the design of multistage decimators is considered. Corresponding objective function for sample rate reduction is based upon minimising multiplies and adds per second (MADS) of the decimation filter. In this paper genetic algorithm approach is used to solve the optimisation problem . The decimation ratios of multistage decimation filters are optimized. Calculation of MADS for all the cases finally decide the optimum multistage system for decimation. The results are compared with the well established existing methods, where its particular characteristics are highlighted .The approach is also very suitable for higher decimation ratio where calculation by previous methods took significant time.
KEYWORDS: Genetic Algorithms, Signal Processing, decimation, digital filter, optimization, resampling.
I.INTRODUCTION
ISSN (Print) : 2320 – 3765 ISSN (Online): 2278 – 8875
I
nternational
J
ournal of
A
dvanced
R
esearch in
E
lectrical,
E
lectronics and
I
nstrumentation
E
ngineering
(An ISO 3297: 2007 Certified Organization)
Vol. 4, Issue 1, January 2015
The results of the proposed GA-based method is compared with the previous methods. The simulation results show that the proposed method is also able to find the almost same solution of multistage decimator optimisation problem decreasing mathematical complexity even for higher decimation ratio. In the section 2 , the multistage decimator structure is discussed. In Section 3, genetic algorithm is discussed .In section 4 solution for multistage optimization problem is proposed using GA. Design examples are given in Section 4, and conclusions are drawn in Section 5.
II. OPTIMIZED MULTISTAGE DECIMATION
Multiple stages for decimation (or interpolation) can reduce the number of filter coefficients in the filter specifications. Discussion [1] shows that transition width, filter length of filter stage depends on the decimation rate of that particular stage. So determination of optimal decimation rate per stage is very important in multistage decimation. If the overall sampling rate decimation ratio D can be factored into the product
=∏ (1)
where isan integer, then the decimators can be implemen ted using K stages as it is shown in Fig. 1(a), where x(n) and y(m) denote discrete input and discrete output signal and H(z) is the transfer function. For the design and analysis purposes, diagram shown in Fig. 1(a) can be redrawn into the equivalent single-stage form given in Fig. 1(b) [1], [2] where D=D1*D2. and H(z)= H1(z)*H2(z) .
(a)
(b)
Fig.1. (a) Multistage Implementation for K=2 (b) equivalent single-stage decimation model.
Let ∆f=(fc-fp)/fs denotes the normalized transition bandwidth, where fc stands for the stop band edge frequency, fp
stands for the pass band edge frequency, and fs denotes sampling frequency. In order to minimize total number of multiplications and additions per second approximate objective function [1] is used given in equation (2)
≅ ∞ (2)
where ∞ , depends on and which are and ripple levels, denotes initial sampling rate, and variable S
is given by[20],[21]
( ,∆ , ; , ,... ) =∆ ∗∏ + ∑ ∏ ∗1/ 1− ∏ (3)
where = 1- ∆ .It is obvious that to obtain minimal value of function RT the multivariate function S has to be
ISSN (Print) : 2320 – 3765 ISSN (Online): 2278 – 8875
I
nternational
J
ournal of
A
dvanced
R
esearch in
E
lectrical,
E
lectronics and
I
nstrumentation
E
ngineering
(An ISO 3297: 2007 Certified Organization)
Vol. 4, Issue 1, January 2015
III. (1) THE PROPOSED GENETIC ALGORITHM APPROACH
III.1.1 Genetic Algorithm
The basic principles of GA were first proposed by Holland [7]. Thereafter, a series of literature [8], [9] and reports [10], [11], [12] became available. GA is an optimization technique inspired by the mechanism of natural selection, a biological process the individuals with the considered best characteristics to adapt to the environment are more likely to reproduce and survive. These advantageous individuals mate between them, producing descendants similarly characterized, so favourable characteristics are preserved and unfavourable ones destroyed, leading to a progressive evolution of the species.
Artificial genetic algorithm aims to improve the solution to a problem by keeping the best combination of input variables. It starts with the definition of the problem to optimize , generating an objective function to evaluate the possible candidate solutions (chromosomes).An initial random population of n individuals is generated. The population size, which is usually a user-specified parameter, is one of the important factors affecting the scalability and performance of genetic algorithms. For example, small population sizes might lead to premature convergence and yield substandard solutions. On the other hand, large population sizes lead to unnecessary expenditure of valuable computational time. The size of this population varies from one problem to another although, some guidelines are given in [15]. These n individuals are called chromosomes that are symbolized by binary strings, where each binary position of the chromosome is called a gene and denotes a specific characteristic (input variable).
Each chromosome is evaluated in the objective function and the best individuals are selected to survive for mating (parents), while the worse ones are discarded to make room for new descendants. The next step is to create a second generation of individuals, based on the information of the parents. There are several ways of mating [14].
The parent’s binary information to the child is transferred using genetic operators crossover point and mutation. New parents are randomly selected for each new child and the process continues until the chromosome population grows back to the original size n. The purpose of mutation is to introduce diversity into the population, allowing the algorithm to avoid local minima by generating new gene combinations in the chromosomes.
Finally, after mutation is done the new generation of chromosomes is evaluated with the objective function and used in the next iteration of the described algorithm. The algorithm iterates until a maximum number of chromosome generations are created or a satisfactory solution is reached
III.1.2 The Proposed Approach
Optimum Decimation ratio of multistage Decimator is calculated so that multiplies and adds per sec can be minimised. When K=2 (two stage decimator ) the objective function given in[20] for minimum computation load will become as
( ,∆ , ; ) =
∆ + (3)
when K=3(three stage decimator) the objective function given in[20] for minimum computation load will become as
,∆ , ; , =∆ + + [1/ (1− /2 ] (4)
Where =1- ∆ .Now GA act as heuristic search method and is used for an efficient searching and fast converging tool for the optimum decimation factor detection in the above problem. For a clearly defined above problem the simple GA works with following parameter setting as follows:
ISSN (Print) : 2320 – 3765 ISSN (Online): 2278 – 8875
I
nternational
J
ournal of
A
dvanced
R
esearch in
E
lectrical,
E
lectronics and
I
nstrumentation
E
ngineering
(An ISO 3297: 2007 Certified Organization)
Vol. 4, Issue 1, January 2015
iterative method chosen by [5]. Similarly the decimation factor of subsequent stages will considered to be near 2 as it is the minimum integer decimation factor. The initial range for the population is also given by the help of these bounds . 2. Fitness function: Fitness function in the present case is equation no.(3) for each individual in the population. The main purpose of fitness function is to get best individual for optimum detection. Now the scaling function converts raw fitness scores returned by the fitness function to values in a range that is suitable for the selection function. Scaling function Rank is used here which scales the raw scores based on the rank of each individual, rather than its score. The rank of an individual is its position in the sorted scores. The rank of the fittest individual is 1, the next fittest is 2, and so on. Rank fitness scaling removes the effect of the spread of the raw scores.
3. Selection: The selection function chooses parents for the next generation based on their scaled values from the fitness scaling function. Stochastic uniform lays out a line in which each parent corresponds to a section of the line of length proportional to its expectation. The algorithm moves along the line in steps of equal size, one step for each parent. At each step, the algorithm allocates a parent from the section it lands on. The first step is a uniform random number less than the step size.
4. Reproduction: It determine how the genetic algorithm creates children at each new generation. Elite count specifies the number of individuals that are guaranteed to survive to the next generation which is set as 2 in this case .The Elite count must be a positive integer less than or equal to Population size. Now Crossover and Mutation are performed. The fraction of the next generation that crossover produces is taken as 0.8. Mutation produces the remaining individuals in the next generation. So for the initial population of 20 , elite count of 2 , and the crossover fraction 0.8 ,there are 18 individuals other than elite children, so the algorithm rounds 0.8*18 = 14.4 to 14 to get the number of crossover children. The remaining four individuals, other than elite children, are mutation children.
5. Now fitness function is calculated again for these new children and process is repeated until the stopping criteria is met. The algorithm runs until the weighted average change in the fitness function value over generations is less than 10
-6
.
Each iteration of this process is called a generation. A GA is typically iterated for anywhere from 50 to 500 or more generations. The entire set of generations is called a run. At the end of a run there are often one or more highly fit chromosomes in the population. Since randomness plays a large role in each run, two runs with different random-number seeds will generally produce different detailed behaviours. GA researchers often report statistics (such as the best fitness found in a run and the generation at which the individual with that best fitness was discovered) averaged over many different runs of the GA on the same problem.
IV. RESULT AND DISCUSSION
This section presents some results obtained by applying the optimization approach. For given specification in [5] the decimation factor of multistage component is calculated using GA.
Example 1
To illustrate the above design approach we choose to design a decimator with the following specifications. = 0.05
= 0.005
∆f = 0.1
D=20
= 10 kHz.
From the literature we can obtain values for and from the proposed approach we will find the optimum decimation ratio for K=2 and K=3 and K=4.These results are compiled in Table 1 along with computed .
Case1: Considering two stage decimator for K=2 optimum decimation ratios are D1= 10.39, D2=1.92 and value of is 71750.
Case 2: Considering three stage decimator for K=3 optimum decimation ratio are D1= 5.94, D2= 2.48, D3=1.35 and value of is 65000.
ISSN (Print) : 2320 – 3765 ISSN (Online): 2278 – 8875
I
nternational
J
ournal of
A
dvanced
R
esearch in
E
lectrical,
E
lectronics and
I
nstrumentation
E
ngineering
(An ISO 3297: 2007 Certified Organization)
Vol. 4, Issue 1, January 2015
The results of the optimization problem considering different number of stages are shown in Table I.
Table I: Value of minimum computation load S, objective function for D=20 , ∆f=0.1and varying number of
stages K.
No.of stages K S
1 20.0 325000 2 3.8 71750 3 3.0 65000 4 3.0 67950
Above table shows that minimum computation is required for K=3 for same set of specifications. Now the results of proposed approach for K=3 are compared with set of eligible decimation factors chosen by the previous two approaches . A suitable initial estimate for D1 for iterative method is chosen by [5] so that the bounds on initial population of decimation factor of first stage can be set. One more assumption is that the minimum decimation factor of further stages must be bound near 2 as having decimation factor 1 converts the problem in less stage decimation .The result of generation with best fitness is averaged and the numerical value of the individual matches with the results in [20].
Table II: Comparison of proposed approach results with previous methods for D=20 and ∆f=0.1.
As GA gives different result in each run due to randomness results for 100 runs are then averaged. These decimation ratios have been given in decimal form in order to allow direct comparison with [1]. In practice, the ratios must take integer values and for the above case the values may be D1= 6, D2= 2, D3=2 . Specifically, this implies that the overall decimation rate should be chosen to be highly composite (nonprime) for high rates. These points are discussed in more detail where some guidelines for delivering integer-valued rates are presented [5].
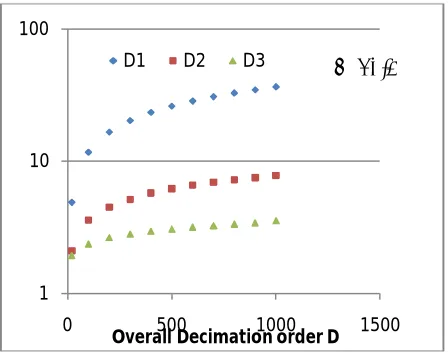
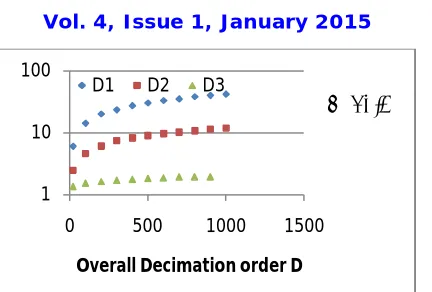
In addition decimation rates D1 , D2 , and D3 = D/D1D2 are plotted on a log–log scale for K = 3 stages using
the results of proposed approach for ∆f =0.5 and ∆f= 0.1 in Fig.3.
1 10 100
0 500 1000 1500
Overall Decimation order D
D1 D2 D3 ∆ f=0.5
Prev. Method 1 Prev. method2 Proposed (Avg.value) approach
D1 D2 D 3
D1 D2 D3 D1 D2 D3
5.9 2.4 1. 4
6.03 2.4 6
1.3 5
ISSN (Print) : 2320 – 3765 ISSN (Online): 2278 – 8875
I
nternational
J
ournal of
A
dvanced
R
esearch in
E
lectrical,
E
lectronics and
I
nstrumentation
E
ngineering
(An ISO 3297: 2007 Certified Organization)
Vol. 4, Issue 1, January 2015
Fig. 3 Decimation rates D1 , D2 , D3 for varying overall decimation rate D for K = 3 stages using the results of
proposed approach. The normalized transition bandwidth ∆f is in Fig.1(a) is 0.5, in Fig.1(b) is 0.1.
Example 2: Here proposed approach is used to find individual decimation factor for a high value of D.
D= 1000 = 0.05 = 0.005
∆f = 0.1 = 10 kHz.
Case1: Considering two stage decimator for K=2 optimum decimation ratios are D1= 40.1, D2=24.93 and value of is 1105865.
Case2: Considering three stage decimator for K=3 optimum decimation ratios are D1= 40.95, D2=14.27 and D3= 1.71 and value of is 23143.
Considering three stage decimator for K=4 optimum decimation ratios are D1= 30.22, D2=3.98and D3= 3. 86 and D4= 2.1and value of is 21967.
Comparing the above results the K=4 case i.e. four stage decimator has minimum value of multiplies and adds per second (MADS).So multistage decimator with above specification and decimation ratio as high as 1000 can be implemented using 4 stage decimation using above approach.
V. CONCLUSION
In this paper, novel signal processing technique is proposed using genetic algorithm for optimization of individual decimation ratio of multirate multistage decimators by minimizing multiplication and addition per second of the filter . For the class of multistage decimators considered in [1], independent decimation ratios are calculated and compared . The proposed multistage decimator design method uses genetic algorithm technique for any specification set even of higher decimation ratio in a successful way.
REFERENCES
[1] Crochiere R. E. and Rabiner, L. R. 1975.“Optimum FIR digital filter implementations for decimation, interpolation, and narrowband filtering,”IEEE Trans. Acoust., Speech Signal Processing, vol. ASSP-23, 444.
[2] Cliffs Englewood Multirate Digital Signal Processing., NJ:Prentice-Hall, 1983.
[3] Krukowski A., Kale I, Hein K., and. Cain G. D,1994 “A design technique for polyphase decimators,” in Proc. 2nd Int. Symp. on DSP for Communications Systems( Apr 1994). 26–29.
[4] Kale I., Morling R. C. S., Krukowski A., and Tsang C.-W 1995.“A highfidelity decimator chip for the measurement of sigma-delta modulator performance,” IEEE Trans. Instrum. Meas., vol. 44 (Oct.1995), 933–939.
[5] Feinleib R. E. and 2001 “Analysis, design, and implementation of a digital multistage subband tuner,” TRW Syst. Information. Technol. Rev. J.,23, Spring/Summer 2001.
[6] Shively R. R 1975 “On multi-stage FIR filters with decimation,” IEEE Trans.Acoust., Speech, Signal Processing, vol. ASSP-23, 1975 [7] Holland J. H 1975. Adaption in Natural and Artificial Systems. Cambridge, MA: MIT Press.
[8] Van Nostrand Reinhold. 1991 Handbook of Genetic Algorithms. New York.
[9] Goldberg D. E 1995 Genetic Algorithms in Search, Optimization, and Machine Learning.
[10] Beasley D., Bull D. R. , and. Martin R. R 1993 “An overview of genetic algorithms: Part I-Fundamentals,” Univ. Comput., vol. 15, no. 2, 58-69.
1 10 100
0 500 1000 1500
Overall Decimation order D
D1 D2 D3
ISSN (Print) : 2320 – 3765 ISSN (Online): 2278 – 8875
I
nternational
J
ournal of
A
dvanced
R
esearch in
E
lectrical,
E
lectronics and
I
nstrumentation
E
ngineering
(An ISO 3297: 2007 Certified Organization)
Vol. 4, Issue 1, January 2015
[11] D Beasley D., Bull D. R. , and. Martin R. R 1993, “An overview of genetic algorithms: Part 2-Research topics,”Univ. Comput., vol. 15, no. 4, pp. 170-181.
[12] Srinivas M. , and Patnaik L. M 1994. “Genetic algorithms: A survey,” Computer(june 1994) 17-26.
[13] Whitley D. 1993 “A genetic algorithm tutorial,” Dept. Comput. Sci, Colorado State Univ., Tech. Rep. CS-93-103, [14] Haupt, Randy. Haupt, Sue 2004. Practical Genetic Algorithms. Second edition. New Jersey: John Wiley & Sons
[15] Mahfoud S. W.,1994 “Population sizing for sharing methods,” Dept. Comput. Sci.,Univ. Illinois at Urbana-Champaign, IlliGAL Rep. 94005 [16] Pan H. and Wang I. Y 1991.“The bandwidth allocation of ATM through genetic algorithm,”IEEE GLOBECOM ‘91, 125-129. [17]. Chou L.-D. and. Wu J.L.C. 1995. “Buffer management using genetic algorithms and neural networks,” IEEE GLOBECOM ’95, 1333-1337. [18] Shimamoto N., Hiramatu A., and Yamasaki K. 1993. “A dynamic routing control based on a genetic algorithm,” 1993 IEEE International Conference on Neural Network,1123-1128.
[19] Palmer C. C. and Kershenbaum A 1993. Two algorithms for finding optimal communication spanning trees.Technical Report, IBM T. J. Watson Research Center, Yorktown Heights, NY.
[20] Coffey M.W. 2003 “Optimizing multistage decimation and interpolation processing,” IEEE Signal Process. Lett., Vol. 10,No. 4, pp. 107-110, Apr. 2003.
[21] Coffey M.W. 2007 “Optimizing multistage decimation and interpolation processing – part II,” IEEE Signal Process. Lett., Vol. 14, No. 1, 24-26, Jan. 2007.
[22] DE Troncoso Romero, M Laddomada”Optimal Sharpening of Compensated Comb Decimation Filters: Analysis and Design “The ScientificWorldJournal Volume 2014.