Scholarship@Western
Scholarship@Western
Electronic Thesis and Dissertation Repository
8-30-2013 12:00 AM
In situ High-Pressure Studies of Energetic Materials by Vibrational
In situ High-Pressure Studies of Energetic Materials by Vibrational
Spectroscopy and X-ray diffraction
Spectroscopy and X-ray diffraction
Liang Zhou
The University of Western Ontario
Supervisor Yang Song
The University of Western Ontario
Graduate Program in Chemistry
A thesis submitted in partial fulfillment of the requirements for the degree in Master of Science © Liang Zhou 2013
Follow this and additional works at: https://ir.lib.uwo.ca/etd
Part of the Physical Chemistry Commons
Recommended Citation Recommended Citation
Zhou, Liang, "In situ High-Pressure Studies of Energetic Materials by Vibrational Spectroscopy and X-ray diffraction" (2013). Electronic Thesis and Dissertation Repository. 1592.
https://ir.lib.uwo.ca/etd/1592
This Dissertation/Thesis is brought to you for free and open access by Scholarship@Western. It has been accepted for inclusion in Electronic Thesis and Dissertation Repository by an authorized administrator of
(Thesis format: Integrated-Article)
By
Liang Zhou
Graduate Program in Chemistry
A thesis submitted in partial fulfillment
of the requirements for the degree of
Master of Science
The School of Graduate and Postdoctoral Studies
The University of Western Ontario
London, Ontario, Canada
ii
Abstract
Nitrogen-rich materials have been considered as the most promising replacement of
traditional energetic materials due to the large energy difference between the different
nitrogen allotropes. Apart from the traditional chemical synthesis, high-pressure technique
had been proved an effective tool to create such kinds of materials. Here we report studies of
four promising precursors, 5-aminotetrazole, 5-methyltetrazole, 5,
5´-bis(2-methyltetrazolyl)amine monohydrate and cyanuric triazide, under high pressure by Raman
and IR spectroscopy. 5, 5´-bis(2-methyltetrazolyl)amine monohydrate and cyanuric triazide
were also studied using X-ray diffraction. Besides, the high-pressure behavior of s-triazine
was also investigated to understand the properties of cyanuric triazide.
Firstly, 5-aminotetrazole and 5-methyltetrazole were investigated to examine the pressure
effects on the ring structures and the high-pressure behaviors. No phase transitions for
5-aminotetrazole were found in the whole pressure range. However, four phase transitions were
observed for 5-methyltetrazole, evidenced by the by the appearance of new lattice modes, the
changes in peak profile as well as the pressure dependence of Raman lattice modes. Upon
decompression, the tetrazole ring vibration modes in both compounds were fully recovered,
suggesting the tetrazole ring had very high stability.
Then 5, 5´-bis(2-methyltetrazolyl)amine monohydrate was investigated by vibrational
spectroscopy and X-ray diffraction. All the result suggested there were no phase transitions
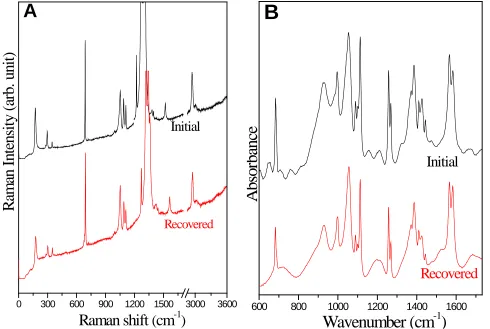
in the entire investigated pressure range. Upon decompression, all the Raman and IR modes
were completely recovered, indicating the reversibility and high stability of this material.
At last, triazine and cyanuric triazide were studied. A total of four phase transitions for
s-triazine were observed, evidenced by changes in peak profile, the number of vibrational
modes, as well as the pressure dependence of Raman lattice modes over different pressure
ranges. The transition was identified irreversible for the lattice modes were not recovered
upon decompression. In addition, a ring-opening reaction took place, suggested by the
recovered Raman and IR internal modes. For cyanuric triazide, no phase transitions were
observed in the pressure range of 0-26 GPa and one chemical reaction above 26 GPa. In
addition, the transition was partially irreversible evidenced by the different Raman profiles in
iii
Keywords
High pressure · Diamond anvil cell · Vibrational spectroscopy · X-ray diffraction ·
Nitrogen-rich materials · Energetic materials · Polymeric nitrogens · Phase transitions · Ring-opening
iv
The Co-Authorship Statement
I hereby declare that this thesis I made a major contribution to the work in the experimental
design, data analysis and interpretation. Prof. Yang Song is a co-author on all materials
presented in this thesis and played a major role in the editing and revision of the materials
presented in all chapters.
The 5, 5´-bis(2-methyltetrazolyl)amine monohydrate in chapter 3 and the cyanuric triazide in
chapter 4 were synthesized by Prof. Muralee Murugesu’s group in the University of Ottawa.
High-pressure properties of 5, 5´-bis(2-methyltetrazolyl)amine monohydrate was simulated
by Dr. Anguang Hu in Defence Research and Development Canada-Suffield. The Raman
spectra of s-triazine and the IR spectra of cyanuric triazide were measured by undergraduate
student Erica Till under my supervision.
I am aware of the University of Western Ontario Policy on Authorship and I certify that I
have properly acknowledged the contribution of other researchers to my thesis.
I certify that, with the above qualifications, this thesis, and the research to which it refers, is
v
Acknowledgements
First of all, I would like to acknowledge my advisor Prof. Yang Song for his exceptional
supervision, encouragement and guidance during the past two years, without which my
graduate studies would not have been possible. His passion and enthusiasm are something I
will always admire. I also would like to thank my collaborators, Prof. Muralee Murugesu and
Dr. Anguang Hu for all their input. In addition, I thank for Prof. Nicholas C. Payne and Prof.
T. K. Sham for their excellent teaching.
I would also like to thank all the members of the Song’s group (Yue Hu, Zhihao Yu and
Ankang Zhao and Haiyan Mao) as well as the former group members (Zhaohui Dong and
Vinod Panchal). Thank for their help during the past two years and the happiness brought to
me.
Special thanks to all of my friends (Zhiqiang Wang & Ruiping Ge, Xiaoxuan Guo, Michael
Wu, Yixing Tang, Peng He, Yiyi Liu, Rachel Wang & Jinqiang Hou, Fuyan Zhao &
Fangfang Zhou, Dong Zhao, Jian Chen, Lu Zhang, Lijia Liu, Sonia Lin, Renjie Hou, Jun Xu,
Junwei Sun, Jun Li, Bo Fan, Nazhen Liu, Donghan Chen, Yu Sun, Jia Jia, Ming Huang,
Jiacheng Guo, Jing Zhang, Jing Chao, Xiangrong Zhang, Mengdi Fan, Cong Bi, Lei Wang,
Huilei Zhao, Changmiao Guo, Qichang Meng and Yuan Wang). I really missed those happy
times we enjoyed together!
In addition, I thank the help from Darlene McDonald, Clara Fernandes, Anna Vandendvrie,
Barakat Misk, John Vanstone, Jon Aukema and Monica Chirigel.
Finally I would like to thank my parents for their love, understanding and unconditional
vi
Table of Contents
Abstract ... ii
Keywords ... iii
The Co-Authorship Statement ... iv
Acknowledgements ... v
Table of Contents ... vi
List of Figures ... xi
List of Tables ... xiv
List of Abbreviations ... xv
Chapter 1 Introduction ... 1
1.1 Energetic materials and nitrogen-rich energetic materials ... 1
1.1.1 Energetic materials ... 1
1.1.2 Nitrogen-rich energetic materials ... 1
1.2 High-pressure science and technology ... 2
1.2.1 High-pressure phenomena ... 2
1.2.2 Diamond anvil cell ... 2
1.2.4 High-pressure characterization tools ... 4
1.2.4.1 High-pressure vibrational spectroscopy ... 4
1.2.4.2 High-pressure powder X-ray diffraction facility ... 7
1.3 High-pressure studies of energetic materials ... 8
vii
1.5 References ... 9
Chapter 2 In situ high-pressure study of 5-aminotetrazole and 5-methyltetrazole by Raman and IR spectroscopy ... 12
2.1 Introduction ... 12
2.2 Experimental Section ... 14
2.2.1 Sample preparation ... 14
2.2.2 High-pressure Raman measurements ... 14
2.2.3 High-pressure IR measurements ... 15
2.3 Results ... 15
2.3.1 5-ATZ ... 15
2.3.1.1 Ambient-pressure Raman and IR spectra ... 16
2.3.1.2 Raman spectra on compression ... 18
2.3.1.3 IR spectra on compression ... 18
2.3.1.4 Pressure effects on Raman and IR modes ... 21
2.3.1.5 Raman and IR spectra on decompression ... 23
2.3.2 5-MTZ ... 25
2.3.2.1 Ambient-pressure Raman and IR spectra ... 25
2.3.2.2 Raman spectra on compression ... 27
2.3.2.3 Pressure dependence of lattice modes ... 27
2.3.2.4 IR spectra on compression ... 31
2.3.2.5 Pressure effects on IR N-H off-plane mode ... 32
viii
2.4 Discussion ... 33
2.5 Conclusion ... 36
2.6 Acknowledgements ... 37
2.7 References ... 37
Chapter 3 In situ high-pressure study of 5, 5´-bis(2-methyltetrazolyl)amine monohydrate by vibrational spectroscopy and X-ray diffraction ... 41
3.1 Introduction ... 41
3.2 Experimental Section ... 42
3.2.1 Sample preparation ... 42
3.2.2 High-pressure Raman and IR measurements... 42
3.2.3 High-pressure XRD measurements ... 43
3.3 Results ... 43
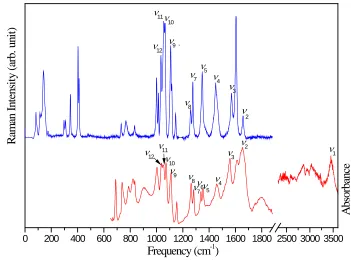
3.3.1 Raman and IR spectra of BTA·H2O at ambient-pressure ... 43
3.3.2 Raman spectra on compression ... 44
3.3.3 IR spectra on compression ... 46
3.3.4 Pressure effects on Raman and IR modes ... 47
3.3.5 Raman and IR spectra on decompression ... 49
3.3.6 XRD patterns on compression and decompression ... 49
3.4 Discussion ... 52
3.5 Conclusion ... 53
3.6 Acknowledgements ... 53
ix
Chapter 4 In situ high-pressure study of s-triazine and cyanuric triazide by vibrational
spectroscopy and X-ray diffraction ... 56
4.1 Introduction ... 56
4.2 Experimental Section ... 57
4.2.1 Sample preparation ... 57
4.2.2 High-pressure vibrational spectroscopy and XRD measurements ... 58
4.3 Results ... 58
4.3.1 S-triazine ... 58
4.3.1.1 Near ambient-pressure Raman and IR spectra ... 58
4.3.1.2 Raman spectra on compression ... 60
4.3.1.3 Pressure depndence of Raman lattice modes ... 62
4.3.1.4 IR spectra on compression ... 62
4.3.1.5 Raman and IR spectra on decompression ... 64
4.3.2 CTA ... 66
4.3.2.1 Ambient-pressure Raman and IR spectra ... 66
4.3.2.2 Raman spectra on compression ... 67
4.3.2.3 IR spectra on compression ... 69
4.3.2.4 Pressure effects on Raman and IR modes ... 70
4.3.2.5 Raman and IR spectra on decompression ... 70
4.3.2.6 XRD pattern of CTA on compression and decompression ... 73
4.4 Discussion ... 74
x
4.6 Acknowledgements ... 78
4.7 References ... 78
Chapter 5 Summary and future work ... 80
References ... 80
Appendix: Rietveld refinement ... 82
xi
List of Figures
Fig. 1.1 General schematic of a symmetric diamond anvil cell ... 3
Fig. 1.2 Ruby fluorescence spectra at different pressures ... 4
Fig. 1.3 Photo of the customized Raman system ... 5
Fig. 1.4 Schematic of the customized IR system ... 6
Fig. 1.5 Photo of the customized powder x-ray facility ... 7
Fig. 2.1 Molecular structure of 5-ATZ (A) and 5-MTZ (B) ... 13
Fig. 2.2 1H-form and 2H-form of 5-ATZ ... 13
Fig. 2.3 Raman and IR spectra of 5-ATZ at ambient condition ... 16
Fig. 2.4 Selected Raman spectra of 5-ATZ on compression ... 19
Fig. 2.5 Selected IR spectra of 5-ATZ on compression ... 20
Fig. 2.6 Pressure dependence of Raman shifts of 5-ATZ on compression ... 22
Fig. 2.7 Pressure dependence of IR frequencies of 5-ATZ on compression ... 23
Fig. 2.8 Selected Raman spectra of 5-ATZ on decompression ... 24
Fig. 2.9 Selected IR spectra of 5-ATZ on decompression ... 25
Fig. 2.10 Raman and IR spectra of 5-MTZ at ambient condition ... 26
Fig. 2.11 Selected Raman spectra of 5-MTZ on compression in the lattice region ... 28
Fig. 2.12 Selected Raman spectra of 5-MTZ on compression in the internal modes region .. 29
Fig. 2.13 Pressure dependence of Raman lattice modes of 5-MTZ on compression... 30
Fig. 2.14 Selected IR spectra of 5-MTZ on compression ... 31
xii
Fig. 2.16 Comparison of recovered Raman and IR spectra of 5-MTZ ... 34
Fig. 2.17 1H-form and 2H-form of 5-MTZ ... 36
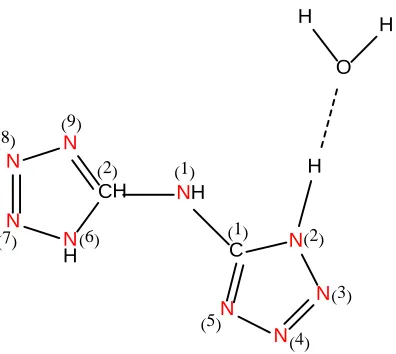
Fig. 3.1 Molecular structure of BTA·H2O ... 42
Fig. 3.2 Raman and IR spectra of BTA·H2O at ambient condition ... 43
Fig. 3.3 Selected Raman spectra of BTA·H2O on compression ... 45
Fig. 3.4 Selected IR spectra of BTA·H2O on compression ... 46
Fig. 3.5 Pressure dependence of Raman shifts (A) and IR modes (B) of BTA·H2O on compression ... 48
Fig. 3.6 Selected Raman spectra of BTA·H2O on decompression ... 50
Fig. 3.7 Selected IR spectra of BTA·H2O on decompression... 51
Fig. 3.8 Selected XRD patterns of BTA·H2O on decompression ... 51
Fig. 4.1 Molecular structure of s-triazine (A) and CTA (B) ... 57
Fig. 4.2 Raman and IR spectra of s-triazine at ambient condition ... 59
Fig. 4.3 Selected Raman spectra of s-triazine on compression ... 61
Fig. 4.4 Pressure dependence of Raman lattice modes of s-triazine on compression ... 63
Fig. 4.5 Selected IR spectra of s-triazine on compression ... 64
Fig. 4.6 Selected Raman (A) and IR (B) spectra of s-triazine on decompression ... 65
Fig. 4.7 Raman and IR spectra of CTA at ambient condition... 66
Fig. 4.8 Selected Raman spectra of CTA on compression ... 68
Fig. 4.9 Selected IR spectra of CTA on compression ... 69
Fig. 4.10 Pressure dependence of Raman shifts (A) and IR frequencies (B) ... 71
xiii
Fig. 4.12 Evolution of sample color changes at different pressures ... 73
Fig. 4.13 X-ray diffraction patterns of CTA on compression and decompression at selected
pressures. ... 74
Fig. A1 Rietveld refinement of XRD pattern for BTA·H2O at 0.12 GPa. ... 82
xiv
List of Tables
Table 2.1 Assignment and frequencies (cm−1) of observed Raman and IR internal modes of 5-ATZ in comparison with reference values……… ..17
Table 2.2 Assignment andfrequencies (cm−1) of observed Raman and IR internal modes of 5-MTZ in comparison with reference values. ... 26
Table 2.3 Pressure dependence (dv/dP) of the Raman lattice modes for different phases. .... 30
Table 3.1 Assignment and frequencies (cm−1) of observed Raman and IR internal modes of BTA·H2O in comparison with reference values. ... 44
Table 4.1 Assignment andfrequencies (cm−1) of observed Raman and IR internal modes of s-triazine in comparison with reference values………...60
Table 4.2 Pressure dependence of the Raman lattice modes for different phases. ... 63
Table 4.3 Assignment and frequencies (cm-1) of observed Raman and IR internal modes of CTA in comparison with reference values. ... 67
Table 4.4 Summary of observed high-pressure solid phases of s-triazine in comparison with
xv
List of Abbreviations
TNT Trinitrotoluene
RDC 1,3,5-trinitrohexahydro-1,3,5-triazine
HMX 1,3,5,7-tetranitro-1,3,5,7-tetrazacyclooctane
GPa Giga-pascal
DAC Diamond anvil cell
XRD X-ray diffraction
DPSS Diode pumped solid state
CCD Charge-coupled device
FTIR Fourier transform infrared
MCT Mercury cadmium telluride
KB Kirkpatrick-Baez
CL-20 Hexanitrohexaazaisowurtzitane
5-ATZ 5-aminotetrazole
5-MTZ 5-methyltetrazole
BTA·H2O 5, 5´-bis(1H-tetrazolyl)amine monohydrate BTA 5, 5´-bis(1H-tetrazolyl)amine
CTA Cyanuric triazide
Asym Asymmetric
Sym Symmetric
Fig. Figure
Tet. Tetrazole
Chapter 1 Introduction
1.1 Energetic materials and nitrogen-rich energetic materials
1.1.1 Energetic materials
Energetic materials are defined as those with high enthalpies of formation, which can release
gases and energy stored within their molecular structures upon stimulus by heat, impact,
shock, spark, etc.1-3 Energetic materials have been used extensively for both civilian and military applications, such as air bags, fireworks, mining, munitions, anti-missile decoy
flares.4-8 Based on different functions, they may be broadly classified into three categories: pyrotechnics, propellants (including gas generators) and explosives. Pyrotechnics, which
undergo combustion at visibly observable rates, usually generate coloured smoke/light and
noise. Propellants undergo more rapid combustion than pyrotechnics but do not detonate,
usually accompanied by a crackling sound and flames. Explosives involve fast detonation,
giving rise to shock wave and the release of a large amount of energy.2
1.1.2 Nitrogen-rich energetic materials
Conventional energetic materials, such as trinitrotoluene (TNT),
1,3,5-trinitrohexahydro-1,3,5-triazine (RDX), 1,3,5,7-tetranitro-1,3,5,7-tetrazacyclooctane (HMX), which usually
consist of a carbon-hydrogen fuel component and an oxygen-rich, nitro-oxidizing component,
release most of their energy from oxidation of the carbon backbones.9 Recently, growing scientific interests have been directed towards the design and synthesis of nitrogen-rich
energetic materials,10-13 which are made up with only nitrogen, carbon and hydrogen atoms. Such materials have the potential to release substantial energy during decomposition because
they could convert the energetic N-N and C-N bonds to form molecular nitrogen, which pose
significantly lower environment and safety hazards than conventional energetic materials.14,15
In 2004, Eremets et al.16 synthesized the diamond-like nitrogen, in which all the nitrogen atoms were linked by single bonds, directly from nitrogen gas at temperatures above 2,000 K
and pressures above 110 giga-pascal (GPa). This material could be considered energetic
because there is a large energy difference between the single bonded and triple bonded
synthesizing energetic materials. However, diamond-like nitrogen could not been recovered
at ambient pressure and the experimental condition of synthesizing this material was too
extreme. Based on this, it would be worthwhile to explore conditions of synthesizing
materials with similar single bonded nitrogen network at lower temperature and pressure.
Therefore, in the next several sections, I will discuss the principles of the high-pressure
technique and its implications on the study of energetic materials.
1.2 High-pressure science and technology
1.2.1 High-pressure phenomena
Pressure, which could span over 60 orders of magnitude in the universe,17 is a thermodynamic function of paramount importance for chemical equilibrium and chemical
kinetics.18 By reducing the volume available for the system, the free-energy change related to the compression can be in excess of 10 eV. Due to pressure-induced changes in chemical
affinities, the reactivities of elements and compounds that we are familiar with at ambient
conditions are completely altered, and totally new classes of materials with unusual chemical
and physical properties can be formed.19 For example, superhard material could be formed from carbon dioxide at high pressures,20 iodine21 and oxygen22 will undergo the insulator-to-metal transition at high pressures. Moreover, the application of pressure provides an ideal
method to delicately tune electronic, magnetic, structural, and vibrational properties for
testing fundamental theory and a range of applications.19
1.2.2 Diamond anvil cell
In order to generate high pressure, devices, such as diamond anvil cells (DAC), which could
generate pressures up to ~360 GPa, were developed and improved in the past two
decades.23,24 Diamonds are known as the hardest material in nature and could be used as anvils to generate high pressure. Moreover, diamonds are transparent to a wide spectral range
of electromagnetic radiation, therefore, various probes, such as vibrational spectroscopy and
X-ray diffraction, could be used to characterize properties of materials at high pressures in
The basic principle of the DAC is very simple and is shown in Fig. 1.1. A stainless steel
gasket, which is drilled with a hole at the center and used to contain the sample, is
sandwiched between a pair of identical and brilliant-cut diamond anvils, which are mounted
on two tungsten carbide seats. The size of the tips of the diamond anvils are from 100 to 700
µm, which decide the maximum pressure the system could reach.
Fig. 1.1 Opposed diamond anvil configuration, with a metal gasket for sample confinement
in a pressure medium; the basic part of the DAC. (Adapted form Ref. 23)
1.2.3 The ruby pressure gauge
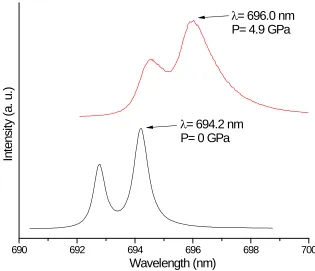
In order to measure the pressure reliably and accurately, ruby fluorescence method is well
established.26-28 Ruby is Al2O3 doped with Cr3+, which emits luminescent peaks R1 and R2 when excited by lasers. The position of R1 peak is very sensitive to pressures and an equation can be used to describe the relationship between pressure and the wavelength of R1 line.
−
+
∆
=
1
24
.
694
1
1904
BB
P
λ
(1.1)where P is the pressure in GPa and ∆λ is the difference between the wavelength of the ruby
high pressure. (Fig. 1.2) The parameter B equals to 7.665 for quasi-hydrostatic conditions,
and equals to 5 for non-hydrostatic conditions.28 Using this method, the resolution of the pressure can be achieved to ± 0.05 GPa.
690 692 694 696 698 700
λ= 694.2 nm P= 0 GPa
Int
ens
ity
(
a.
u.
)
Wavelength (nm)
λ= 696.0 nm P= 4.9 GPa
Fig. 1.2 Ruby R1 fluorescence spectra at 0 GPa (in black) and at 4.9 GPa (in red) at room temperature.
1.2.4 High-pressure characterization tools
In this study, vibrational spectroscopy and powder X-ray diffraction are used to characterize
the high-pressure properties of materials.
1.2.4.1 High-pressure vibrational spectroscopy
Both Raman and IR spectroscopy are very powerful tool in terms of providing information
regarding molecular structures, chemical bonding and changes in the circumstances.
However, they have different selection rules. Raman is based on the changes of polarizability
of a molecule while IR depends on the changes of molecular dipole moment. So usually a
mode could be either Raman-active or IR-active, or active to both probes. In very rare
vibrations, IR and Raman spectroscopy are supplementary to each other by providing a
whole picture of molecular vibrations.
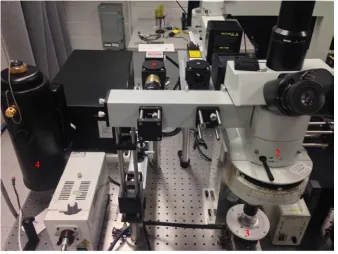
A customized Raman micro-spectroscopy system was used to collect the Raman spectra. The
photo of this Raman system is shown in Fig. 1.3. A single longitudinal mode, diode pumped
solid state (DPSS) green laser with wavelength 532.10 nm was used as the excitation source.
The laser was focused to < 5 μm on the sample by a 20× Mitutoyo objective. The Raman
signal was detected with backscattering geometry by the same objective lens. The Rayleigh
scattering was removed by a pair of notch filters. The scattered light was then dispersed using
an imaging spectrograph equipped with a 1200 lines/mm grating achieving a 0.1 cm−1 resolution. The Raman signal was recorded using an ultrasensitive, liquid nitrogen cooled,
back-illuminated, charge-coupled device (CCD) detector from Acton. The system was
calibrated by neon lines with an uncertainty of ± 1 cm−1.29
Fig. 1.3 Photo of the customized Raman micro-spectroscopy system. 1: DPSS green laser; 2:
Mitutoyo objective; 3: sample stage; 4: CCD dectector.
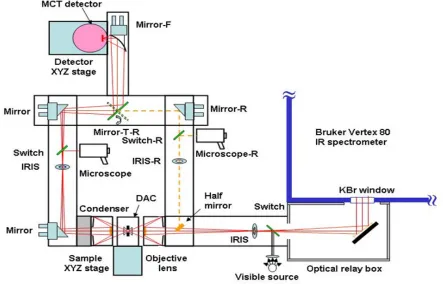
A customized IR microspectroscopy system was used for all room-temperature IR absorption
measurements. Figure 1.4 shows the schematic diagram of the system. A commercial Fourier
transform infrared (FTIR) spectrometer from Bruker Optics Inc. (Model Vertex 80v)
system, which was operated under a vacuum of < 5 mbar, such that the absorption by H2O and CO2 was efficiently removed. A collimated IR beam was directed into a relay box through a KBr window on the spectrometer. The beam was then focused onto the sample in
the DAC by an iris optics and 15× reflective objective lens with a numerical aperture of 0.4.
The size of the IR beam was set to be identical to the entire sample size (e.g., ~ 130 μm) by a
series of iris apertures. The transmitted IR beam was collected using another identical
reflective objective as the condenser, and was directed to a wide-band mercury cadmium
telluride (MCT) detector equipped with a ZnSe window that allows measurements in the
spectral range of 600 to 12000 cm−1. The customized spectroscopy system also allows IR measurements in the reflection mode using reflective optics via the optical path shown in Figure 1.4. All measurements were undertaken in transmission (or absorption) mode. A
resolution of 4 cm−1 and 512 scans were applied for each spectrum measurement, achieving an excellent signal-to-noise ratio. The reference spectrum, i.e., the absorption of diamond
anvils loaded with KBr but without any sample, was later divided as background from each
sample spectrum to obtain the absorbance.29
Fig. 1.4 Schematic diagram of the IR micro-spectroscopy system. All major optical
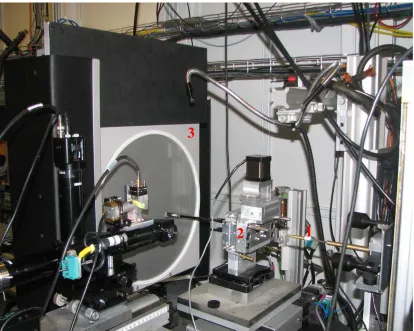
1.2.4.2 High-pressure powder X-ray diffraction facility
Different from IR and Raman spectroscopy, which can provide us information on the
molecular vibrations or the microenvironment changes, XRD focuses more on the crystal
structure. In high-pressure studies, due to the anvils of DAC and small sample sizes, X-ray
diffraction measurements can only be performed with intense high energy X-ray beam and
very small beam size (e.g., tens of microns), which can hardly be achieved in local X-ray
diffraction facilities using Co, Cu, and Mo as the excitation sources. Therefore, synchrotron
radiation source becomes the best choice for high-pressure research due to its wide energy
range, brightness and the fine beam size.30
Fig. 1.5 Photo of the powder X-ray diffraction facility. 1: X-ray beam; 2: sample stage; 3:
MAR3450 image plate.
The HPCAT 16-BM-D, shown in Fig. 1.5, is a general purpose x-ray diffraction beamline for
samples under high pressure and high temperature, typically in DACs. The X-ray energy can
and the energy range covers 6-45 keV normally. The monochromatic X-ray beam is focused
by Kirkpatrick-Baez (KB) type mirrors both in vertical and horizontal dimensions, which
normally provide 5 mm (H) x 12 mm (V) beam size (FWHM) at the sample. Using a large
area detector (typically MAR3450 Image Plate or MARCCD on request) powder and single
crystal diffraction experiments are commonly conducted. On the precisely aligned
diffractometer center within sub-micron to a micron precision, various types of DACs
assemblies housed in cryostat and/or external resistive heater are mounted to provide precise
diffraction information.31
1.3 High-pressure studies of energetic materials
Usually, the shock wave caused by the decomposition of energetic materials will lead to high
pressure and high temperature, which will often induce solid phase transitions or initiate
chemical reactions.3 Thus, it is very important to model and understand their characteristics and behaviour under the extreme conditions of their operation.32 Up to now, extensive papers of experimental and computational methods to characterize decomposition, combustion, and
detonation of energetic materials have been published. Three general methods have been
used to study these materials at high pressures, which are computational studies, dynamic
shock-wave studies, and direct static compression, respectively. Allowing a wide range of
pressures and temperatures to be explored easily, computational studies are particularly
useful to the study of energetic materials, and could provide detailed information about
reaction rates and possible mechanisms under extreme conditions. Shock-wave method
involves the use of explosive charge or a gas gun that fires a high-velocity projectile at the
material under study. Direct static compression typically involves compression of the sample
in a DAC, and has the potential to provide information about changes in lattice parameters,
equations of state, the response of intermolecular interactions to pressure,33,34 which was employed in this thesis.
Conventional energetic materials, such as RDX33,35,36, HMX37,38 and hexanitrohexaazaisowurtzitane (CL-20)1,39, have been studied under high pressure extensively during the past years. Most of them will undergo phase transformations under
high pressure, and exhibit different sensitivity to stimulus, chemical reactivity, crystal density
showed similar result that new polymorphs existed under high pressure.9,14,40-43 For example, polymerization of nitrogen in sodium azide could take place at above 50 GPa.44 Therefore, it is promising to synthesize new energetic materials with single-bonded nitrogen network
using high pressure as a tool to tune the structure.
1.4 Objective and thesis structure
Among the many nitrogen-rich energetic materials mentioned above, four materials,
5-aminotetrazole (5-ATZ), 5-methyltetrazole (5-MTZ), 5, 5´-bis(1H-tetrazolyl)amine
monohydrate (BTA·H2O), cyanuric triazide (CTA) were studied under high pressure by vibrational spectroscopy and powder X-ray diffraction. The main theme of my thesis is to
examine the structures and properties of those four nitrogen-rich materials under high
pressure to see whether those precursors will form polymeric nitrogens. All these four
materials have been studied extensively for their decomposition mechanisms. However, the
high-pressure behaviour of those four materials have not been examined and understood.
Therefore, the understanding of the structures of those precursors is of great importance for
the exploration of energetic materials.
Chapter 2 will mainly discuss the high-pressure studies of two tetrazole derivatives, 5-ATZ
and 5-MTZ, respectively. Chapter 3 and chapter 4 focus on the high-pressure study of
BTA·H2O and CTA, respectively. In order to better understand the high-pressure behavior of CTA, s-triazine, which has the similar structure with CTA, was also studied in chapter 4.
1.5 References
(1) Millar, D. I. A.; Maynard-Casely, H. E.; Kleppe, A. K.; Marshall, W. G.; Pulham, C.
R.; Cumming, A. S. Cryst. Eng. Comm.2010, 12, 2524.
(2) Akhavan, J. The Chemistry of Explosives, Cambridge, UK: Royal Society of
Chemistry, 2004.
(3) Millar, D. I. A.; Marshall, W. G.; Oswald, I. D. H.; Pulham, C. R. Crystallogr. Rev.
2010, 16, 115.
(4) Gao, H.; Shreeve, J. M. Chem. Rev.2011, 111, 7377.
(5) Li, Z.; Xie, S.; Zhang, J.; Feng, J.; Wang, K.; Zhang, T. J. Chem. Eng. Data2012, 57,
(6) Klapötke, T. M.; Stierstorfer, J. r.; Wallek, A. U. Chem. Mater.2008, 20, 4519.
(7) Badgujar, D. M.; Talawar, M. B.; Asthana, S. N.; Mahulikar, P. P. J. Hazard. Mater.
2008, 151, 289.
(8) Huynh, M. H. V.; Hiskey, M. A.; Chavez, D. E.; Naud, D. L.; Gilardi, R. D. J. Am.
Chem. Soc.2005, 127, 12537.
(9) Ciezak, J. A. Propellants Explos. Pyrotech.2010, 35, 550.
(10) Peiris, S. M.; Russell, T. P. J. Phys. Chem. A2003, 107, 944.
(11) Klapötke, T. M.; Sabaté, C. M. Chem. Mater.2008, 20, 1750.
(12) Srinivas, D.; Ghule, V. D.; Tewari, S. P.; Muralidharan, K. Chem. Eur. J.2012, 18,
15031.
(13) Dippold, A. A.; Klapotke, T. M.; Oswald, M. Dalton Trans.2013, 42, 11136.
(14) Behler, K. D.; Ciezak J., J. A.; Sausa, R. C. J. Phys. Chem. A2013, 117, 1737.
(15) McWilliams, R. S.; Kadry, Y.; Mahmood, M. F.; Goncharov, A. F.; Ciezak J., J. J.
Chem. Phys.2012, 137, 054501.
(16) Eremets, M. I.; Gavriliuk, A. G.; Trojan, I. A.; Dzivenko, D. A.; Boehler, R. Nat.
Mater.2004, 3, 558.
(17) Weir, C. E.; Lippincott, E. R.; Valkenburg, A. V.; Bunting, E. N. In J. Res. Natl. Bur.
Stand. 1959, 63, 55.
(18) Schettino, V.; Bini, R. Phys. Chem. Chem. Phys.2003, 5, 1951.
(19) Hemley, R. J. Annu. Rev. Phys. Chem.2000, 51, 763.
(20) Iota, V.; Yoo, C. S.; Cynn, H. Science1999, 283, 1510.
(21) Riggleman, B. M.; Drickamer, H. G. J. Chem. Phys.1963, 38, 2721.
(22) Akahama, Y.; Kawamura, H.; Häusermann, D.; Hanfland, M.; Shimomura, O. Phys.
Rev. Lett.1995, 74, 4690.
(23) Jayaraman, A. Rev. Mod. Phys.1983, 55, 65.
(24) Jeanloz, R. Aunu. Rev. Phys. Chem. 1989, 40, 237.
(25) Tapper, R. J. Rep. Prog. Phys.2000, 63, 1273.
(26) Mao, H. K. Science1978, 200, 1145.
(27) Xu, J. A.; Mao, H. K.; Bell, P. M. Science1986, 232, 1404.
(28) Mao, H. K.; Xu, J.; Bell, P. M. J. Geophys. Res-Solid1986, 91, 4673.
(29) Dong, Z. Ph. D. thesis, 2012.
(31) HPCAT 16BMD User Manual.
(32) Pulham, C. R.; Millar, D. I. A.; Oswald, I. D. H.; Marshall, W. G. High-Pressure
Crystallography: From fundamental Phenomena to Technological
Applications-NATO Science for Peace and Security Series B: Physics and Biophysics; Springer,
New York, 2010; pp 447-457.
(33) Fabbiani, F. P. A.; Pulham, C. R. Chem. Soc. Rev.2006, 35, 932.
(34) Shaw, R. W.; Brill, T. B.; Thompson, D. L. In Overviews Of Recent Research On
Energetic Materials, Advanced Series in Physical Chemistry, World Publishing,
Singapore, Vol. 16, 2005.
(35) Oswald, I. D. H.; Millar, D. I. A.; Davidson, A. J.; Francis, D. J.; Marshall, W. G.;
Pulham, C. R.; Cumming, A.; Lennie, A. R.; Warren, J. E. High Pressure Res. 2010,
30, 280.
(36) Dreger, Z. A.; Gupta, Y. M. J. Phys. Chem. B2007, 111, 3893.
(37) Yoo, C.-S.; Cynn, H. J. Chem. Phys.1999, 111, 10229.
(38) Sorescu, D. C.; Rice, B. M.; Thompson, D. L. J. Phys. Chem. A1999, 103, 989.
(39) Russell, T. P.; Miller, P. J.; Piermarini, G. J.; Block, S. J. Phys. Chem. 1993, 97,
1993.
(40) Ciezak, J. A. Propellants Explos. Pyrotech.2010, 35, 373.
(41) Ciezak, J. A. Propellants Explos. Pyrotech.2010, 35, 24.
(42) Ciezak, J. A. Propellants Explos. Pyrotech.2011, 36, 446.
(43) Ciezak, J. A. AIP Conf. Proc.2012, 1426, 1424.
(44) Eremets, M. I.; Popov, M. Y.; Trojan, I. A.; Denisov, V. N.; Boehler, R.; Hemley, R.
Chapter 2 In situ high-pressure study of aminotetrazole and
5-methyltetrazole by Raman and IR spectroscopy
2.1 Introduction
Diamond-like polymeric nitrogen network, in which all the nitrogen atoms were linked by
the N-N single bonds, was synthesized directly from molecular nitrogen at pressures above
110 GPa and temperatures above 2,000 K by M. Eremets et al.1. It is considered as a high energy density material because different nitrogen allotropes exhibit a uniquely large
difference in energy between the single bond and the triple bond, and therefore, a large
amount of energy will be released by transformation from the single-bonded form to N2. However, the polymeric nitrogen phase is only metastable under the above mentioned
extreme conditions such that it transforms back to molecular nitrogen at ambient conditions.
Therefore, efforts have been made to synthesize the recoverable polymeric nitrogens using
different precursors under different conditions.2-4
Recent years, new energetic materials, especially nitrogen-rich or polynitrogen compounds5-9, such as tetrazole-containing compounds or tetrazole salts10-13 have attracted increasing attention. Due to their own aromatic ring systems, tetrazoles often release large amounts of
energy by decomposition and have good thermal stability as well as the high nitrogen
content.14 Thus, the tetrazole ring could allow the preparation of primary15,16 and secondary12,13 explosives with high performance. In addition, tetrazoles produce more nitrogen gas per gram than most of the high energy materials, resulting in inherently cooler
combustion products, which is an attractive feature for gun propellants and gas generators.17
Containing 82.3% nitrogen by weight and used as gas generator agent for air bag inflator18,19 and solid propellant20, 5-aminotetrazole (5-ATZ) has received extensive experimental and theoretical studies about its decomposition mechanism at high temperature21-25. However, the existing experimental data on the thermal decomposition of the 5-ATZ are often
contradictory. Under ambient pressure, three phases of 5-ATZ have been known up to its
melting point, among which only one phase has been structurally characterized. Phase I was
crystallizes into an orthorhombic cell under ambient conditions with space group P212121 (D24) and cell parameters a = 5.088 Å, b = 3.664 Å, c = 18.040 Å, and V = 336.3 Å3, with molecular structure shown in Fig. 2.1 (A). Different from the 5-ATZ molecules in gas phase,
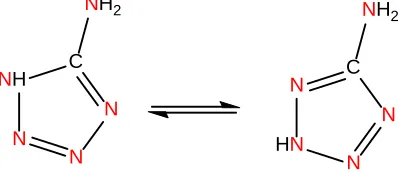
which are mainly in 2H-form27,28, molecules in the crystal are in 1H-form26, consistent with previous published papers29 and is shown in Fig. 2.2. Moreover, 5-ATZ molecules are also known to be linked by extensive hydrogen bonds, which have a great influence on the
stability and density for energetic materials. When 5-ATZ had been heated at 448 K after 13
h and 100 h, phase II and phase III could be observed by powder XRD, but the structures had
not been solved.30
Fig. 2.1 (A) Molecular structure of 5-ATZ Fig. 2.1 (B) Molecular structure of 5-MTZ
NH
N N
N C
NH2
N
HN N
N C
NH2
Fig. 2.2 1H-form and 2H-form of 5-ATZ
Previous research on materials with hydrogen bond networks showed that hydrogen bonds
played an important role in altering the compressibility, stability as well as the reactiveness
under high pressure.31-33 In order to minimize the effect of hydrogen bonds on the high pressure behavior of tetrazole ring, another tetrazole derivative 5-methyltetrazole (5-MTZ),
which replaces the amino group in 5-ATZ by a methyl group and has weaker hydrogen bonds,
was studied as a comparison. Under ambient conditions, 5-MTZ crystallizes into a
monoclinic cell with space group Cc and cell parameters a = 4.586 Å, b = 12.843 Å, c =
Since high-pressure technique has been demonstrated an effective approach in greatly
increasing the electronic density so as to trigger chemical reactions, especially when
unsaturated chemical bonds are present35. Therefore, we could use high pressure as a driving force to break the N=N bonds and form N-N bonds between adjacent molecules in order to
synthesize polymeric nitrogens. In this study, we report the first in situ high-pressure Raman
and IR measurements on 5-ATZ and 5-MTZ, which were compressed up to about 57 GPa in
DACs. Interestingly, no phase transitions were found for 5-ATZ while four phase transitions
were observed for 5-MTZ during the whole investigated pressure range.
2.2 Experimental Section
2.2.1 Sample preparation
5-ATZ with ~98% purity was purchased from Santa Cruz Biotechnology, and 5-MTZ with
~97% purity was purchased from Sigma-Aldrich. Both chemicals were used without further
purification. A symmetrical DAC with two type-I diamonds with 250 μm culets was used for
the high-pressure Raman measurements, while a pair of type-II diamonds with a culet size of
350 μm was used for the IR measurements. 5-ATZ was loaded in a MBraun LAB Master 130
glovebox filled with N2 atmosphere (< 10 ppm O2 and H2O) and without any fluid pressure-transmitting medium to accommodate the hygroscopicity of the material. One ruby (Cr3+ doped α-Al2O3) chip as the pressure calibrant was carefully placed inside the sample chamber before the sample was loaded. The pressure was determined by using the R1 ruby fluorescence line shift with an accuracy of ± 0.05 GPa under quasi-hydrostatic conditions.36 For IR measurements, spectral quality KBr powders were also loaded into the DAC used
both as pressure transmitting medium and to dilute the sample.
2.2.2 High-pressure Raman measurements
A customized Raman micro-spectroscopy system was used to collect the Raman spectra. A
single longitudinal mode, diode pumped solid state (DPSS) green laser with wavelength
532.10 nm was used as the excitation source. The laser was focused to < 5 μm on the sample
by a 20× Mitutoyo objective. The Raman signal was detected with backscattering geometry
by the same objective lens. The Rayleigh scattering was removed by a pair of notch filters.
lines/mm grating achieving a 0.1 cm−1 resolution. The Raman signal was recorded using an ultrasensitive, liquid nitrogen cooled, back-illuminated, charge-coupled device (CCD)
detector from Acton. The system was calibrated by neon lines with an uncertainty of ± 1
cm−1. To avoid the strong first-order Raman mode of diamond at 1334 cm−1, the spectra were collected in ranges of 0-1300 cm−1 and 1350-3400 cm−1 in several collection windows. For each spectrum, a collection time of 30 s was employed, and the average laser power on the
sample was maintained at ~ 30 mW.
2.2.3 High-pressure IR measurements
A customized IR microspectroscopy system was used for all room-temperature IR absorption
measurements. A commercial Fourier transform infrared (FTIR) spectrometer from Bruker
Optics Inc. (Model Vertex 80v) equipped with Globar mid-IR light source constituted the
main component of the micro-IR system, which was operated under a vacuum of < 5 mbar,
such that the absorption by H2O and CO2 was efficiently removed. A collimated IR beam was directed into a relay box through a KBr window on the spectrometer. The beam was then
focused onto the sample in the DAC by an iris optics and 15× reflective objective lens with a
numerical aperture of 0.4. The size of the IR beam was set to be identical to the entire sample
size (~ 130 μm) by a series of iris apertures. The transmitted IR beam was collected using
another identical reflective objective as the condenser, and was directed to a wide-band
mercury cadmium telluride (MCT) detector equipped with a ZnSe window that allows
measurements in the spectral range of 600 to 12000 cm−1. All measurements were undertaken in transmission (or absorption) mode. A resolution of 4 cm−1 and 512 scans were applied for each spectrum measurement, achieving an excellent signal-to-noise ratio. The reference
spectrum, i.e., the absorption of diamond anvils loaded with KBr but without any sample,
was later divided as background from each sample spectrum to obtain the absorbance.
2.3 Results
2.3.1.1 Ambient-pressure Raman and IR spectra
Raman and IR spectra were collected at ambient conditions as the starting point and are
shown in Fig. 2.3. Compared to the IR study by Jonassen et al.37 and Levchik et al.38 on condensed phase and standard spectrum39 of 5-ATZ, our measurements are in close agreement with theirs as can be seen from Table 2.1. We followed the assignment proposed
by Jonassen et al.37 and labeled the modes accordingly in Table 2.1. In addition, we also observed five Raman bands at 76, 93, 123, 138 and 147 cm-1 in the lattice region.
0
200
400
600
800 1000 1200 1400 1600
3000 3500 4000
5
4
3
1
ν
19ν
18ν
17ν
17ν
16ν
15ν
15ν
13ν
14ν
13ν
12ν
11ν
11ν
10ν
10ν
9ν
8ν
8ν
7ν
6ν
5ν
4ν
ν
76ν
5ν
4ν
3ν
2
ν
1ν
3ν
2Frequency (cm
-
1
)
R
am
an I
nt
ens
it
y (
ar
b.
uni
t)
IR
A
bs
or
ba
nc
e
ν
12
Fig. 2.3 Raman spectrum of 5-ATZ (top) in comparison with IR spectrum (bottom) in the
spectral region 0-4000 cm−1,both collected at near ambient pressure and room temperature. The omitted spectral regions are due to the lack of spectroscopic features. The assignment of
Table 2.1 Assignment and frequencies (cm−1) of observed Raman and IR internal modes of 5-ATZ in comparison with reference values.
Mode Description This work References
Raman IR IR37 IR38
ν1 N-H stretch 3382 3416 3390 3420
ν2
ν3
N-H stretch 3306 3331 3311 3350
Ring N-H stretch 3216 3212 3175 3200
ν4 N-H bending 1673 1675 1680
ν5 N-H bending 1652 1631 1655
ν6 Endo C=N stretch a ?
1589 1590 1585 1590
ν7 1490 1491 1490
ν8 N=N ring stretch 1457 1456 1439 1455
ν9 ? 1372 1373
ν10 Exo C-N stretch b 1265 1265 1263 1265
ν11 Ring vibration 1141 1144 1140 1145
ν12 Ring vibration 1092 1087 1070
ν13 Ring vibration 1069 1068 1064 1050
ν14 Ring vibration 1049 1043
ν15 ? 1001 1000 1000
ν16 N-H rocking 771 766 775
ν17 N-H rocking 744 736 734 740
ν18 ?
?
678
ν19 433
5 Lattice mode 147
4 Lattice mode 138
3 Lattice mode 123
2 Lattice mode 93
1 Lattice mode 76
a
Endo C=N stretch refers to the CN stretching mode inside the aromatic ring.
b
2.3.1.2 Raman spectra on compression
Starting from ambient pressure, Raman spectra of 5-ATZ were collected upon compression
to 56.7 GPa with selected spectra depicted in Fig. 2.4. As can be seen, upon compression to
2.7 GPa, the intensity of mode 2 in the lattice region was strengthened slightly and mode 4
was found to split into a doublet, labeled as 4A and 4B, respectively. At the same time, a very weak peak (labeled as v13A) appeared in the range of ring vibration modes, which was likely caused by the modification of ring structures during compression. With further compression,
at 13.7 GPa, all the modes were weakened and a new mode, possibly corresponding to N-H
bending v5, began to appear. Upon subsequent compression to 19.3 GPa, all the lattice modes were significantly weakened and broadened, indicating that the structure had been disordered.
In addition, above 19.3 GPa, mode ν19 was found to split with the intensity increase of mode
ν5. At the highest pressure, 56.7 GPa, the significantly weakened and broadened feature of lattice modes suggest the lattice structure had been amorphous. In addition, the ring vibration
modes still persisted but other internal modes were completely depleted.
2.3.1.3 IR spectra on compression
Mid-IR spectra of 5-ATZ were collected on compression to 37.7 GPa. Selected absorption
spectra as a function of pressure in the spectral region of 600-3600 cm−1 are depicted in Fig. 2.5 (A). Because of the weak absorbance of mode v8 and v9, thicker sample was used to monitor the changes in the spectral region of 1310-1590 cm-1 during compression, shown in Fig. 2.5 (B). At low pressures, IR patterns in the region of 600-1800 cm-1 showed no prominent changes upon compression. At 3.4 GPa, as can be seen from Fig. 2.5 (B), mode v9 was strengthened significantly with increasing intensity until 19.0 GPa, accompanied by the
splitting of N=N stretching mode v8 at 8.3 GPa and subsequent weakening. All of the above evidence strongly indicated that the N=N bond was weakened by the delocalization of
electrons in the tetrazole ring upon compression. With further compression to the highest
pressure, at 37.7 GPa, the ring vibration features still existed but with more broadened and
weakened profiles.
19 Fig. 2.4 Selected Raman spectra of 5-ATZ collected at room temperature upon compression in the region of 0-1800 cm−1at pressures of 0-56.7 GPa. The spectra ranging from 1800-3600 cm-1 were omitted because of the weak intensity. The pressures in GPa are labeled for each spectrum. The assignments are labeled for Raman modes (see text).
0 200 400 600 800 1000 1200 1600 1700 1800
4
B
4A
0
1.2
2.7
4.0
8.6
13.7
19.3
30.3
40.7
56.7
Raman shift (cm
-1)
R
am
an I
nt
ens
it
y (
ar
b.
uni
t)
12 3 4
5
ν
13Aν
5ν
15ν
13ν
6×
3
ν
4ν
1120 600 800 1000 1200 1400 1600 1800 2800 3200 3600
ν
1Βν
1Αν
3Cν
3Βν
3ΑWavenumber
(cm
-1)IR
A
bs
or
ba
nc
e
0.1 0.9 1.8 3.5 10.0 16.4 18.8 27.4 37.7A
ν
18ν
17ν
16ν
13ν
15ν
14ν
12
ν
11ν
10ν
8ν
8ν
6ν
5ν
4ν
3ν
2ν
11350 1400 1450 1500 1550
ν
9 IR A b s o rb a n c eWavenumber
(cm
-1)0.1 1.0 2.0 3.4 10.3 16.6 19.0 28.5 35.7 8.3
B
ν
8GPa, a new mode v3A appeared on the shoulder of v3. With further compression, mode v3 was found to split into a doublet (v3B/v3C) and v3c merged with v3A at 27.4 GPa. Then v3B shifted to lower frequency with pressure. Compared to the red shift of mode v1 and v3, mode v2 didn’t shift at first and merged with mode v1 into a singlet at 10.0 GPa, which then split into a doublet (v1A/v1B) at 16.4 GPa. Above 16.4 GPa, the frequency of v1A didn’t change at the beginning and then slight blue shift could be observed with the decrease in intensity until it
totally disappeared at 27.4 GPa. One of the components of the N-H stretching mode v1B, however, shifted to higher frequency to the highest pressure.
2.3.1.4 Pressure effects on Raman and IR modes
The pressure dependence of the observed Raman and IR modes of 5-ATZ were examined by
plotting the vibrational frequencies as a function of pressure as shown in Fig. 2.6 and 2.7.
Generally, in the range of 0-2000 cm-1 all the Raman and IR modes exhibited pressure-induced blue shifts, consistent with that the bonds become stiffened upon compression. For
the internal modes in this region, the frequency of these modes increased linearly with
increasing pressure, indicating there were no phase transitions during compression. At the
same time, the splitting of some modes was observed during compression, which was likely
caused by the change of molecular orientation or the enhanced interaction between molecules
within the unit cell. For the modes in the range of 2400-3600 cm-1, very obvious red shifts of the ring N-H vibration mode and the amino N-H stretching mode were caused by the
strengthening of intermolecular hydrogen bonds during compression. According to Fujihisa
et al.’s XRD results and theoretical calculations of 5-ATZ26, under high pressure, the ring N-H bond length displayed the highest increasing rate, and the amino N-N-H bond length
increased at the beginning but almost ceased to change at 11.6 GPa, which were precisely
consistent with red shifts of N-H stretching mode in this work. Then the N-H stretching
modes v1A and v1B shifted to higher frequency, indicating that the intermolecular hydrogen bonds became weaker and the N-H bond length became shorter. Overall, the Raman and IR
spectra collectively suggested that no phase transitions and chemical reactions during whole
22
0 2 4 6 8 10 12 14 16 18
80 100 120 140 160 180 200 220 240 260 280
5
4
B4
A3
2
Pressure (GPa)
R
am
an s
hi
ft
(
cm
-1)
1
A
0 5 10 15 20 25 30 35 40 45 50 55 60 400 500 600 700 800 900 1000 1100 1200 1600 1700 1800
ν
19Aν
19Bν
19ν
17Aν
17ν
13Bν
13Aν
15ν
13ν
11ν
6ν
5Pressure (GPa)
R
am
an s
hi
ft
(
cm
-1)
ν
4B
Fig. 2.6 Pressure dependence of Raman lattice modes (A) and internal modes (B) of 5-ATZ on compression. Different symbols represent
0 5 10 15 20 25 30 35 40 600
800 1000 1200 1400 1600 1800 3000 3200 3400 3600
ν3A ν3C
ν3B ν2
ν1Β
Pressure (GPa)
W
ave
num
be
r
(
cm
-1 )
ν1Α
Fig. 2.7 Pressure dependence of IR modes of 5-ATZ on compression. Different symbols
represent IR modes with different origins of assignments.
2.3.1.5 Raman and IR spectra on decompression
Raman and IR spectra were also collected on decompression all the way down to
near-ambient pressure in order to better understand the pressure-induced structural evolutions and
the high-pressure stability of 5-ATZ. Starting from 56.7 GPa, Raman spectra of 5-ATZ were
collected upon decompression to near-ambient with selected spectra depicted in Fig. 2.8.
Mid-IR spectra of 5-ATZ were collected from 37.7 GPa to near ambient pressure, with
selected absorption spectra as a function of pressure in the spectral region of 600-3600 cm−1 depicted in Fig. 2.9. During decompression, very strong hysteresis could be observed and
lattice modes were not recovered upon decompression to near-ambient pressure, meaning
that lattice during the compression/decompression cycle was irreversible in the pressure
were recovered, with the difference being that the peaks were broadened and the intensity
was lower, which could be associated with the disordering of crystal structures during
compression. And v13A, first appeared in the compression process, didn’t vanish after decompression, which was very likely due to the modification of ring structures by the high
pressures.
0 200 400 600 800 1000 1200 1600 1800 Recovered
1.0 2.5 5.3 35.6 56.7
10.8 16.5 29.1
Initial
×0.5
Raman shift
(
cm
-1)
R
am
an
In
te
n
sity
(a
rb
.
u
n
it)
ν
13AFig. 2.8 Selected Raman spectra of 5-ATZ collected at room temperature on decompression
in the region of 0-1800 cm−1at pressures of 0-56.7 GPa. The pressures in GPa are labeled for each spectrum.
Similar to the Raman spectra, very strong hysteresis could be observed in the IR spectra
during decompression, shown in Fig. 2.9. Compared to the compression process, at 16.1 GPa,
weakening of hydrogen bonds during decompression. The different IR band shape and
intensity could be associated with the modification of the sample thickness in the
compression/decompression cycle.
600 800 1000 1200 1400 1600 1800 2400 2800 3200 3600
ν
15BWavenumber (cm
-1)
IR
A
bs
or
ba
nc
e
Recovered 1.8 3.7 8.5 13.6 19.0 37.7
Initial 16.1
ν
15AFig. 2.9 Selected IR spectra of 5-ATZ collected at room temperature on decompression in the
spectral region of 600-3600 cm−1 in the pressure region of 0.3-37.7 GPa. The pressures in GPa are labeled for each spectrum.
2.3.2 5-MTZ
2.3.2.1 Ambient-pressure Raman and IR spectra
Raman and IR spectra were collected at ambient conditions as the starting point and shown in
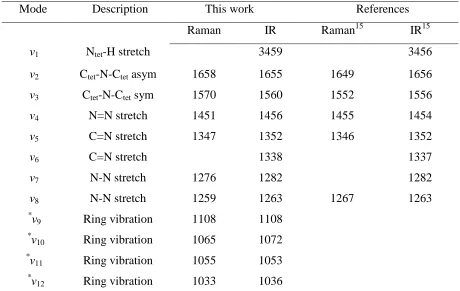
Fig. 2.10. We followed the assignment proposed by Matveeva et al.40 and labeled some assigned modes accordingly in Table 2.2. As can be seen, N-H stretching mode is very weak
weaker in 5-MTZ than that in 5-ATZ. As a result, in IR measurements only spectra below
1800 cm-1 were collected.
0 200 400 600 800 1000 1200 1400 1600 2400 2800 3200
Frequency (cm-1)
R am an I nt ens it y ( ar b. uni t) IR A bs or ba nc e
ν
7ν
7ν
6ν
6ν
5ν
5ν
4ν
3ν
3ν
2ν
1Fig. 2.10 Raman spectrum of 5-MTZ (top) in comparison with IR spectrum (bottom) in the
spectral region 0-3550 cm−1 both collected at ambient conditions. The omitted spectral regions are due to the lack of spectroscopic features. The assignment of the vibrational
modes is labeled above each.
Table 2.2 Assignment and frequencies (cm−1) of observed Raman and IR internal modes of 5-MTZ in comparison with reference values.
Mode Description This work References
Raman IR IR1 Theory1
v1 C-H stretch 2943
v2 C=N stretch 1583 1580 1582
v3 N=N stretch 1441 1444 1440 1445
v4 C-N and N-N stretch, N-H deformation
1266 1268 1260 1261
v5 1257 1250 1250
v6 N-H off-plane 929 928 920 933
2.3.2.2 Raman spectra on compression
Starting from ambient pressure, Raman spectra of 5-MTZ were collected upon compression
to 57.9 GPa with selected spectra depicted in Figs. 2.11 and 2.12 in the lattice modes region
and internal modes region, respectively. As can be seen, in the lattice region, no lattice
modes were observed at ambient pressure. Upon further compression, a total of five Raman
modes were observed in the lattice region, labeled from 1 to 5 from low to high frequencies.
When compressed to 0.8 GPa, two lattice modes at 72 and 92 cm-1 (labeled as 2 and 3) appeared, among which mode 3 disappeared upon compression to 2.6 GPa. Further
compression to 6.6 GPa resulted in the appearance of another two lattice modes at 116 and
181 cm-1 (labeled as 1 and 4). Additional lattice mode at 252 cm-1 (labeled as 5) was observed upon subsequent compression to 29.7 GPa. Each of the occurrences of a new lattice
mode indicates a possible phase transition. For the internal modes in Fig. 2.12 (A), when
compressed to 0.8 GPa, a new mode (labeled as v7A) appeared on the shoulder of the N-H off-plane stretching mode v7. Then at 3.9 GPa, v7A split into a doublet (labeled as v7B and v7C), followed by the splitting of v7 (labeled as v7D and v7E) at 5.8 GPa. The similar splitting also occurred to N=N stretching mode v3 and C-H stretching mode v1. The N=N stretching mode
v3 first split into a doublet (labeled as v3A and v3B) at 2.6 GPa, among which v3A disappeared upon further compression to 5.8 GPa, accompanied by the splitting of v3B into a doublet (labeled as v3C and v3D) at the same time. Then both the doulet v3C and v3D gained intensity and persisted to the highest pressure 57.9 GPa. For the C-H stretching mode v1, a broad peak labeled as v1A evolved on its shoulder at 2.6 GPa and then split into a doublet (labeled as v1B and v1C) at 3.9 GPa. At the highest pressure 57.9 GPa, all the internal modes were significantly weakened and with broadened profiles.
2.3.2.3 Pressure dependence of lattice modes
The observed evolutions of the Raman profile in both the lattice and internal mode regions
indicate pressure-induced phase transitions. By plotting the pressure dependence (dv/dP) of
the lattice mode, the transition boundaries as well as the transition mechanism may be better
understood. The pressure dependence of the Raman shifts of the lattice modes of 5-MTZ is
presented in Fig. 2.13 and Table 2.3. The slopes of Raman shifts were determined by linear
28
0
50
100
150
200
250
300
350
R
am
an i
nt
ens
it
y (
a.
u.
)
Raman shift (cm
-1)
2 3
0 GPa
0.8
2.6
6.6
29.7
57.9
2
2
1
4
1
2 4 5
1
2
5
29
200 300 400 500 600 700 800 900 1000 1100 1200
ν7E ν7D
ν7C ν7Β ν7Α 0 GPa 0.8 2.6 5.2 5.8 29.7 57.9
Raman shift (cm-1)
R am an i nt ens it y ( ar b. uni t) 2.1 3.1 3.9 ν7
A
1200 1300 1400 1500 1600 1700 1800
ν4
ν3D ν3C
ν3B ν3A
0 GPa 2.1 3.9 5.2 5.8 29.7 57.9
Raman shift (cm-1)
R am an i nt ens it y ( ar b. uni t) 0.8 2.6 3.1
B
ν3 diamond2800 2900 3000 3100 3200 3300 3400 3500
ν1C ν1Β ν1Α 0 GPa 3.1 3.9 57.9 0.8 2.1 2.6 5.2 5.8 29.7
Raman shift (cm-1)
R am an i nt ens it y ( ar b. uni t) ν1
C
Fig. 2.12 Selected Raman spectra of 5-MTZ collected at room temperature on compression in the spectral region of 150-1200 cm−1 (A), 1200-1800 cm-1 (B), 2800-3500 cm-1 (C) in the pressure region of 0-57.9 GPa. The spectra ranging from 1800-2600 cm-1 were omitted because of the weak intensity. The pressures in GPa are labeled for each spectrum. The assignments are labeled for Raman modes (see
0 5 10 15 20 25 30 35 40 45 50 55 60 60 80 100 120 140 160 180 200 220 240 260 280 300 320
V
IV
III
Pressure (GPa)
R
am
an s
hi
ft
(
cm
-1
)
1
2
3
4
5
II
Fig. 2.13 (Color online) Raman shift of 5-MTZ as a function of pressure on compression in
the lattice mode region. Solid straight lines are linear fits to the data. Vertical dashed lines
marked the suggested phase transition boundaries. Different symbols denote lattice modes
with different origins with numbers labeled from low to high frequencies. See text and Fig.
2.11.
Table 2.3 Pressure dependence (dv/dP) of the Raman lattice modes for different phases.
Lattice mode
Raman shift (cm-1)
Pressure (GPa) a
dv/dP (cm-1/GPa) Phase II (0.8-7 GPa) Phase III (7-30 GPa) Phase IV (30-40 GPa) Phase V (40-58 GPa)
1 116 6.7 4.0 3.5 1.1
2 72 0.8 11.8 4.4 3.4 1.1
3 92 0.8 22.4
4 181 6.7 3.5 3.0
5 252 29.7 3.9 1.4
a
increasing pressure, which clearly outlined the phase boundaries (labeled as I, II, III, IV and
V).
2.3.2.4 IR spectra on compression
600 800 1000 1200 1400 1600 1800
Wavenumber
(cm
-1)A
bs
or
ba
nc
e
0.1 1.9 3.9 10.6 30.1
20.6
ν
2ν
3ν
4ν
5ν
6ν
7ν
7Bν
7AFig. 2.14Selected IR spectra of 5-MTZ collected at room temperature on compression in the
spectral region of 600-1800 cm−1 in the pressure region of 0.1-30.1 GPa. The pressures in GPa are labeled for each spectrum. The assignments are labeled for IR modes (see text).
Mid-IR spectra of 5-MTZ were collected on compression to 30.1 GPa. Selected absorption
spectra as a function of pressure in the spectral region of 600-1800 cm−1are depicted in Fig. 2.14. Similar to the Raman measurements, the v7 mode began to split into a doublet labeled as
v7A and v7B at 1.9 GPa. The discrepancy of the splitting pressure in Raman and IR measurements was likely due to the different origin of the doublets. Then with increasing
first, and then shifted to higher frequency, which was likely due to the strengthening and
weakening of hydrogen bonds in different respective pressure regions. At the highest
pressure 30.1 GPa, the IR profile changed significantly, indicating possible transitions
occurred during compression.
2.3.2.5 Pressure effects on IR N-H off-plane mode
Since hydrogen bonds play an important role in altering the compressibility, stability as well
as the reactiveness of energetic materials under high pressure,31-33 tracing the changes of hydrogen bonds in 5-MTZ may help explain the high-pressure behavior as well as the
possible transition mechanism. The pressure dependence of the N-H off-plane mode v6 of 5-MTZ were examined by plotting wavenumbers as a function of pressure as shown in Fig.
2.15. As can be seen, the change of mode v6 could be divided into two stages. First it redshifted with increasing pressure until 12.5 GPa, which could be interpreted as the
strengthening of the hydrogen bond. Then followed by the blueshift to 30.1 GPa, suggesting
the hydrogen bond was weakened.
0 2 4 6 8 10 12 14 16 18 20 22 24 26 28 30 32 34
840 850 860 870 880 890 900 910 920 930 940
W
av
enum
ber
(
cm
-1