Supplementary Materials:Classical and Novel TSPO Ligands for the Mitochondrial TSPO can Modulate
Nuclear Gene Expression: Implicationsfor Mitochondrial Retrograde Signaling
Nasra Yasin, Leo Veenman, Moshe Gavish, Maya Azrad, Alex Vainshtein and Bea Caballero
This supplementary files provide the comprehensive details of the pathway analysis with Ingenuity IPA® for all time
points assayed (15, 30, 45 minutes, 1, 3, and 24 hours), including presentations of 'Regulators', 'Data Sets', and
'Effects' . Note: the 'Data Sets' are genes with changed gene expression that are associated with 'Regulators' that
via the genes in question are known to exert particular 'Effects' . The 'Effects' pertain to functions, phenotypes, and
diseases.
The images are supported by lists and tables, clarifying the acronyms, and gene symbols.
Also the canonical pathways for functional implications of changes in gene expression due to the PK 11195 (25 µM)
Supplementary file 1 : 15 minutes of exposure to 25 µM of PK 11195 of U118MG cells (canonical pathway of figure 1 in the manuscript indicating that within 15 minutes of exposure to 25 µM of PK 11195 genes are upregulated for components that are part of the canonical pathway for regulation of gene expression).
Supplementary file 2 : 15 minutes of exposure to 25 µM of PK 11195 of U118MG cells (Figure 2 in ms.)
Potential effects on cellular functions due to the significant changes in gene expression as induced by 15 minutes of exposure of U118MG cells to PK 11195 (25 µM). The pathway analysis (Regulator Effects analytic IPA® applying adjusted p ≤ 0.05) indicates multiple interactive upstream pathways ('Regulators' given in the upper tier) related to the genes with significantly changed expression ('Data Set' given in the middle tier), together with the various downstream functions ('Effects' in the bottom tier). This whole configuration can be annotated as a super-assembly (see text for more detailed explanation). Color coding: In the 'Data Set' (middle tier): pink/red = upregulated, green = down regulated. In the 'Effects' (bottom tier) and in the 'Regulators' (top tier) the predictions are indicated by orange = upregulated.
Regulators
Data Set
Effects A'
B'
C'
D'
E'
a
b
c
d
Supplementary file 3 : 15 minutes of exposure of U118MG cells to PK 11195 (25 µM). This is the list of 'Regulators' of the figure of file 2, detailing their knownmodulation of the genes of the 'Data Set' and the consequential 'Effects'.
This Table corresponds to Table 1 in the manuscript
Table Supplementary file 3. Details regarding the 'Regulators' of Figure in supplementary file 2. The list of primed capital lettering (first column) matches the 'Regulators' marked with the same lettering in the upper tier of Figure 2. The acronyms of the 'Regulators are given (second column). The molecular type of the 'Regulators' is summarized (third column). The gene symbols of the target genes of each of the 'Regulators' are listed (fourth column). Upregulation of gene expression is indicated in 'bold font' and the corresponding arrows. Downregulation is indicated in 'greyfont' and downward pointing arrows. The final 'Effects' (fifth column) induced by the 'Regulators' and their targeted genes, are indicated with lower case lettering in the fifth column, according to the same lettering in Figure 2 marking the 'Effects' in the lower tier. Thus each Regulator affects a group of genes associated with a group of functions. Furthermore, these groups of genes and functions overlap. This configuration is defined as a super-assembly (see text for more detailed explanations).
Effects Target genes in dataset with changed expression p < 0.05
Molecule Type Upstream
Regulator
a,c,e CYR61↑, MYC↑, SGK1↑, CXCL8↑, FOS↑, DUSP1↑, EGR1↑
Complex (Extracellular Space)
PDGF BB A'
a,b,c,d,e MYC↑, SGK1↑, CXCL8↑, FOS↑, DUSP1↑, EGR1↑,ID1 ↓
tumor necrosis factor
TNF B'
a,b,c,e MYC↑, CXCL8↑, FOS↑, DUSP1↑, EGR1↑
epidermal growth factor
EGF C'
a,b,d,e MYC↑, SGK1↑, CXCL8↑, FOS↑, EGR1↑
signal transducer and activator of transcription 3
STAT3 D'
b CYR61↑, MYC↑, ID1↓
Cytokin Wnt family member 3A
Supplementary file 4 : 30 minutes of exposure to 25 µM of PK 11195 of U118MG cells
The Genes of the 'Data Set' (middle tier) from left to right : SPRY1, TXNIP, DUSP1, SGK1, ATF3,NR4A2, CTGF, MYC, HBEGF, EGR1, FOS, CXCL8, PTGS2, KLF6, RGS2, ID1, CYR61, EGR2, NFKBIZ
Potential effects on cellular and tissue functions due to the significant changes in gene expression as induced by 30 minutes of exposure of U118MG cells to PK 11195 (25 µM). The pathway analysis (Regulator Effects analytic IPA® applying adjusted p ≤ 0.05) indicates multiple interactive upstream pathways ('Regulators' given in the upper tier) related to the genes with
significantly changed expression ('Data Set' given in the middle tier), together with the various downstream functions ('Effects' in the bottom tier). This whole configuration can be annotated as a super-assembly (see text for more detailed explanations). Color coding: In the 'Data Set' (middle tier): pink/red = upregulated, green = down regulated. In the 'Effects' (bottom tier) and in the 'Regulators' (top tier) the predictions are indicated by blue = downregulated, and orange = upregulated. The row of gene symbols at the bottom of the figure are those of the middle tier ('Data Set') of this figure presented in the same sequence from left to right. The color coding indicates upregulation (red) and downregulation (blue).
Regulators
Data Set
A' B'
C' D'
E' F' G'
H' I' J'
K' L' M' N' O' P' Q' R'
S' T'
U' V'
W X'
Y' Z'
a b
c d
e f
g
h
i
j k
l
Effects
m n
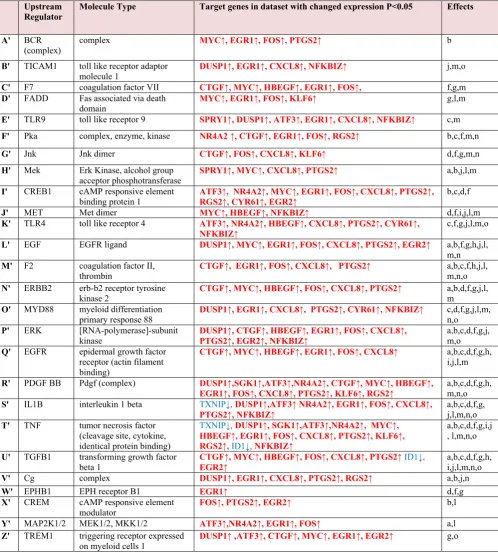
Supplementary file 5 : 30 minutes of exposure to 25 µM of PK 11195 of U118MG cells. List of 'Regulators' of File 4, detailing their known modulation of the genes of the 'Data Set' and the consequential 'Effects'.
Table Supplementary file 5. Details regarding the 'Regulators' of the figure of File 4. The list of primed capital lettering (first column) matches the 'Regulators' marked with the same lettering in the upper tier of Figure 3. The acronyms of the 'Regulators are given (second column). The molecular type of the 'Regulators' is summarized (third column). The target genes of each of the 'Regulators' are listed (fourth column). Upregulation of gene expression is indicated in 'bold font' and the corresponding arrows. Downregulation is indicated in 'greyfont' and downward pointing arrows. The final 'Effects' (fifth column) induced by the 'Regulators' and their targeted genes, are indicated with lower case lettering in the fifth column, according to the same lettering in Figure 3 marking the 'Effects' in the lower tier. Thus each Regulator affects a group of genes associated with a group of functions. Furthermore, these groups of genes and functions overlap. This configuration is defined as a super-assembly (see text for more detailed explanations).
Effects Target genes in dataset with changed expression P<0.05
Molecule Type Upstream
Regulator
b MYC↑, EGR1↑, FOS↑, PTGS2↑
complex BCR
(complex)
A'
j,m,o DUSP1↑, EGR1↑, CXCL8↑, NFKBIZ↑
toll like receptor adaptor molecule 1
TICAM1
B'
f,g,m CTGF↑, MYC↑, HBEGF↑, EGR1↑, FOS↑,
coagulation factor VII F7
C'
g,l,m MYC↑, EGR1↑, FOS↑, KLF6↑
Fas associated via death domain
FADD
D'
c,m SPRY1↑, DUSP1↑, ATF3↑, EGR1↑, CXCL8↑, NFKBIZ↑
toll like receptor 9 TLR9
E'
b,c,f,m,n NR4A2 ↑, CTGF↑, EGR1↑, FOS↑, RGS2↑
complex, enzyme, kinase Pka
F'
d,f,g,m,n CTGF↑, FOS↑, CXCL8↑, KLF6↑
Jnk dimer Jnk
G'
a,b,j,l,m SPRY1↑, MYC↑, CXCL8↑, PTGS2↑
Erk Kinase, alcohol group acceptor phosphotransferase Mek
H'
b,c,d,f ATF3↑, NR4A2↑, MYC↑, EGR1↑, FOS↑, CXCL8↑, PTGS2↑,
RGS2↑, CYR61↑, EGR2↑ cAMP responsive element
binding protein 1 CREB1
I'
d,f,i,j,l,m MYC↑, HBEGF↑, NFKBIZ↑
Met dimer MET
J'
c,f,g,j,l,m,o ATF3↑, NR4A2↑, HBEGF↑, CXCL8↑, PTGS2↑, CYR61↑,
NFKBIZ↑ toll like receptor 4
TLR4
K'
a,b,f,g,h,j,l, m,n DUSP1↑, MYC↑, EGR1↑, FOS↑, CXCL8↑, PTGS2↑, EGR2↑
EGFR ligand EGF
L'
a,b,c,f,h,j,l, m,n,o CTGF↑, EGR1↑, FOS↑, CXCL8↑, PTGS2↑
coagulation factor II, thrombin
F2
M'
a,b,d,f,g,j,l, m CTGF↑, MYC↑, HBEGF↑, FOS↑, CXCL8↑, PTGS2↑
erb-b2 receptor tyrosine kinase 2
ERBB2
N'
c,d,f,g,j,l,m, n,o DUSP1↑, EGR1↑, CXCL8↑, PTGS2↑, CYR61↑, NFKBIZ↑
myeloid differentiation primary response 88 MYD88
O'
a,b,c,d,f,g,j, m,o DUSP1↑, CTGF↑, HBEGF↑, EGR1↑, FOS↑, CXCL8↑,
PTGS2↑, EGR2↑, NFKBIZ↑ [RNA-polymerase]-subunit kinase ERK P' a,b,c,d,f,g,h, i,j,l,m CTGF↑, MYC↑, HBEGF↑, EGR1↑, FOS↑, CXCL8↑
epidermal growth factor receptor (actin filament binding)
EGFR
Q'
a,b,c,d,f,g,h, m,n,o DUSP1↑,SGK1↑,ATF3↑,NR4A2↑, CTGF↑, MYC↑, HBEGF↑,
EGR1↑, FOS↑, CXCL8↑, PTGS2↑, KLF6↑, RGS2↑ Pdgf (complex)
PDGF BB
R'
a,b,c,d,f,g, j,l,m,n,o
TXNIP↓,DUSP1↑,ATF3↑ NR4A2↑, EGR1↑, FOS↑, CXCL8↑, PTGS2↑, NFKBIZ↑
interleukin 1 beta IL1B
S'
a,b,c,d,f,g,i,j , l,m,n,o
TXNIP↓,DUSP1↑, SGK1↑,ATF3↑,NR4A2↑, MYC↑, HBEGF↑, EGR1↑, FOS↑, CXCL8↑, PTGS2↑, KLF6↑, RGS2↑, ID1↓, NFKBIZ↑
tumor necrosis factor (cleavage site, cytokine, identical protein binding) TNF
T'
a,b,c,d,f,g,h, i,j,l,m,n,o CTGF↑, MYC↑, HBEGF↑, FOS↑, CXCL8↑, PTGS2↑ID1↓,
EGR2↑ transforming growth factor
beta 1 TGFB1
U'
a,b,j,n DUSP1↑, EGR1↑, CXCL8↑, PTGS2↑, RGS2↑
complex Cg
V'
d,f,g EGR1↑
EPH receptor B1 EPHB1
W'
b,l FOS↑, PTGS2↑, EGR2↑
cAMP responsive element modulator
CREM
X'
a,l ATF3↑,NR4A2↑, EGR1↑, FOS↑
MEK1/2, MKK1/2 MAP2K1/2
Y'
g,o DUSP1↑ ,ATF3↑, CTGF↑, MYC↑, EGR1↑, EGR2↑
triggering receptor expressed on myeloid cells 1
TREM1
Supplementary file 6 : 30 minutes of exposure of U118MG cells to PK 11195 (25 µM).
(canonical pathway as provided by pathway analysis with Ingenuity IPA® showing that within 30 minutes of exposure to 25 µM of PK 11195 genes are upregulated for components that are part of the canonical pathway for regulation of angiogenesis and tumor growth).
Supplementary file 7 : 45 minutes of exposure to 25 µM of PK 11195 of U118MG cells
Potential effects on cellular functions due to the significant changes in gene expression as induced by 45 minutes of exposure of U118MG cells to PK 11195 (25 µM). The pathway analysis (Regulator Effects analytic IPA® applying adjusted p ≤ 0.05) indicates multiple interactive upstream pathways ('Regulators' given in the upper tier) related to the genes with significantly changed expression ('Data Set' given in the middle tier), together with the various downstream functions ('Effects' in the bottom tier). This whole configuration can be annotated as a super-assembly (for detailed explanation, see text). Color coding: In the 'Data Set' (middle tier): pink/red = upregulated. In the 'Effects' (bottom tier) and in the 'Regulators' (top tier) the predictions are indicated by orange = upregulated.
Regulators
Data Set
Effects A'
B'
C' D'
E'
F'
G'
H'
I'
a
b
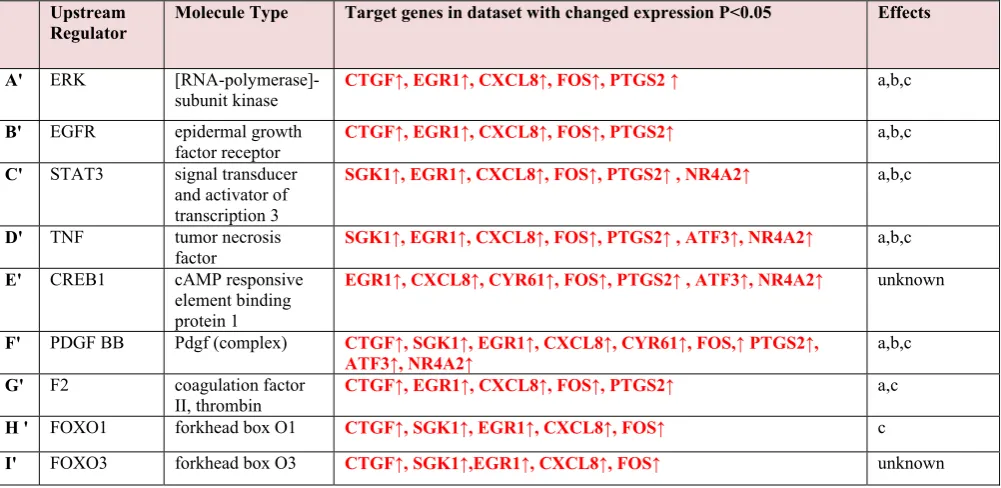
Supplementary file 8 : 45 minutes of exposure to 25 µM of PK 11195 of U118MG cells. List of 'Regulators' of figure of file 7, detailing their known modulation of the genes of the 'Data Set' and the consequential 'Effects'.
Table Supplementary file 8. Details regarding the 'Regulators' of the figure of File 7. List of primed capital lettering (first column) matches the 'Regulators' marked with the same lettering in the upper tier of Figure 5. The acronyms of the 'Regulators are given (second column). The molecular type of the 'Regulators' is summarized (third column). The gene symbols of the target genes of each of the 'Regulators' are listed (fourth column). Upregulation of gene expression is indicated in 'bold font' and the corresponding arrows. The final 'Effects' (fifth column) induced by the 'Regulators' and their targeted genes, are indicated with lower case lettering in the fifth column, according to the same lettering in Figure 3 marking the 'Effects' in the lower tier. Thus each Regulator affects a group of genes associated with a group of functions. Furthermore, these groups of genes and functions overlap. This configuration is defined as a super-assembly (see text for more detailed explanations).
Effects Target genes in dataset with changed expression P<0.05
Molecule Type Upstream
Regulator
a,b,c CTGF↑, EGR1↑, CXCL8↑, FOS↑, PTGS2 ↑
[RNA-polymerase]-subunit kinase ERK
A'
a,b,c CTGF↑, EGR1↑, CXCL8↑, FOS↑, PTGS2↑
epidermal growth factor receptor EGFR
B'
a,b,c SGK1↑, EGR1↑, CXCL8↑, FOS↑, PTGS2↑ , NR4A2↑
signal transducer and activator of transcription 3 STAT3
C'
a,b,c SGK1↑, EGR1↑, CXCL8↑, FOS↑, PTGS2↑ , ATF3↑, NR4A2↑
tumor necrosis factor TNF
D'
unknown EGR1↑, CXCL8↑, CYR61↑, FOS↑, PTGS2↑ , ATF3↑, NR4A2↑
cAMP responsive element binding protein 1 CREB1
E'
a,b,c CTGF↑, SGK1↑, EGR1↑, CXCL8↑, CYR61↑, FOS,↑ PTGS2↑,
ATF3↑, NR4A2↑ Pdgf (complex)
PDGF BB
F'
a,c CTGF↑, EGR1↑, CXCL8↑, FOS↑, PTGS2↑
coagulation factor II, thrombin F2
G'
c CTGF↑, SGK1↑, EGR1↑, CXCL8↑, FOS↑
forkhead box O1 FOXO1
H '
unknown CTGF↑, SGK1↑,EGR1↑, CXCL8↑, FOS↑
forkhead box O3 FOXO3
Supplementary file 9 : 45 minutes of exposure of U118MG cells to PK 11195 (25 µM).
(canonical pathway as provided by pathway analysis with Ingenuity IPA® showing that also at 45 minutes of exposure to 25 µM of PK 11195 genes are upregulated for components that are part of the canonical pathway for regulation of angiogenesis and tumor growth).
Supplementary file 10 : 1 hour of exposure to 25 µM of PK 11195 of U118MG cells
The Genes of the Data Set from left to right: DDIT4↓ TRIB1↑RGS2↓ F3↑ DUSP5↑DUSP1↑GADD45A↑SGK1↑KLF6↑
ADM↓ CYR61↑BCL6↑CTGF↑MYC↑ID2↑FOS↑PTGS2↑ID3↑CSF2↓ EGR1↑ID1↑ ATF3↑OSR1↓ SPRY2↑ SRF↑EGR3↑
NR4A2↑EGR2↑TFAP2C↓
Potential effects on cellular functions due to the significant changes in gene expression as induced by 1 hour of exposure of U118MG cells to PK 11195 (25 µM). The pathway analysis (Regulator Effects analytic IPA® applying adjusted p ≤ 0.05) indicates multiple interactive upstream pathways ('Regulators' given in the upper tier) related to the genes with significantly changed expression ('Data Set' given in the middle tier), together with the various downstream functions ('Effects' in the bottom tier). This whole configuration can be annotated as a super-assembly. Color coding: In the 'Data Set' (middle tier): pink/red = upregulated, green = down regulated. In the 'Effects' (bottom tier) and in the 'Regulators' (top tier) the predictions are indicated by blue = downregulated, and orange = upregulated. The row of gene symbols at the bottom of the figure are those of the middle tier ('Data Set') of this figure presented in the same sequence from left to right. The color coding in the figure indicates upregulation (red) and downregulation (blue or green).
A' B'
C' D'
E'
F' G'
H' I' J' K'
L' M'
N' O'
P' Q'
R' S'
a
b
c
d
e
f
g
h
i j
k l
Effects Data Set
Supplementary file 11 : 1 hour of exposure of U118MG cells to PK 11195 (25 µM).
List of 'Regulators' of figure of file 10 (1 hour of 25 µM of PK 11195), detailing their known modulation of the genes of the 'Data Set' and the consequential 'Effects'.
Table Supplementary file 11. Details regarding the 'Regulators' of the figure of file 10. This table lists details regarding the 'Regulators' for 1 hour of PK 11195 exposure. The list of primed capital lettering (first column) matches the 'Regulators' marked with the same lettering in the upper tier of the figure of supplementary file 10. The acronyms of the 'Regulators are given (second column). The molecular type of the 'Regulators' is summarized (third column). The target genes of each of the 'Regulators' are listed (fourth column). Upregulation of gene expression is indicated in 'bold font' and the corresponding arrows. Downregulation is indicated in 'greyfont' and downward pointing arrows. The final 'Effects' (fifth column) induced by the 'Regulators' and their targeted genes, are indicated with lower case lettering in the fifth column, according to the same lettering in the figure of
supplementare file 10 marking the 'Effects' in the lower tier. Thus each Regulator affects a group of genes associated with a group of functions. Furthermore, these groups of genes and functions overlap. This configuration is defined as a super-assembly (see text for more detailed explanations).
Effects Target genes in dataset with changed expression p < 0.05
Molecule Type Upstream
Regulator
a,d
ATF3↑, BCL6↑, EGR1↑, EGR3↑, FOS↑, KLF6↑, SPRY2↑,OSR1↓
group (Histone
deacetylases- enzymes) Hdac A' a,b,e,f,g
CTGF↑, DUSP1↑, EGR1↑, FOS↑, PTGS2↑
group of MAP kinases Jnk
B'
a,b,e,f
EGR1↑, FOS↑, KLF6↑, MYC↑
adaptor protein FADD
C'
a,b,c,e,f,h,i
CTGF↑, EGR1↑, EGR2↑, FOS↑, FOSB↑, GADD45A↑, SGK1↑
transcription regulator FOXO3
D'
b,h,i,k
ATF3↑, EGR1↑, EGR2↑, KLF6↑
transcription regulator SPIB
E'
b,c,d,e,f,g,j
CTGF↑, EGR1↑, F3↑, FOS↑, ID1↑, MYC↑, PTGS2↑, SGK1↑,CSF2↓
group (kinases) ERK1/2
F'
b,e,i,k,l
EGR1↑, ID1↑, ID3↑, MYC↑
cytokine PRL
G'
a,b,e,f,j,l
EGR1↑, FOS↑, ID1↑, MYC↑, PTGS2↑, SGK1↑,CSF2↓, DDIT4↓, TFAP2C↓
ligand dependent nuclear receptor ESR1
H'
b,e,f,j,k
CTGF↑, EGR1↑, EGR2↑, FOS↑, FOSB↑, GADD45A↑, SGK1↑
transcription regulator FOXO1
I'
b,c,e,f,g,j,k
ATF3↑, CBX4↑, CTGF↑, CYR61↑, DUSP1↑, DUSP5↑, EGR1↑, EGR2↑,
EGR3↑, F3↑, FOS↑, FOSB↑, GADD45A↑, KLF6↑, MYC↑, NR4A2↑,
PTGS2↑, SGK1↑, SRF↑, TRIB1↑,ADM↓, CSF2↓, RGS2↓
complex (growth factors) PDGF BB J' b,e,f,h,j,l
CTGF↑, ERRFI1↑, ID1↑, ID2↑, ID3↑, PTGS2↑
growth factor BMP6
K'
b,c,e,f,h,i,j
BCL6↑, EGR1↑, FOS↑, ID1↑, ID2↑, MYC↑, PTGS2↑, SGK1↑
cytokine IL6
L'
b,c,e,f,h,i,k,
ID1↑, ID2↑, ID3↑, MYC↑, PTGS2↑, SGK1↑
enzyme APC
M'
b,c,f,g,h,i,k,l
DUSP1↑, DUSP5↑, EGR1↑, EGR2↑, FOS↑, MYC↑, PTGS2↑, SPRY2↑
growth factor EGF
N'
e
EGR1↑, EGR2↑, FOS↑, PTGS2↑
kinase EPHB1
O'
unknown
ATF3↑, CTGF↑, DUSP1↑, EGR1↑, MYC↑
group (kinases) MAP2K1/2
P'
f,g
CTGF↑, EGR1↑, F3↑, FOS↑, GADD45A↑, MYC↑
peptidase F7
Q'
f,g,k,l
ATF3↑, CYR61↑, EGR1↑, EGR2↑, ERRFI1↑, FOS↑, FOSB↑, MYC↑,
NR4A2↑, PTGS2↑,RGS2↓
transcription regulator CREB1
R'
k,l
CTGF↑, ID1↑, ID2↑, ID3↑, PTGS2↑
growth factor GDF9
Supplementary file 12 : 3 hours of exposure to 25 µM of PK 11195 of U118MG cells
The genes of the Data Set from left to right: HAS2↓, KLF6↓, SMAD6↑ID1↑GBP1↑DLX3↑PTGER4↓ NFKBIZ↓ BDKRB1↓
CD47↓ BIRC3↓ RGS4↓ DDIT3↑DUSP1↓ BCL2L1↓ VEGFA↓ CXCL8↓ CSF2↓ WNT5A↓ KIT↓ STC1↓ PLAU↓ TXNIP↑ FOSL1↓ DUSP5↓ CTGF↑SPRY1↓ OSR1↓ SOX4↓ DDIT4↑
Potential effects on cellular functions due to the significant changes in gene expression as induced by 3 hours of exposure of U118MG cells to PK 11195 (25 µM). The pathway analysis (Regulator Effects analytic IPA® applying adjusted p ≤ 0.05) indicates multiple interactive upstream pathways ('Regulators' given in the upper tier) related to the genes with significantly changed expression ('Data Set' given in the middle tier), together with the various downstream functions ('Effects' in the bottom tier). This whole configuration can be annotated as a super-assembly (see text for detailed explanation). Color coding: In the 'Data Set' (middle tier): pink/red = upregulated, green = down regulated. In the 'Effects' (bottom tier) and in the 'Regulators' (top tier) the predictions are indicated by blue = downregulated, and orange = upregulated. The row of gene symbols at the bottom of the figure are those of the middle tier ('Data Set') of this figure presented in the same sequence from left to right. The color coding indicates upregulation (red) and downregulation (green or blue).
A' C'
D' E'
F'
G' H'
I' J' K' L' M' N' O'
P' Q'
R' S'
T' U'
V' W' B'
a b
c d
e f
g
h
i
j k
l m
n o
p q
r Regulators
Data Set
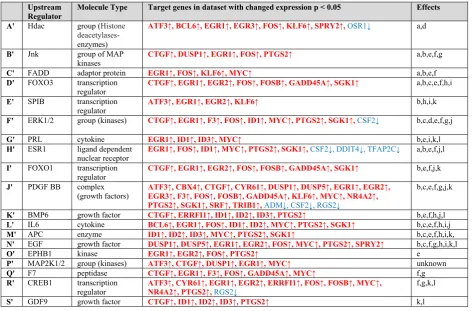
Supplementary file 13 : 3 hours of exposure of U118MG cells to PK 11195 (25 µM).
List of 'Regulators' of the figure of file 12 (3 hours of 25 µM of PK 11195), detailing their known modulation of the genes of the 'Data Set' and the consequential 'Effects' .
Details regarding the 'Regulators' of supplementary file 13. The presentation is organized in the same way as in the Table of supplementary file 11.
Effects Target genes in dataset with changed expression P<0.05
Molecule Type Upstream
Regulator
e,h,i,j,k,l,m,n,o
CXCL8↓, PLAU↓, PTGER4↓, VEGFA↓, WNT5A↓
transmembrane receptor ITGB1 A' b,c,d,e,h,i,j,k,l,n,o, p,m,q,r
ATF4↑, DLX1↑, GBP1↑, ID1↑, TAGLN↑, TXNIP↑,BCL2L1↓,
BDKRB1↓, BIRC3↓, CD47↓, CSF2↓, CXCL8↓, DUSP1↓, DUSP5↓,
FOSL1↓, KLF6↓, NFKBIZ↓, PHLDA1↓, PLAU↓, RGS2↓, SOX4↓,
VEGFA↓, WNT5A↓
cytokine TNF
B'
a,b,c,e,h,i,j,k,l,m, n,o,p,q
ATF4↑, DDIT4↑, FOSB↑ ,TXNIP↑,BDKRB1↓, BIRC3↓, CSF2↓,
CXCL8↓, DUSP1↓, FOSL1↓, HAS2↓, NFKBIZ↓, PHLDA1↓, PLAU↓,
VEGFA↓ cytokine IL1B C' a,b,c,e,h,i,j,k,o,p, m,q
DDIT3↑, TXNIP↑,BCL2L1↓, CXCL8↓, DUSP1↓, FOSL1↓, RGS2↓,
VEGFA↓ complex (kinase) PI3K D' c,e,i,k,l,n,o,p,q,r
CTGF↑, DDIT3↑,BCL2L1↓, BIRC3↓, CSF2↓, CXCL8↓, DUSP5↓,
HAS2↓, KIT↓, NFKBIZ↓, PLAU↓
Complex (transcription regulator) NFKB E' b,c,e,f,g,h,k,m,n,o, p,q,r
DDIT3↑, GLIPR1↑,BCL2L1↓, CSF2↓, CXCL8↓, HAS2↓, NFKBIZ↓,
PHLDA1↓, VEGFA↓
transcription regulator STAT3
F'
a,e,k,l,n,o,h,i,j
BCL2L1↓, BIRC3↓, CXCL8↓, DUSP1↓, PTGER4↓, ST3GAL1↓, VEGFA↓
enzyme PTGS2
G'
b,c,e,k,n,o,p
CSF2↓, CXCL8↓, DUSP1↓, NFKBIZ↓, PHLDA1↓, SPRY1↓
transmembrane receptor TLR3
H'
a,b,e,j,k,l,m
BIRC3↓, CSF2↓, CXCL8↓, DUSP1↓, FOSL1↓, NFKBIZ↓, PLAU↓,
VEGFA↓, WNT5A↓
transcription regulator JUN
I'
a,c,e,h,i,j,k,l,o,m
CTGF↑, ID1↑,BCL2L1↓, CSF2↓, CXCL8↓, FOSL1↓, HAS2↓, PLAU↓,
VEGFA↓
Group (kinase) ERK1/2
J'
b,e,k,o,p
OSR1↑,BCL2L1↓, CSF2↓, HAS2↓, NFKBIZ↓
kinase Map3k7
K'
a,e,k,n,o,q
BCL2L1↓, CSF2↓, CXCL8↓, HAS2↓, PLAU↓, VEGFA↓
transcription regulator NFKB1
L'
b,e,f,j,k,l,m,r
BCL2L1↓, CXCL8↓, DUSP1↓, DUSP5↓, ST3GAL1↓, VEGFA↓
growth factor EGF
M'
e,j,k,n,o,p
CSF2↓, CXCL8↓, DUSP1↓, NFKBIZ↓, PHLDA1↓, SPRY1↓
transmembrane receptor TLR9
N'
b,f,h,k,n,o,q
BIRC3↓, CSF2↓, CXCL8↓, NFKBIZ↓, PLAU↓
cytokine IL1A
O'
b,d,e,f,i,j,k,l
CTGF↑, BCL2L1↓, BIRC3↓, CXCL8↓, PLAU↓, VEGFA↓
growth factor HGF
P'
unknown
SMAD6↑,BCL2L1↓, CCNE2↓, CXCL8↓, DUSP1↓, HAS2↓, PHLDA1↓,
PLAU↓, RGS2↓, RGS4↓, STC1↓, VEGFA↓
complex Cg
Q'
k
DLX1↑, DLX3↑,DUSP1↓, DUSP5↓, IER5↓, VEGFA↓, WNT5A↓
transcription regulator POU5F1
R'
k
CXCL8↓, DUSP1↓, DUSP5↓, KIT↓
transcription regulator ELF4
S'
k
CTGF↑, DLX1↑, DLX3↑,DUSP1↓, DUSP5↓, IER5↓, KLF6↓, VEGFA↓,
WNT5A↓ transcription regulator SOX2 T' unknown
DUSP1↓, DUSP5↓, IER5↓, VEGFA↓, WNT5A↓
transcription regulator SOX3
U'
unknown
DUSP1↓, DUSP5↓, IER5↓, VEGFA↓, WNT5A↓
transcription regulator SOX1
V'
unknown
DUSP1↓, DUSP5↓, IER5↓, VEGFA↓, WNT5A↓
transcription regulator GMNN
Supplementary file 14 (Figure 4 A – E in the ms.) tumorigenicity 'Effects' associated with changes in gene expression due to exposure of U118MG cells to 25 µM of PK 11195.
A'
B'
C' a
b
c Regulator
Regulator
Regulator Effect
Effect Data Set
Data Set
Data Set
Effect
A
B
The genes of the Data Set in 'E' from left to right: ABCA1↓ BIRC3↓ SMC4↓ RPS6KA2↑CDK1↓ IL1RN↑SCD↓ FASN↓
PTGS2↑FEN1↓ EXO1↓ ASF1B↓ TYMS↓ KIAA0101↓ THY1↓ ATF3↑RFC4↓ SPP1↑ID1↓ GDF15↑LRRC17↓ IGFBP5↓
KIFC1↓ MCM3↓ CDKN3↓ CTGF↓ RRM2↓ NCAPG↓ PEG10
Potential effects on tumorigenicity due to gene expression following 24 hrs of exposure of U118MG cells to PK 11195 (25 µM). This is Figure 4A-E in the manuscript. As found with Regulator Effects analyticIPA® applying adjusted p ≤ 0.05, in A,B,C, individual 'Regulators' (given in the upper tiers) are related to specific groups of genes with significantly changed expression ('Data Sets' given in the middle tiers), together with their particular downstream functions ('Effects' in the bottom tiers), namely, suppression of growth of malignant tumor (in A) and suppression of proliferation of tumor cell lines (in B and C). In D, three 'Regulators' are upstream to an array of genes (the 'Data Set' given in the middle tier), with significantly changed expression. This 'Data Set' is subdivided into two subsets that exert two particular downstream functions ('Effects' in the bottom tier), namely suppression of epithelial cancer and suppression of proliferation of tumor cells. In E, two 'Regulators' are upstream to an array of
D'
E'
F'
d e
Regulators
Effects Data
Set
D
G' A'
f
g
h
→
→
Regulators
1 30
Effects Data
Set
Supplementary file 15 : List of 'Regulators' of supplementary file 14 (24 hours of 25 µM of PK 11195), detailing their known modulation of the genes of the 'Data Sets' and the consequential 'Effects'
(tumorigenicity).
Effects Target genes in dataset with changed expression P<0.05
Molecule Type Upstream
Regulator
a,f,g,h
ATF3↑, DDIT3↑, GDF15↑, PTGS2↑, RPS6KA2↑, SPP1↑,ASF1B↓,
BIRC3↓, CDK1↓, CDKN3↓, CTGF↓, EXO1↓, FASN↓, FEN1↓, ID1↓,
IGFBP5↓, KIAA0101↓, KIFC1↓, LRRC17↓, MCM3↓, NCAPG↓, PEG10↓,
RFC4↓, RRM2↓, SMC4↓, THY1↓, TPX2↓, TYMS↓
transcription regulator TP53
A'
b
ASNS↑, ATF3↑, CEBPB↑, PTGS2↑, SPP1↑, CDK1↓
transmembrane receptor TREM1
B'
c
PTGS2↑, ERRFI1↓, FASN↓, PLAU↓
g-protein coupled receptor CNR1
C'
unknown
CDK1↓, GINS2↓, MCM10↓, NUSAP1↓, RRM2↓, TPX2↓, TYMS↓
Group (transcription regulator) E2f
D'
d,e
IGFBP1↑, SPP1↑,CCNE2↓, CDK1↓, SCD↓
transcription regulator HNF4A
E'
d,e
CCNE2↓, CDK1↓, CDT1↓, ID1↓, KIAA0101↓, RRM2↓, TYMS↓
transcription regulator RB1
F'
f,g
IL1RN↑, PTGS2↑,ABCA1↓, FASN↓, SCD↓
ligand-dependent nuclear receptor NR1H2
G'
Supplementary file 16 (Figure 5 A – C in the ms.) tumorigenicity 'Effects' associated with changes in gene expression due to 24 hours of exposure of U118MG cells to 25 µM of PK 11195.
Potential effects on programmed cell death due to gene expression following 24 hrs of exposure of U118MG cells to PK 11195 (25 µM). As analyzed with Regulator Effects analytic; IPA®; applying adjusted p ≤ 0.05), in A,B,C, individual 'Regulators' (given in the upper tiers) are related to specific groups of genes with significantly changed expression ('Data Sets' given in the middle tiers), together with their particular downstream functions ('Effects' in the bottom tiers), namely, stimulation of apoptosis of kidney cell lines (in A), stimulation of apoptosis of epithelial cell lines (in B), stimulation of cell death of fibroblast cell lines (in C). Each mentioned separate set can be considered an assembly of pathways running from 1 Regulator via a number of genes to affect not more than 1 specific function. Color coding: pink/orange = upregulated, blue/green = down regulated. For more detailed explanation see text.
A' B' C'
a b c
Data Set
Data
Set Data Set
Regulator
Regulator Regulator
Effect Effect Effect
Supplementary file 17 List of 'Regulators' of (figure 5 in the text, 24 hours of 25 µM of PK 11195), detailing their known modulation of the genes of the 'Data Sets' and the consequential 'Effects' (programmed cell death).
Effects Target genes in dataset with changed expression P<0.05
Molecule Type Upstream
Regulator
a
DDIT3↑, PPP1R15A↑, TRIB3↑, UNC5B↑
transcription regulator NUPR1
A'
b
ATF3↑, DDIT3↑, PPP1R15A↑ , TRIB3↑
transcription regulator DDIT3
B'
с
CEBPB↑, DDIT4↑, ID1↓
cytokine WNT3A
C'
Supplementary file 18 List of gene symbols for genes with changed expression due to PK 11195 exposure in the present study.
abbreviation Full name abbreviations Full name abbreviations Full name ABCA1 ATP-binding cassette, sub-family A
(ABC1), member 1 FOSB FBJ murine osteosarcoma viral oncogene homolog B PLEKHF1 pleckstrin homology domain containing, family F (with FYVE domain) member 1 ACTG2 actin, gamma 2, smooth muscle,
enteric FOSL1
FOS-like antigen 1 PPP1R15A protein phosphatase 1, regulatory subunit 15A
ADM adrenomedullin GADD45A growth arrest and
DNA-damage-inducible, alpha PSAT1 phosphoserine aminotransferase 1 ANP32AP1 acidic nuclear phosphoprotein 32
family member A pseudogene 1 GBP1 guanylate binding protein 1, interferon-inducible PTGER4 prostaglandin E receptor 4 ASF1B anti-silencing function 1B histone
chaperone GDF15 growth differentiation factor 15 PTGS2 prostaglandin-endoperoxide synthase 2 ASNS asparagine synthetase
(glutamine-hydrolyzing) GINS2 GINS complex subunit 2 (Psf2 homolog) PTMA prothymosin, alpha
ATF3 activating transcription factor 3 HAS2 hyaluronan synthase 2 RFC4 replication factor C (activator 1) 4, 37kDa ATOH8 atonal bHLH transcription factor 8 HBEGF heparin binding EGF like growth
factor RGS2 regulator of G-protein signaling 2
BCL2CL1 BCL2-like 1 HMGB2 high mobility group box 2 RGS4 regulator of G-protein signaling 4
BCL6 B-cell CLL/lymphoma 6 ID1 inhibitor of DNA binding 1, RNA28S5 RNA, 28S ribosomal 5
BDKRB1 bradykinin receptor B1 ID2 inhibitor of DNA binding 2 RPS6KA2 ribosomal protein S6 kinase, 90kDa,
polypeptide 2
BEX2 brain expressed X-linked 2 ID3 inhibitor of DNA binding 3 RPL21P28 ribosomal protein L21 pseudogene 28
BIRC3 baculoviral IAP repeat containing 3 IGFBP1 insulin-like growth factor binding
protein 1 RPS2P28 ribosomal protein S2 pseudogene 28
CCNE2 cyclin E2 IGFBP5 insulin-like growth factor binding
protein 5 RRM2 ribonucleotide reductase M2
CD47 CD47 molecule IL1RN interleukin 1 receptor antagonist SCD stearoyl-CoA desaturase
(delta-9-desaturase)
CDK1 cyclin-dependent kinase 1 IL8 Interleukin 8 SGK serum/glucocorticoid regulated kinase
CDKN3 cyclin-dependent kinase inhibitor 3 IL18 interleukin 18 SGK1 serum/glucocorticoid regulated kinase 1
CDT1 chromatin licensing and DNA
replication factor 1 KIAA0101
KIAA0101 SLC1A5 solute carrier family 1 (neutral amino acid transporter), member 5
CEBPB CCAAT/enhancer binding protein
(C/EBP), beta KDM3A lysine demethylase 3A SLC3A2 solute carrier family 3 (amino acid transporter heavy chain), member 2
CLK1 CDC like kinase 1 KIFC1 kinesin family member C1 SLC6A15 solute carrier family 6 (neutral amino acid
transporter), member 15
CSF2 colony stimulating factor 2 KIT v-kit Hardy-Zuckerman 4 feline
sarcoma viral oncogene homolog SLC7A5 solute carrier family 7 (amino acid transporter light chain, L system), member 5
CTGF connective tissue growth factor KLF6 Kruppel-like factor 6 SMAD6 SMAD family member 6
CXCL8 chemokine (C-X-C motif) ligand 8 LOC100507
412 uncharacterized LOC100507412 SMC4 structural maintenance of chromosomes 4 CYR61 cysteine-rich, angiogenic inducer,
61 LOC729779 phosphoserine aminotransferase 1 pseudogene 3 SOX4 SRY (sex determining region Y)-box 4
DDIT3 DNA-damage-inducible transcript 3 LRRC17 leucine rich repeat containing 17 SPRR2D small proline-rich protein 2D DDIT4 DNA-damage-inducible transcript 4 MCM3 minichromosome maintenance
complex component 3 SPP1 secreted phosphoprotein 1
DLX3 distal-less homeobox 3 MCM10 minichromosome maintenance 10
replication initiation factor SPRY1
sprouty RTK signaling antagonist 1
DMC1 DNA meiotic recombinase 1 MIR22HG MIR22 host gene SPRY2 sprouty RTK signaling antagonist 2
DUSP1 dual specificity phosphatase 1 MYC v-myc avian myelocytomatosis viral
oncogene homolog SRF serum response factor DUSP5 dual specificity phosphatase 5 MYLIP myosin regulatory light chain
interacting protein STC1 stanniocalcin 1
DYNC1H1 dynein cytoplasmic 1 heavy chain 1 NABP nucleic acid binding protein 1 TFAP2C transcription factor AP-2 gamma (activating enhancer binding protein 2 gamma)
EGR1 early growth response 1 NCAPG non-SMC condensin I complex,
subunit G TGIF1 TGFB-induced factor homeobox 1
EGR2 early growth response 2 NEXN nexilin (F actin binding protein) THY1 Thy-1 cell surface antigen
EGR3 early growth response 3 NFKBIZ nuclear factor of kappa light
polypeptide gene enhancer in B-cells inhibitor, zeta
TPX2 TPX2, microtubule-associated
ERRFI1 ERBB receptor feedback inhibitor 1 NR4A2 nuclear receptor subfamily 4, group A,
member 2 TRIB1 tribbles pseudokinase 1
EXO1 exonuclease 1 NUPR1 nuclear protein, transcriptional
regulator, 1 TRIB3 tribbles pseudokinase 3 F3 coagulation factor III
(thromboplastin, tissue factor) NUSAP1
nucleolar and spindle associated
protein 1 TUFT1
tuftelin 1
FAM102A family with sequence similarity 102,
member A OSR1 odd-skipped related transciption factor 1 TXNIP thioredoxin interacting protein
FASN fatty acid synthase P8 nuclear protein, transcriptional
regulator, 1(also known as NUPR1) TYMS thymidylate synthetase FEN1 flap structure-specific endonuclease
1 PCK2 phosphoenolpyruvate carboxykinase 2 (mitochondrial) UHRF1 ubiquitin-like with PHD and ring finger domains 1 FHL2 four and a half LIM domains 2 PCNP PEST proteolytic signal containing
nuclear protein UNC5B unc-5 netrin receptor B
FILIP1L filamin A interacting protein 1-like PDE5A phosphodiesterase 5A, cGMP-specific VEGFA vascular endothelial growth factor A
FKBP10 FK506 binding protein 10 PEG10 paternally expressed 10 WNK lysine deficient protein kinase 1
FOLR3 folate receptor 3 (gamma) PHGDH phosphoglycerate dehydrogenase WNT5A wingless-type MMTV integration site
family, member 5A FOS FBJ murine osteosarcoma viral
Supplementary file 19 : List of acronyms of 'Regulators' related to changes in gene expression due to PK 11195 exposure in the present study
abbreviation Full name abbreviation Full name abbreviation Full name
APC adenomatous polyposis coli GDF9 growth differentiation factor 9 PDGF BB platelet-derived growth factor beta polypeptide
BCR (complex)
B Cell Receptor GMNN geminin, DNA replication inhibitor PI3K phosphatidylinositol-4,5-bisphosphate 3-kinase, catalytic subunit alpha
BMP6 bone morphogenetic protein 6 Hdac histone deacetylase Pka cAMP-dependent protein kinase
Cg cathepsin G HGF hepatocyte growth factor POU5F1 POU class 5 homeobox 1
CNR1 cannabinoid receptor 1 (brain) IL1B interleukin 1 beta PRL prolactin
CREB1 cAMP responsive element binding
protein 1p HNF4A hepatocyte nuclear factor 4, alpha PTGS2 prostaglandin-endoperoxide synthase 2 (prostaglandin G/H synthase and cyclooxygenase)
CREM cAMP responsive element
modulator IL1A interleukin 1, alpha RB1 retinoblastoma 1
DDIT3 DNA-damage-inducible transcript 3 IL1B interleukin 1, beta SOX1 SRY (sex determining region Y)-box
1
EGF epidermal growth factor IL6 interleukin 6 SOX2 SRY (sex determining region Y)-box 2
EGFR epidermal growth factor receptor ITGB1 integrin, beta 1 SOX3 SRY (sex determining region Y)-box 3
ELF4 E74-like factor 4 (ets domain
transcription factor) Jnk c-Jun N-terminal kinase SPIB Spi-B transcription factor ERK Protein kinase JUN jun proto-oncogene STAT3 signal transducer and activator of
transcription 3 (acute-phase response factor)
EPHB1 EPH receptor B1 MAP2K1/2 mitogen-activated protein kinase
kinase 1/2 TICAM1 toll like receptor adaptor molecule 1 ERBB2 erb-b2 receptor tyrosine kinase 2 Map3k7 mitogen-activated protein kinase
kinase kinase 7 TGFB1 transforming growth factor beta 1 ERK1/2 mitogen-activated protein kinase Mek Mitogen-activated protein
kinase kinase TLR3 toll-like receptor 3
ESR1 estrogen receptor MET MET proto-oncogene, receptor
tyrosine kinase TLR4 toll like receptor 4 Synonyms F2 coagulation factor II, thrombin MYD88 myeloid differentiation primary
response 88 TLR9 toll-like receptor 9 F7 coagulation factor VII NFKB nuclear factor of kappa light
polypeptide gene enhancer in B-cells 2 (p49/p100)
TNF tumor necrosis factor
FADD Fas (TNFRSF6)-associated via
death domain NFKB1 nuclear factor of kappa light polypeptide gene enhancer in B-cells 1 TP53 tumor protein p53
FOXO1 forkhead box O1 NR1H2 nuclear receptor subfamily 1, group H,
member 2 TREM1 triggering receptor expressed on myeloid cells 1
FOXO3 forkhead box O3 NUPR1 nuclear protein, transcriptional