ISSN: 2319-8753
I
nternational
J
ournal of
I
nnovative
R
esearch in
S
cience,
E
ngineering and
T
echnology
(An ISO 3297: 2007 Certified Organization)
Vol. 2, Issue 10, October 2013
Design and Analysis of Landing Gear Lug
attachment in an Airframe
Prasad Kabade
1, Ravi Lingannavar
2PG student, Dept. of Mechanical Engineering, KLE Dr.MSSCET, Belgaum, Karnataka, India1
Asst. Professor, Dept. of Mechanical Engineering, KLE Dr.MSSCET, Belgaum, Karnataka, India2
Abstract: Landing gear is a vital structural unit of an aircraft which enables to take off and land safely on the ground. A variety of landing gear arrangements are used depending on the type and size of an aircraft. The most common type is the tri-cycle arrangement with one nose landing gear unit and two main landing gear units. Even during a normal landing operation heavy loads (equal to the weight of an aircraft) are to be absorbed by the landing gear. In turn joints are to be provided such that such heavy concentrated loads are first received by the airframe and subsequently diffused to the surrounding areas. Normally heavy concentrated loads are received through a lug joint. Therefore design of a lug joint against failure under static and fatigue loading conditions assumes importance in the development of an aircraft structure. This project deals with the design and analysis of a typical lug joint representative of a landing gear attachment of a small transport airplane. The design will provide safety against 1) failure of the lug, 2) failure of the pin. The types of loadings to be considered are a) axial, b) transverse or drag load. Aircraft design practices will be used. A FEA will be carried out to compare the design calculations and to determine the stress concentration factor in order to estimate the maximum local tensile stress which will be required in the fatigue analysis of the lug joint. Fatigue life to crack initiation at the high stress location will be estimated by using Miner’s rule..
Keywords: Landing gear, lugs, stress concentration, fatigue life of lug, Minors rule I. INTRODUCTION
Aircraft is machine that is able to fly from one place to another place. Many researches were made to fly the machine since from mythology, many had lost their life during their experiments, and many failed to fly their machine. But finally in 1910 Wright Brothers build machine which is able to fly for 59seconds, which is very short duration but it is first milestone for development of aviation. Further many researches were made to transport the goods and passengers. Then it is brought into business for transportation. And also used in military for air support, thus many fighter planes are developed.
ISSN: 2319-8753
I
nternational
J
ournal of
I
nnovative
R
esearch in
S
cience,
E
ngineering and
T
echnology
(An ISO 3297: 2007 Certified Organization)
Vol. 2, Issue 10, October 2013
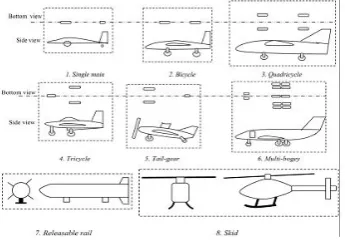
Figure 1: Different configurations of landing gear arrangements
There were many researches being carried out on failures of landing gear, failures of lug joint, fatigue growth behavior of different structures. Here are few papers referred in this project and are listed below,
Marcin Kurdelski and Andrzej Leski[1] investigated fatigue life analysis of main landing gear pull-rod of the fighter jet aircraft. Aircraft life extension carries the inherent risk of adverse structural effects occurring as a result of fatigue. These effects may lead to structural damage or complete destruction of the aircraft. This paper presents illustrates the possibilities of combining numerical analysis, nondestructive testing and component fatigue tests for the purposes of the main landing gear pull-rod damage investigation. The laboratory tests have been performed on samples taken from the decommissioned pull-rods. Results of the present research will be utilized for revising maintenance bulletins and diagnostic methods needed to ensure the safe operation of the pull-rod elements until they are replaced with new ones. The problem de-scribed in the present paper concerns the pull-rod of the Su-22’s main landing gear – a critical structural element. Marcin Kurdelski and Andrzej Leski[2] investigated on crack growth analysis of the landing gear pull rod of the fighter jet aircraft. He described the problem of searching for the causes of damage in the form of rupture of a strength member of the main landing gear. Sriranga et al.,[3] investigated on stress analysis of wing-fuselage lug attachment bracket of a transport aircraft. Jong-Ho Kim et al.,[4] investigated on fatigue crack growth behavior of Al7050-T7451 attachment lugs under flight spectrum variation. O. Gencoz et al.,[5] investigated on application of finite element analysis techniques for predicting crack propagation in lugs. S. M. Beden et al.,[6] investigated on fatigue crack propagation models for metallic components. Jarkko Tikka and Patria[7] investigated on fatigue life evaluation of critical locations in aircraft structures using virtual fatigue test.
II. MATHEMATICAL MODEL
Project objective: The main objective is evaluation of load carrying capability and fatigue life prediction of a landing gear lug joint. The current work includes the design of a medium size transport aircraft landing gear unit. The landing gear unit is designed for 200 seating capacity aircraft. The landing loads are taken from the aerodynamic calculations. A typical landing load case will be assumed for which structural analysis will be carried out. During landing, there will be three different types of loads a) Vertical load b) Drag load
ISSN: 2319-8753
I
nternational
J
ournal of
I
nnovative
R
esearch in
S
cience,
E
ngineering and
T
echnology
(An ISO 3297: 2007 Certified Organization)
Vol. 2, Issue 10, October 2013
Figure 2: Location of lug joints in an aircraft LOAD CALCULATION
Let’s considering the standard passenger planes of 150-200 seating capacity the approximate specification of
plane is obtained [8]. The notations used in calculation are mentioned below. W=Maximum weight=55340kg = 542.88kN
B=Wheel base =17.6m L=Fuselage length=35m
K = Function of τswald’s efficiency factor µ = Coefficient of friction= 0.5
T=Trust of engine (2units) =82:3kN 2
Hcg= Distance between aircraft c.g and ground = 6m S = Total lifting planform area = 92m2
Swf = Wing fuselage palnform area=72m2 S
H = Horizontal tail planform area= 20m2
V
L=Landing Velocity= 132 knots = 67.90m/s
Vc= Cruise velocity = 438 knots = 225m/s A.R = Aspect Ratio = 8.7
e = eccentricity = 0.92 C
LOFW=Fluid flow co-efficient for fuselage wing = 0.205
CLWf = Lift co-efficient over wing fuselage Lwf= Wing fuselage lift
LH = Horizontal tail lift C
Loh=Fluid flow co-efficient for horizontal wing = 1.1
CDo= Drag flow co-efficient = 0.0305 ∆CL= Lift co-efficient = 0.6
a
L = Acceleration level
B = Wheel base
Let’s Consider K-factor which is function of τswald’s efficiency factor, and is given by,
Lift co-efficient over wing fuselage is calculated as,
ISSN: 2319-8753
I
nternational
J
ournal of
I
nnovative
R
esearch in
S
cience,
E
ngineering and
T
echnology
(An ISO 3297: 2007 Certified Organization)
Vol. 2, Issue 10, October 2013
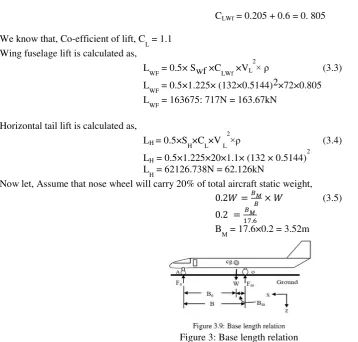
CLWf = 0.205 + 0.6 = 0. 805
We know that, Co-efficient of lift, CL = 1.1 Wing fuselage lift is calculated as,
LWF = 0.5× Swf ×CLWf ×VL 2
× ρ (3.3) LWF = 0.5×1.225× (132×0.5144)2×72×0.805 L
WF = 163675: 717N = 163.67kN
Horizontal tail lift is calculated as,
LH = 0.5×SH×CL×V L 2
×ρ (3.4) LH = 0.5×1.225×20×1.1× (132 × 0.5144)
2
LH = 62126.738N = 62.126kN
Now let, Assume that nose wheel will carry 20% of total aircraft static weight,
(3.5)
B
M = 17.6×0.2 = 3.52m
Figure 3: Base length relation
From Fig.3 shows the total wheel base (B) is equal to the length between C.G to nose landing gear and length between the length C.G and main landing gear. i.e., B = B
M+ BN (3.6)
B
N= B − BM
BN= 17.6−3. 52 = 14.08m
Deceleration during landing is given by,
(3.7)
Dynamic force can be calculated as,
(3.8)
F
dy = 5173.22N
ISSN: 2319-8753
I
nternational
J
ournal of
I
nnovative
R
esearch in
S
cience,
E
ngineering and
T
echnology
(An ISO 3297: 2007 Certified Organization)
Vol. 2, Issue 10, October 2013
Vertical force acting on nose landing gear is given by,
FVN = Fstatic+ Fdy (3.9)
F
VN= 11752KG≈12000kg
F
VN = 117.72kN
Generally in aircraft design, the factor of safety ranges between 1 and 2 [8]. Therefore consider factor of safety as 1.5times, i.e., FOS=1.5
Therefore, vertical force on nose landing gear is,
FVN= FOS×12000 (3.10) F
VN = 1.51×2000 = 18000kg
F
VN = 176.58kN
This is the design load on the lug of nose wheel. Drag Force:
The drag force acting on nose landing gear is very less compared to the main landing gear. Let’s consider ( )th of vertical nose force is acting as drag load.
Drag force is given as,
FDRAG= FV N×0.25 (3.11) FDRAG = 12000 ×0.25
FDRAG= 4500kg = 44.145kN
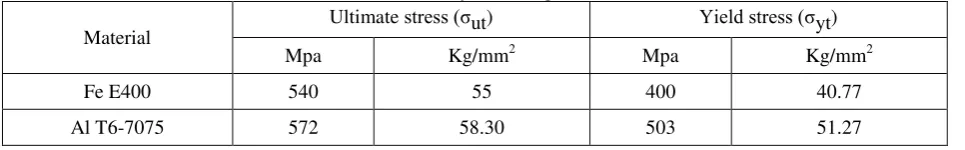
Material Selection: The material for lug joints must be carefully selected, so that it can effectively withstand for applied load. Thus there are several materials can be used for lug joints, but here the weight and strength must be taken in account. The strength must be high and weight must be less, in order to reduce dead weight on aircraft structure during flight. Here two different materials are considered for designing landing gear lug joint. The steel Fe-E-400 and aluminum Al T6 7075 are considered [11]. The stress analysis is performed on both the materials and results will be discussed.
Table 1: Ultimate and yield strength of materials
Material
Ultimate stress ( ut) Yield stress ( yt)
Mpa Kg/mm2 Mpa Kg/mm2
Fe E400 540 55 400 40.77
Al T6-7075 572 58.30 503 51.27
Fe E 400 Design of pin:
Material used: Fe E 400
Here Design is based on yield stress i.e.,
yt = 40.77 = 400 Mpa
(3.12)
d = 16.764≈17mm
ISSN: 2319-8753
I
nternational
J
ournal of
I
nnovative
R
esearch in
S
cience,
E
ngineering and
T
echnology
(An ISO 3297: 2007 Certified Organization)
Vol. 2, Issue 10, October 2013
Bearing Stress is calculated as,
But,
Bearing strength = 0.5×ultimate strength (3.13) = 0.5 × yt
= 0.5×400 = 200MPa Bearing Stress is,
(3.14)
t = 51.94mm≈52mm Shearing stress is calculated as,
(3.15)
But, b= t, therefore AShearing = 2×t×h
= 49.93Mpa Final dimensions are
d = 17mm t = 52mm
h = 2d= 2×17= 34mm
Al T6 7075 Design of pin:
Material used: Al T6 7075
Here Design is based on yield stress
We know that Stress is ratio of load by area i.e., (3.16)
d = 14.95≈15mm
Design of lug:
Bearing Stress is calculated as,
But,
Bearing strength = 0.5×ultimate strength (3.17) = 0.5× yt
= 0.5×503 = 251.5 M pa
Bearing Stress is,
(3.18)
ISSN: 2319-8753
I
nternational
J
ournal of
I
nnovative
R
esearch in
S
cience,
E
ngineering and
T
echnology
(An ISO 3297: 2007 Certified Organization)
Vol. 2, Issue 10, October 2013
t = 46.811mm≈47mm Shearing stress calculated as,
(3.19)
But, b=t, therefore, A shearing = 2 × t × h
= 62.60MPa Final dimensions are
d = 15mm t = 47mm
h = 2d = 2×15 = 30mm
III. FINITE ELEMENT ANALYSIS OF LANDING GEAR LUG ATTACHMENT
The finite element method (FEM) is a numerical technique for solving problems which are described by partial differential equations or can be formulated as functional minimization. A domain of interest is represented as an assembly of finite elements. The software used for the analysis of the Landing gear lug attachment joint in an Airframe is MSC Patran & MSC Nastran.
ANALYSIS OF LUG: Here the complete procedure carried in analysis of lug is explained in this section.
STEPS USED FOR ANALYSIS OF FEM MODEL: The important steps are done from creation of geometry model to until get results for FEM model.
1. The geometry is modeled for given dimensions by using MSC PATRAN. 2. The geometric structure is discretized using Quad elements as shown in Fig.5
3. After meshing, have to check things like equivalence, duplicates and boundary and after that we have to check the quality of mesh.
4. Important criteria considered here to check the quality of mesh, like aspect ratio, normal offset, wrap, and Jacobean ratio.
5. Type of material, elastic modules and Poisson ratio are input given for analysis. 6. Material properties are given for different subgroups.
7. Loads/Boundary conditions given to meshed model.
8. In Analysis we give output requests for displacements, stresses, grid point force balance, elemental forces etc.., 9. From analysis after applying the above requests we get BDF file, its containing all input data given to the model. 10. To solve the problem of analysis model MSC NASTRAN is used as solver.
11. After solving the problem from MSC NASTRAN, We get the XDB file, it contains output results. 12. Finally the post processing results are checked through MSC PATRAN.
13. Main quantities observed in result sheet are von-misses stress, stress components, elemental stresses.
14. The results obtained are plotted, which indicates that the material is safe as the stress is less than the yield strength of material.
Here the meshed model of landing gear lug attachment is shown in Fig.5 below. The attachment has mainly four parts i.e., lug, pin, clevis, and floor beams.
PROCEDURE OF ANALYSIS: Conceptual catiaV5 assembly to show location of lug in an aircraft is shown in Fig.4 below. The lug is used to join the oleo-strut and bulkhead of the fuselage. Thus this attachment has several parts such as floor beams, clevis etc.
ISSN: 2319-8753
I
nternational
J
ournal of
I
nnovative
R
esearch in
S
cience,
E
ngineering and
T
echnology
(An ISO 3297: 2007 Certified Organization)
Vol. 2, Issue 10, October 2013
Figure 4: Conceptual model of Landing gear lug attachment unit (Assembled) Initially the model is created in the catia v5 software as shown in Fig.5 (left) below.
The Fig.5 below shows the assembled model of landing gear lug attachment which consist mainly three parts viz., lug, clevis and floor beams.
Figure5: (Left) CatiaV5 model of landing gear lug assembly and lug. (Right) Meshed model of landing gear lug attachment
The model is prepared and meshed in preprocessor software patran as shown in Fig.6 below. The assembled model is extracted in patran software and it is meshed using quard elements as shown in Fig.6. The model consist pin, lug, clevis floor beams and rivets. The pins are connected using multi constrained points (MPC).
Then verification of model is checked. The quard & tria element parameters like normals, duplicates are checked and corrected.
Here the quality parameters of elements like aspect ratio, skew, jacobin, warpage, taper are varified. Then boundaries are checked i.e. the discontinuity of elements in meshed model. if any discontinuities are present then correction is to be done.
The loads and boundary condition is applied to model as shown in Fig.6 below.
Here the views of loads and boundary conditions are explained. The floor beams are constrained as shown in Fig.6 below. The floor beams are attached to bulkheads of the fuselage. The floor beam is fixed in all six directions.
Here the displacement is applied in all six dof i.e., Three translations (123) and three rotations (456) are constrained as shown in Fig.6.
The load obtained from calculation is applied on lug uniformly as shown inFig.6. Because the impact load, when nose landing gear touches the ground is transferred to the lug through oleo strut.
ISSN: 2319-8753
I
nternational
J
ournal of
I
nnovative
R
esearch in
S
cience,
E
ngineering and
T
echnology
(An ISO 3297: 2007 Certified Organization)
Vol. 2, Issue 10, October 2013
Then analysis is done with suitable outputs which produces .bdf file containing all input information.
The material properties like material, thickness, orientation etc., are defined. And loads and boundary conditions are applied. Then .bdf file is generated. .bdf file contains detailed inputs of problem.
With help of Nastran solver the .bdf file is solved, which generates .xdb file which contains solution to the problem. Then results are read using the post-processor Patran software.
Vertical load for material Fe E 400
Then the results are plotted for stress contour is plotted for vertical loads shown in Fig.7 (left) below.
Here the stress in the model is found to be 369.837MPa (37.7kg=mm2) which is less than the yield strength of material 400MPa. Thus the design is safe.
Figure 7: Stress contour for steel Fe E400 (Left) and Deformation contour for steel Fe E400 when vertical load is applied (Right)
The deformation contour is plotted as shown in Fig. 7 (Right) below.
The deformation is found to be 12.4mm which is in allowable limit 25mm. thus design is safe. Drag load for material Fe E 400
Now stress and deformation contour for drag load is checked. Drag load is nothing but the horizontal or transverse load.
The stress contour for drag load is plotted as shown in Fig.8 (left) below. The stress developed in model due to drag load is 73.97MPa (7.54kg=mm2), which is much less than the yield strength of material 400MPa.
Figure 8: Stress contour for steel Fe E400 (left) and Deformation contour for steel Fe E400 when drag load is applied (Right)
The Deformation contour for drag load is plotted as shown in Fig.7 (right).
The deformation of lug is found to be 4.65×10 -2mm which is much less and in allowable limit 25mm. Thus the design is safe.
Vertical load for material AL T6 7075
Then the results are plotted for stress contour is plotted for vertical load as shown in Fig.9 (left) below.
ISSN: 2319-8753
I
nternational
J
ournal of
I
nnovative
R
esearch in
S
cience,
E
ngineering and
T
echnology
(An ISO 3297: 2007 Certified Organization)
Vol. 2, Issue 10, October 2013
Figure 9: Stress contour for aluminum AL T6 7075 (Left) and Deformation contour for aluminum AL T6 7075 when vertical load is applied (Right)
The deformation contour is plotted as shown in Fig.9 (right) below.
The deformation is found to be 12.6mm which is in allowable limit 28mm.Thus design is safe. Drag load for material AL T6 7075
Now stress and deformation for drag load is checked.
Stress contour for drag load of AL T6 7075 as shown in Fig.10 (left) below. The stress developed in model due to drag load is 81.325MPa (8.29kg/mm2), which is much less than the yield strength of material 503MPa.
Figure 10: Stress contour for aluminum AL T6 7075 (Left) and Deformation contour for aluminum AL T6 7075 when drag load is applied (Right)
The deformation contour for drag load is plotted as shown in Fig.10 (right) below. The deformation of lug is found to be 4.60x102 mm which is much less and in allowable limit 28mm. Thus the design is safe.
IV. FATIGUE DESIGN OF THE LUG JOINT
Miner’s rule or the Palmgren-Miner linear damage hypothesis, states that where there are k different stress magnitudes in a spectrum, Si (1≤ I ≤ k), each contributing ni (Si) cycles, then if σi(Si) is the number of cycles to failure of a constant stress reversal Si, failure occurs when: (5.2)
C is experimentally found to be between 0.7 and 2.2. Usually for design purposes, C is assumed to be 1. This can be thought of as assessing what pro-portion of life is consumed by stress reversal at each magnitude then forming a linear combination of their aggregate.
Load calculated for static analysis of the lug is corresponding to 2G condition. Maximum load used = 117.72kN
Factor of safety =1.5
Therefore, Design load = 176.58kN Let consider, one cycle = one landing. Here design is for 50000 flights i.e., number of landing =50000.
Number of const amplitude fatigue cycles considered for nose landing gear bracket is =50000×2 = 1lakh cycles.
ISSN: 2319-8753
I
nternational
J
ournal of
I
nnovative
R
esearch in
S
cience,
E
ngineering and
T
echnology
(An ISO 3297: 2007 Certified Organization)
Vol. 2, Issue 10, October 2013
Figure 11: Constant amplitude stress history (One block) Fe E 400
Max stress corresponding to 176.58kN is 369.837MPa. During loading nose landing gear experiences 1G condition. The stress value at 1G condition is = = 110.853MPa (or 16.14ksi)
Here the maximum stress is 110.853MPa and minimum stress is 0MPa.
Therefore amp = 55.426MPa (or 8.07ksi))
Here fatigue life of a lug joint is discussed. The Fig.12 shows the S-N curve for steel Fe E 400 material. For stress 110.853MPa is found below fatigue limit when observed in Fig.12, Hence its safe-life design.
Figure 12: S-N curve for Steel Fe E 400 Al T6 7075
Max stress corresponding to 176.58kN is 369.837MPa. During loading nose landing gear experiences 1G condition. The stress value at 1G condition is = = 143.553MPa (or 20.9ksi)
Here the maximum stress is 20.9ksi and minimum stress is 0ksi.
Therefore amp = 71.77MPa (or 10.45ksi)
R = min/ max = 0
Here fatigue life of a lug joint is discussed. The Fig.13 shows the S-N curve for aluminum 7075 material.
For stress 143.553MPa, alternating stress 71.77MPa, and R=0 is found below 107cycle curve when observed in Fig.13. this indicates infinite life. Hence its safe-life design.
Figure 13: S-N curves for an Aluminum T6 7075
V. RESULTS AND DISCUSSIONS
ISSN: 2319-8753
I
nternational
J
ournal of
I
nnovative
R
esearch in
S
cience,
E
ngineering and
T
echnology
(An ISO 3297: 2007 Certified Organization)
Vol. 2, Issue 10, October 2013
Then we obtain dimensions of lug by SOM approach obtained. The vertical load obtained is 117.72kN. The factor safety is taken as 1.5times of vertical load which becomes 176.58kN.
The model is meshed then displacement and loads are applied. The stress contour and displacement contour is obtained which is discussed in third chapter.
For material Fe E400 has the yield strength of 400MPa. But the stress for vertical load obtained through analysis is 369.837MPa and stress for drag load is 73.9MPa which is less than yield strength hence design is safe.
For material Al T67075 has the yield strength of 503MPa. But the stress for vertical load obtained through analysis is 430.66MPa and stress for drag load is 81.325MPa which is less than yield strength hence design is safe.
But comparing both material, in Al T67075 the thickness if lug is 47mm and in Fe E400 the thickness of lug is 52mm. Thus less the material is less the weight which is important in aircraft. Hence aluminum Al T67075 is preferred. Thus the fatigue life estimation is carried for lug. Here the stress developed is below the fatigue limit when observed in S-N diagram. Thus the design is fail safe approach.
The fatigue life estimation is done for one lakh cycles i.e. one lakh landings. It means the damage or crack does not occur for required one lakh cycles.
But if its maximum stress is found above the limit, which gives value of Nf i.e. number of cycles. Thus, fatigue life is
where, Ni = induced cycles and Nf = number o f cycles Di < 1 then damage will not occur. i.e., crack doesn’t initiate.
Di = 1 at this condition crack initiation takes place.
Di > 1 then damage to the structure increases and life reduces. If Di is 2 means the life of structure is half of the designed cycles.
VI. CONCLUSION AND SCOPE OF FUTURE WORK
CONCLUSION: Landing gear lug joint is used to connect the landing gear unit to the fuselage. There are several varieties of lug joints & one of type is considered here for analysis.
Initially the load is calculated by strength of material approach & factor of safety is taken as 1.5times. Based on this lug dimensions are obtained. The drag load (1/4)th times of total vertical load, because the nose landing gear experiences 1G condition.
The lug joints made up of steel and aluminum material is analyzed using MSC Patran and Nastran, the stress contour is plotted and maximum stress is found below the stress limit thus the design is safe. And also the deformation contour is plotted, deformation is found below the safe limit thus the design is safe.
Then the results of analytical calculations are compared with results of finite element analysis. Hence the validation is done. The lug is subjected to repetitive loadings, So the fatigue life estimation done. It is concluded that lug joint designed is fail-safe & Need to check for damage after one lakh cycles.
SCOPE OF FUTURE WORK:
1. The shape optimization can be done.
2. Use of composite material may reduces weight & strength can be improved. 3. The complete hydraulic design & analysis of landing gear unit can be performed. 4. The test set up should be build & analysis can be performed on landing gear unit. 5. Fatigue test set up unit should be prepared & testing is performed.
ISSN: 2319-8753
I
nternational
J
ournal of
I
nnovative
R
esearch in
S
cience,
E
ngineering and
T
echnology
(An ISO 3297: 2007 Certified Organization)
Vol. 2, Issue 10, October 2013
REFERENCES
[1] Marcin Kurdelski, Andrzej Leski, Krzysztof Dragan Air Force Institute of Technology, Warsaw, Poland “Fatigue life analysis of main landing
gear pull-rod of the fighter jet aircraft”, 28th International Congress of the Aeronautical Sciences, 2012.
[2] Marcin Kurdelski Andrzej Leski Air Force Institute of Technology, Warsaw, Poland “Crack growth analysis of the landing gear pull rod of the
fighter jet aircraft”, Publisher: Institute of Aviation Scientific Publications, Review of Aeronautical Fatigue Investigations in Poland during the
period may 2009 to march 2011, 2011.
[3] B.K. Sriranga, Dr.C.σ. Chandrappa, R. Kumar and Dr.P.K. Dash, “Stress Analysis of Wing-Fuselage Lug Attachment Bracket of a Transport
Aircraft”, International Conference on Challenges and Opportunities in Mechanical
Engineering, Industrial Engineering and Management Studies 2012.
[4] Jong-Ho Kim, Soon-Bok Lee, Seong-Gu Hong , “Fatigue crack growth behaviour of Al7050-T7451 attachment lugs under flight spectrum variation”, Publisher: Elsevier Science, Journal: Theoretical and Applied Fracture Mechanics, Volume: 40 Issue: 2 (2003-09) Page: 135-144. 2003.
[5] τ. Gencoz, U.G. Goranson, R.R. Merrill , “Application of finite element analysis techniques for predicting crack propagation in lugs”.
International Journal of Fatigue Volume 2, Issue 3, July 1980, Pages 121–129.
[6] S. M. Beden, S. Abdullah, A.K Ariffin. “Review of Fatigue Crack Propagation Models for Metallic components” European Journal of Scientific
Research, 28(3):364-397,2009.
[7] Jarkko Tikka and Patria, “Fatigue life evaluation of critical locations in aircraft structures using virtual fatigue test”, International Congress of the
Aeronautical Sciences 2002.
[8] E. F. Bruhn, “Analysis and design of flight structure ”, 1973.
[9] Michel-chun-yung niu, “Aircraft structural design”, 1995.
[10] Aerospace engineering / March 1996 “landing gear structural integrity”. [11] Dr.R.K. Bansal “Strength of materials”4th edition.
[12] J. C. σewman, Jr, “Advances in fatigue and fracture mechanics analyses for aircraft structures”, Mechanics and Durability Branch, σASA
Langley Research Center, Hampton, VA, USA.
[13] Grigory I. σesterenko, “Service life of airplane structures”, Central Aerohydrodynamic Institute (TsAGI), Russia, 2002.
[14] C.M. Sonsino, “Course of Sσ-curves especially in the high-cycle fatigue regime with regard to component design and safety”, Int. J. of Fatigue