Development of a Suitable Framework for Empirical Evaluation of
Pattern Classification Systems to Improve Performance and
Enhance Security
V.Naveen Kumar
1; A.Hanuman Prasad
2; B.Manasa
3& Prof.Dr.G.Manoj
Someswar
41
M.Tech. (CSE), AMR Institute of Technology (Affiliated to JNTUH), RR District, Telangana, India.
2
M.Tech.(CSE), Associate Professor, AMR Institute of Technology (Affiliated to JNTUH), RR District,
Telangana, India.
3
M.Tech. (CSE), Associate Professor & HOD, AMR Institute of Technology (Affiliated to JNTUH), RR
District, Telangana, India.
4
Principal & Professor, Department of CSE, NRI Institute of Technology (Affiliated to JNTUH),
Greater Hyderabad, Telangana, India.
ABSTRACT:
Pattern classification systems are commonly used in adversarial applications like biometric
authentication, network intrusion detection and spam filtering, in which data can be purposely
manipulated by humans to undermine their operation. As this adversarial scenario is not taken into
account by classical design methods, pattern classification systems may exhibit vulnerabilities, whose
exploitation may severely affect their performance, and consequently limit their practical utility.
Extending pattern classification theory and design methods to adversarial settings is thus a novel and
very relevant research direction, which has not yet been pursued in a systematic way. In this research
paper, we address one of the main open issues: evaluating at design phase the security of pattern
classifiers, namely, the performance degradation under potential attacks they may incur during
operation. We propose a framework for empirical evaluation of classifier security that formalizes and
generalizes the main ideas proposed in the literature, and give examples of its use in three real
applications. Reported results show that security evaluation can provide a more complete understanding
of the classifier’s behaviour in adversarial environments and lead to better design choices.
INTRODUCTION
Figure1: Structure of Data Mining
Generally, data mining (sometimes called data or knowledge discovery) is the process of analyzing data from different perspectives and summarizing it into useful information - information that can be used to increase revenue, cuts costs, or both. Data mining software is one of a number of analytical tools for analyzing data. It allows users to analyze data from many different dimensions or angles, categorize it, and summarize the relationships identified. Technically, data mining is the process of finding correlations or patterns among dozens of fields in large relational databases.[1]
While large-scale information technology has been evolving separate transaction and analytical systems, data mining provides the link between the two. Data mining software analyzes relationships and patterns in stored transaction data based on open-ended user queries. Several types of analytical software are available: statistical, machine learning, and neural
networks. Generally, any of four types of
relationships are sought:
Classes: Stored data is used to locate data in predetermined groups.[2] For example, a restaurant chain could mine customer purchase data to determine when customers visit and what they typically order. This information could be used to increase traffic by having daily specials.
Clusters: Data items are grouped according
to logical relationships or consumer
preferences. For example, data can be mined to identify market segments or consumer affinities.
Associations: Data can be mined to identify associations. The beer-diaper example is an example of associative mining.
Sequential patterns: Data is mined to anticipate behavior patterns and trends.[3] For example, an outdoor equipment retailer could predict the likelihood of a backpack being purchased based on a consumer's purchase of sleeping bags and hiking shoes.[4]
Data mining consists of five major elements:
1) Extract, transform, and load transaction
data onto the data warehouse system.
2) Store and manage the data in a
multidimensional database system.
3) Provide data access to business analysts
and information technology
professionals.
4) Analyze the data by application
software.
5) Present the data in a useful format, such
as a graph or table.[5]
Different levels of analysis are available:
Artificial neural networks: Non-linear predictive models that learn through training and resemble biological neural networks in structure.
Genetic algorithms: Optimization techniques that use process such as genetic combination, mutation, and natural selection in a design based on the concepts of natural evolution.[6]
Decision trees: Tree-shaped structures that represent sets of decisions. These decisions generate rules for the classification of a dataset. Specific decision tree methods include Classification and Regression Trees
(CART) and Chi Square Automatic
of rules that you can apply to a new (unclassified) dataset to predict which records will have a given outcome. CART segments a dataset by creating 2-way splits while CHAID segments using chi square tests to create multi-way splits. CART typically requires less data preparation than CHAID.
Nearest neighbor method: A technique that classifies each record in a dataset based on a
combination of the classes of the k record(s)
most similar to it in a historical dataset
(where k=1). Sometimes called the k-nearest
neighbor technique.
Rule induction: The extraction of useful if-then rules from data based on statistical significance.[7]
Data visualization: The visual interpretation of complex relationships in multidimensional data. Graphics tools are used to illustrate data relationships.
Characteristics of Data Mining:
Large quantities of data: The volume of data so great it has to be analyzed by
automated techniques e.g. satellite
information, credit card transactions etc.
Noisy, incomplete data: Imprecise data is the characteristic of all data collection.
Complex data structure: conventional statistical analysis not possible
Heterogeneous data stored in legacy systems[8]
Benefits of Data Mining:
1) It’s one of the most effective services that
are available today. With the help of data
mining, one can discover precious
information about the customers and their behavior for a specific set of products and evaluate and analyze, store, mine and load data related to them
2) An analytical CRM model and strategic
business related decisions can be made with
the help of data mining as it helps in providing a complete synopsis of customers
3) An endless number of organizations have
installed data mining projects and it has helped them see their own companies make an unprecedented improvement in their marketing strategies (Campaigns)[9]
4) Data mining is generally used by
organizations with a solid customer focus. For its flexible nature as far as applicability is concerned is being used vehemently in applications to foresee crucial data including industry analysis and consumer buying behaviors
5) Fast paced and prompt access to data along
with economic processing techniques have made data mining one of the most suitable services that a company seek[10]
Advantages of Data Mining: 1. Marketing / Retail:
Data mining helps marketing companies build models based on historical data to predict who will respond to the new marketing campaigns such as direct mail, online marketing campaign…etc. Through the results, marketers will have appropriate approach to sell profitable products to targeted customers.
Data mining brings a lot of benefits to retail companies in the same way as marketing. Through market basket analysis, a store can have an appropriate production arrangement in a way that customers can buy frequent buying products together with pleasant. In addition, it also helps the retail companies offer certain discounts for particular products that will attract more customers.[11]
2. Finance / Banking
Data mining gives financial institutions
mining helps banks detect fraudulent credit card transactions to protect credit card’s owner.[12]
3. Manufacturing
By applying data mining in operational engineering data, manufacturers can detect faulty
equipments and determine optimal control
parameters. For example semi-conductor
manufacturers has a challenge that even the conditions of manufacturing environments at different wafer production plants are similar, the quality of wafer are lot the same and some for unknown reasons even has defects. Data mining has been applying to determine the ranges of control parameters that lead to the production of golden wafer. Then those optimal control parameters are used to manufacture wafers with desired quality.[13]
4. Governments
Data mining helps government agency by digging and analyzing records of financial transaction to build patterns that can detect money laundering or criminal activities.
5. Law enforcement:
Data mining can aid law enforcers in identifying criminal suspects as well as apprehending these criminals by examining trends in location, crime type, habit, and other patterns of behaviors.
6. Researchers:
Data mining can assist researchers by speeding up their data analyzing process; thus, allowing those more time to work on other projects. [14]
LITERATURE SURVEY
In this research paper, we address the security of multimodal biometric systems when one of the modes is successfully spoofed. We propose two novel fusion schemes that can increase the security of multimodal biometric systems. The first is an extension of the likelihood ratio based fusion scheme and the other uses fuzzy logic. Besides the matching score and sample quality score, our proposed fusion schemes also take into account the intrinsic security of each biometric system being fused.Experimental results have shown that the
proposed methods are more robust against spoof attacks when compared with traditional fusion methods In biometric systems, the threat of “spoofing”, where an imposter will fake a biometric trait, has lead to the increased use of multimodal biometric systems. It is assumed that an imposter must spoof all modalities in the system to be accepted. This research paper looks at the cases where some but not all modalities are spoofed. The contribution of this paper is to outline a method for assessment of multimodal systems and underlying fusion algorithms. The framework for this method is described and experiments are conducted on a multimodal database of face, iris, and fingerprint match scores.[15]
A very effective means to evade signature-based intrusion detection systems (IDS) is to employ polymorphic techniques to generate attack instances that do not share a fixed signature. Anomaly-based intrusion detection systems provide good defense because existing polymorphic techniques can make the attack instances look different from each other, but cannot make them look like normal. In this paper we introduce a new class of polymorphic attacks, called polymorphic blending attacks, that can effectively evade byte frequency-based network anomaly IDS by carefully matching the statistics of the mutated attack instances to the normal profiles. The proposed polymorphic blending attacks can be viewed as a subclass of the mimicry attacks. We take a systematic approach to the problem and formally describe the algorithms and steps required to carry out such attacks. We not only show that such attacks are feasible but also analyze the hardness of evasion under different circumstances. We present detailed techniques using PAYL, a byte frequency-based anomaly IDS, as a case study and demonstrate that these attacks are indeed feasible. We also provide some insight into possible countermeasures that can be used as defense.
devise new ways to stem the flood of bulk mail, spammers respond by working their way around the new mechanisms. Their attempts to bypass spam filters illustrates this struggle. Spammers have tried many things from using HTML layout tricks, letter substitution, to adding random data. While at times their attacks are clever, they have yet to work strongly against the statistical nature that drives
many filtering systems. The challenges in
successfully developing such an attack are great as the variety of filtering systems makes it less likely that a single attack can work against all of them. Here, we examine the general attack methods spammers use, along with challenges faced by developers and spammers. We also demonstrate an attack that, while easy to implement, attempts to more strongly work against the statistical nature behind filters.
Unsolicited commercial email is a
significant problem for users and providers of email services. While statistical spam filters have proven useful, senders of spam are learning to bypass these filters by systematically modifying their email messages. In a good word attack, one of the most common techniques, a spammer modifies a spam message by inserting or appending words indicative of legitimate email. In this paper, we describe and evaluate the effectiveness of active and passive good word attacks against two types of statistical spam filters: naive Bayes and maximum entropy filters. We find that in passive attacks without any filter feedback, an attacker can get 50 % of currently blocked spam past either filter by adding 150 words or fewer. In active attacks allowing test queries to the target filter, 30 words will get half of blocked spam past either filter.
SYSTEM STUDY FEASIBILITY STUDY
The feasibility of the project is analyzed in this phase and business proposal is put forth with a very general plan for the project and some cost estimates. During system analysis the
feasibility study of the proposed system is to be carried out. This is to ensure that the proposed system is not a burden to the company. For feasibility analysis, some understanding of the major requirements for the system is essential.
Three key considerations involved in the feasibility analysis are
ECONOMICAL FEASIBILITY
TECHNICAL FEASIBILITY
SOCIAL FEASIBILITY
ECONOMICAL FEASIBILITY
This study is carried out to check the economic impact that the system will have on the organization. The amount of fund that the company can pour into the research and development of the system is limited. The expenditures must be justified. Thus the developed system as well within the budget and this was achieved because most of the technologies used are freely available. Only the customized products had to be purchased.
TECHNICAL FEASIBILITY
This study is carried out to check the
technical feasibility, that is, the technical
requirements of the system. Any system developed must not have a high demand on the available technical resources. This will lead to high demands on the available technical resources. This will lead to high demands being placed on the client. The developed system must have a modest requirement, as only minimal or null changes are required for implementing this system.
SOCIAL FEASIBILITY
also able to make some constructive criticism, which is welcomed, as he is the final user of the system.
SYSTEM DESIGN
SYSTEM ARCHITECTURE:
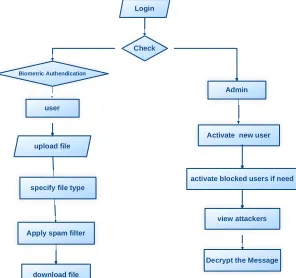
Figure 2: System Architecture DATA FLOW DIAGRAM:
1. The DFD is also called as bubble chart. It is
a simple graphical formalism that can be used to represent a system in terms of input data to the system, various processing carried out on this data, and the output data is generated by this system.
2. The data flow diagram (DFD) is one of the
most important modeling tools. It is used to model the system components. These components are the system process, the data used by the process, an external entity that
interacts with the system and the
information flows in the system.
3. DFD shows how the information moves
through the system and how it is modified by a series of transformations. It is a graphical technique that depicts information flow and the transformations that are applied as data moves from input to output.
4. DFD is also known as bubble chart. A DFD
may be used to represent a system at any level of abstraction. DFD may be partitioned
into levels that represent increasing
information flow and functional detail.
upload file
download file
Login
user
Admin
Activate new user
view attackers
Decrypt the Message Check
Biometric Authendication
Apply spam filter specify file type
activate blocked users if need
Figure 3: Data Flow Diagram UML DIAGRAMS
UML stands for Unified Modeling
Language. UML is a standardized general-purpose modeling language in the field of object-oriented software engineering. The standard is managed, and was created by, the Object Management Group.
The goal is for UML to become a common language for creating models of object oriented computer software. In its current form UML is comprised of two major components: a Meta-model and a notation. In the future, some form of method or process may also be added to; or associated with, UML.
The Unified Modeling Language is a standard language for specifying, Visualization, Constructing and documenting the artifacts of software system, as well as for business modeling and other non-software systems.
The UML represents a collection of best engineering practices that have proven successful in the modeling of large and complex systems.
The UML is a very important part of developing objects oriented software and the software development process. The UML uses mostly graphical notations to express the design of software projects.
GOALS:
1. Provide users a ready-to-use, expressive visual modeling Language so that they can develop and exchange meaningful models.
2. Provide extendibility and specialization
mechanisms to extend the core concepts.
3. Be independent of particular programming
languages and development process.
4. Provide a formal basis for understanding the
modeling language.
5. Encourage the growth of OO tools market.
6. Support higher level development concepts
such as collaborations, frameworks, patterns and components.
7. Integrate best practices.
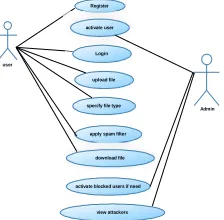
USE CASE DIAGRAM:
A use case diagram in the Unified Modeling Language (UML) is a type of behavioral diagram defined by and created from a Use-case analysis. Its purpose is to present a graphical overview of the functionality provided by a system in terms of actors, their goals (represented as use cases), and any dependencies between those use cases. The main purpose of a use case diagram is to show what system functions are performed for which actor. Roles of the actors in the system can be depicted.
user
Admin Register
Login
upload file
specify file type
apply spam filter
download file activate user
activate blocked users if need
view attackers
Figure 4: Use Case Diagram CLASS DIAGRAM:
In software engineering, a class diagram in the Unified Modeling Language (UML) is a type of static structure diagram that describes the structure of a system by showing the system's classes, their attributes, operations (or methods), and the relationships among the classes. It explains which class contains information.
Figure 5: Class Diagram SEQUENCE DIAGRAM:
A sequence diagram in Unified Modeling Language (UML) is a kind of interaction diagram that shows how processes operate with one another and in what order. It is a construct of a Message Sequence Chart. Sequence diagrams are sometimes called event diagrams, event scenarios, and timing diagrams.
User
Login with biometric
Admin
activate user
Data base
Registration
upload file
specify file type
apply spam filter
download file
activate blocked user
monitor user activities
find attacker
Figure 6: Sequence Diagram ACTIVITY DIAGRAM:
Activity diagrams are graphical
A
A Login
upload file user
Download file specify file type
yes
apply spam filter
Activate users
activate blocked users if need admin
biometric authendication
view attacker
monitor user activities
Figure 7: Activity Diagram INPUT DESIGN
The input design is the link between the information system and the user. It comprises the developing specification and procedures for data preparation and those steps are necessary to put transaction data in to a usable form for processing can be achieved by inspecting the computer to read data from a written or printed document or it can occur by having people keying the data directly into the system. The design of input focuses on controlling the amount of input required, controlling the errors, avoiding delay, avoiding extra steps and keeping the process simple. The input is designed in such a way so that it provides security and ease of use with retaining the privacy. Input Design considered the following things:
What data should be given as input?
How the data should be arranged or
coded?
The dialog to guide the operating
personnel in providing input.
Methods for preparing input validations
and steps to follow when error occur.
OBJECTIVES
1. Input Design is the process of converting a user-oriented description of the input into a computer-based system. This design is important to avoid errors in the data input process and show the correct direction to the management for getting correct information from the computerized system.
2. It is achieved by creating user-friendly screens for the data entry to handle large volume of data. The goal of designing input is to make data entry easier and to be free from errors. The data entry screen is designed in such a way that all the data manipulates can be performed. It also provides record viewing facilities.
3. When the data is entered it will check for its validity. Data can be entered with the help of screens. Appropriate messages are provided as when needed so that the user will not be in maize of instant. Thus the objective of input design is to create an input layout that is easy to follow
OUTPUT DESIGN
A quality output is one, which meets the requirements of the end user and presents the information clearly. In any system results of processing are communicated to the users and to other system through outputs. In output design it is determined how the information is to be displaced for immediate need and also the hard copy output. It is the most important and direct source information to the user. Efficient and intelligent output design improves the system’s relationship to help user decision-making.
1. Designing computer output should proceed in an organized, well thought out manner; the right output must be developed while ensuring that each output element is designed so that people will find the system can use easily and effectively. When analysis design computer output, they should Identify the specific output that is needed to meet the requirements.
2. Select methods for presenting information.
3. Create document, report, or other formats that contain information produced by the system.
The output form of an information system should accomplish one or more of the following objectives.
Convey information about past activities,
current status or projections of the
Signal important events, opportunities, problems, or warnings.
Trigger an action.
Confirm an action.
SYSTEM ANALYSIS EXISTING SYSTEM:
Pattern classification systems based on classical theory and design methods do not take into
account adversarial settings; they exhibit
vulnerabilities to several potential attacks, allowing adversaries to undermine their effectiveness. A systematic and unified treatment of this issue is thus needed to allow the trusted adoption of pattern classifiers in adversarial environments, starting from the theoretical foundations up to novel design methods, extending the classical design cycle of. In particular, three main open issues can be identified: (i) analyze the vulnerabilities of classification algorithms, and the corresponding attacks. (ii) Developing novel methods to assess classifier security against these attacks, which are not possible using classical performance evaluation methods. (iii) Developing novel design methods to guarantee classifier security in adversarial environments.
DISADVANTAGES OF EXISTING SYSTEM:
1. Poor analyzing the vulnerabilities of classification algorithms, and the corresponding attacks.
2. A malicious webmaster may manipulate search engine rankings to artificially promote website.
PROPOSED SYSTEM:
In this research work, we address issues above by developing a framework for the empirical evaluation of classifier security at design phase that extends the model selection and performance evaluation steps of the classical design cycle .We summarize previous work, and point out three main ideas that emerge from it. We then formalize and generalize them in our framework. First, to pursue security in the context of an arms race it is not sufficient to react to observed attacks, but it is also necessary to proactively anticipate the adversary by predicting the most relevant, potential attacks
through a what-if analysis; this allows one to develop suitable countermeasures before the attack actually occurs, according to the principle of security by design. Second, to provide practical guidelines for simulating realistic attack scenarios, we define a general model of the adversary, in terms of her goal, knowledge, and capability, which encompass and generalize models proposed in previous work. Third, since the presence of carefully targeted attacks may affect the distribution of training and testing data separately, we propose a model of the data distribution that can formally characterize this behaviour, and that allows us to take into account a large number of potential attacks; we also propose an algorithm for the generation of training and testing sets to be used for security evaluation, which can naturally accommodate application-specific and heuristic techniques for simulating attacks.
ADVANTAGES OF PROPOSED SYSTEM:
1. Proposed system prevents developing novel methods to assess classifier security against these attacks.
2. The presence of an intelligent and adaptive adversary makes the classification problem highly non-stationary.
SYSTEM TESTING
The purpose of testing is to discover errors. Testing is the process of trying to discover every conceivable fault or weakness in a work product. It provides a way to check the functionality of components, sub assemblies, assemblies and/or a finished product It is the process of exercising software with the intent of ensuring that the Software system meets its requirements and user expectations and does not fail in an unacceptable manner. There are various types of test. Each test type addresses a specific testing requirement.
TYPES OF TESTS Unit testing
produce valid outputs. All decision branches and internal code flow should be validated. It is the testing of individual software units of the application .it is done after the completion of an individual unit before integration. This is a structural testing, that relies on knowledge of its construction and is invasive. Unit tests perform basic tests at component level and test a specific business process, application, and/or system configuration. Unit tests ensure that each unique path of a business process
performs accurately to the documented
specifications and contains clearly defined inputs and expected results.
Integration testing
Integration tests are designed to test integrated software components to determine if they actually run as one program. Testing is event driven and is more concerned with the basic outcome of screens or fields. Integration tests demonstrate that
although the components were individually
satisfaction, as shown by successfully unit testing, the combination of components is correct and consistent. Integration testing is specifically aimed at exposing the problems that arise from the combination of components.
Functional test
Functional tests provide systematic
demonstrations that functions tested are available as specified by the business and technical requirements, system documentation, and user manuals.
Functional testing is centered on the following items:
Valid Input : identified classes of valid input must be accepted.
Invalid Input : identified classes of invalid input must be rejected.
Functions : identified functions must be exercised.
Output : identified classes of application outputs must be exercised.
Systems/Procedures: interfacing systems or
procedures must be invoked.
Organization and preparation of functional
tests is focused on requirements, key functions, or special test cases. In addition, systematic coverage pertaining to identify Business process flows; data
fields, predefined processes, and successive
processes must be considered for testing. Before functional testing is complete, additional tests are identified and the effective value of current tests is determined.
System Test
System testing ensures that the entire
integrated software system meets requirements. It tests a configuration to ensure known and predictable results. An example of system testing is the configuration oriented system integration test. System testing is based on process descriptions and flows, emphasizing pre-driven process links and integration points.
White Box Testing
White Box Testing is a testing in which in which the software tester has knowledge of the inner workings, structure and language of the software, or at least its purpose. It is purpose. It is used to test areas that cannot be reached from a black box level.
Black Box Testing
Black Box Testing is testing the software without any knowledge of the inner workings, structure or language of the module being tested. Black box tests, as most other kinds of tests, must be written from a definitive source document, such as specification or requirements document, such as specification or requirements document. It is a testing in which the software under test is treated, as a black box .you cannot “see” into it. The test provides inputs and responds to outputs without considering how the software works.
Unit Testing:
Test strategy and approach
Field testing will be performed manually and functional tests will be written in detail.
Test objectives
All field entries must work properly.
Pages must be activated from the identified
link.
The entry screen, messages and responses
must not be delayed.
Features to be tested
Verify that the entries are of the correct
format
No duplicate entries should be allowed
All links should take the user to the correct
page.
Integration Testing
Software integration testing is the
incremental integration testing of two or more integrated software components on a single platform to produce failures caused by interface defects.
The task of the integration test is to check that components or software applications, e.g. components in a software system or – one step up – software applications at the company level – interact without error.
Test Results: All the test cases mentioned above passed successfully. No defects encountered.
Acceptance Testing
User Acceptance Testing is a critical phase of any project and requires significant participation by the end user. It also ensures that the system meets the functional requirements.
Test Results: All the test cases mentioned above passed successfully. No defects encountered.
IMPLEMENTATION MODULES:
1. Attack Scenario and Model of the Adversary
2. Pattern Classification
3. Adversarial classification:
4. Security modules
MODULES DESCRIPTION:
Attack Scenario and Model of the Adversary:
Although the definition of attack scenarios is ultimately an application-specific issue, it is possible to give general guidelines that can help the designer of a pattern recognition system. Here we propose to specify the attack scenario in terms of a conceptual model of the adversary that encompasses, unifies, and extends different ideas from previous work. Our model is based on the assumption that the adversary acts rationally to attain a given goal, according to her knowledge of the classifier, and her capability of manipulating data. This allows one to derive the corresponding optimal attack strategy.
Pattern Classification:
Multimodal biometric systems for personal identity recognition have received great interest in the past few years. It has been shown that combining information coming from different biometric traits can overcome the limits and the weaknesses inherent in every individual biometric, resulting in a higher accuracy. Moreover, it is commonly believed that multimodal systems also improve security against Spoofing attacks, which consist of claiming a false identity and submitting at least one fake biometric trait to the system (e.g., a “gummy” fingerprint or a photograph of a user’s face). The reason is that, to evade multimodal system, one expects that the adversary should spoof all the corresponding biometric traits. In this application example, we show how the designer of a multimodal system can verify if this hypothesis holds, before deploying the system, by simulating spoofing attacks against each of the matchers.
Adversarial classification:
Security modules:
Intrusion detection systems analyze network traffic to prevent and detect malicious activities like intrusion attempts, ROC curves of the considered multimodal biometric system under a simulated spoof attack against the fingerprint or the face matcher. Port scans, and denial-of-service attacks. When suspected malicious traffic is detected, an alarm is raised by the IDS and subsequently handled by the system administrator. Two main kinds of IDSs exist: misuse detectors and anomaly-based ones. Misuse detectors match the analyzed network traffic against a database of signatures of known malicious activities. The main drawback is that they are not able to detect never-before-seen malicious activities, or even variants of known ones. To overcome this issue, anomaly-based detectors have been proposed. They build a statistical model of the normal traffic using machine learning techniques, usually one-class classifiers, and raise an alarm when anomalous traffic is detected. Their training set is constructed, and periodically updated to follow the changes of normal traffic, by collecting unsupervised network traffic during operation, assuming that it is normal (it can be filtered by a misuse detector, and should)
RESULTS AND CONCLUSION
In this research paper, we focused on empirical security evaluation of pattern classifiers
that have to be deployed in adversarial
environments, and proposed how to revise the classical performance evaluation design step, which is not suitable for this purpose.
Our main contribution is a framework for empirical security evaluation that formalizes and generalizes ideas from previous work, and can be applied to different classifiers, learning algorithms, and classification tasks. It is grounded on a formal model of the adversary, and on a model of data distribution that can represent all the attacks considered in previous work; provides a systematic method for the generation of training and testing sets
that enables security evaluation; and can
accommodate application-specific techniques for attack simulation. This is a clear advancement with respect to previous work, since without a general framework most of the proposed techniques (often tailored to a given classifier model, attack, and application) could not be directly applied to other problems.
An intrinsic limitation of our work is that security evaluation is carried out empirically, and it is thus data dependent; on the other hand, model-driven analyses [12], [17], [38] require a full analytical model of the problem and of the adversary’s behavior, that may be very difficult to develop for real-world applications. Another intrinsic limitation is due to fact that our method is not application-specific, and, therefore, provides only high-level guidelines for simulating attacks. Indeed, detailed guidelines require one to take into
account application-specific constraints and
adversary models. Our future work will be devoted to develop techniques for simulating attacks for different applications.
Although the design of secure classifiers is a distinct problem than security evaluation, our framework could be also exploited to this end. For instance, simulated attack samples can be included into the training data to improve security of discriminative classifiers (e.g., SVMs), while the proposed data model can be exploited to design more secure generative classifiers. We obtained encouraging preliminary results on this topic
REFERENCES
[1] R.N. Rodrigues, L.L. Ling, and V. Govindaraju, “Robustness of Multimodal Biometric Fusion Methods against Spoof Attacks,” J. Visual Languages and Computing, vol. 20, no. 3, pp. 169-179, 2009.
Effort (Spoof) Imposters,” Proc. IEEE Int’l Workshop Information Forensics and Security, pp. 1-5, 2010.
[3] P. Fogla, M. Sharif, R. Perdisci, O. Kolesnikov, and W. Lee, “Polymorphic Blending Attacks,” Proc. 15th Conf. USENIX Security Symp., 2006.
[4] G.L. Wittel and S.F. Wu, “On Attacking Statistical Spam Filters,” Proc. First Conf. Email and Anti-Spam, 2004.
[5] D. Lowd and C. Meek, “Good Word Attacks on Statistical Spam Filters,” Proc. Second Conf. Email and Anti-Spam, 2005.
[6] A. Kolcz and C.H. Teo, “Feature Weighting for Improved Classifier Robustness,” Proc. Sixth Conf. Email and Anti-Spam, 2009.
[7] D.B. Skillicorn, “Adversarial Knowledge Discovery,” IEEE Intelligent Systems, vol. 24, no. 6, Nov./Dec. 2009.
[8] D. Fetterly, “Adversarial Information Retrieval: The Manipulation of Web Content,” ACM Computing Rev., 2007.
[9] R.O. Duda, P.E. Hart, and D.G. Stork, Pattern Classification. Wiley-Interscience Publication, 2000.
[10] N. Dalvi, P. Domingos, Mausam, S. Sanghai, and D. Verma, “Adversarial Classification,” Proc. 10th ACM SIGKDD Int’l Conf. Knowledge Discovery and Data Mining, pp. 99-108, 2004.
[11] M. Barreno, B. Nelson, R. Sears, A.D. Joseph, and J.D. Tygar, “Can Machine Learning be Secure?” Proc. ACM Symp. Information, Computer and Comm. Security (ASIACCS), pp. 16-25, 2006.
[12] A.A. C_ardenas and J.S. Baras, “Evaluation of Classifiers: Practical Considerations for Security Applications,” Proc. AAAI Workshop Evaluation Methods for Machine Learning, 2006.
[13] P. Laskov and R. Lippmann, “Machine Learning in Adversarial Environments,” Machine Learning, vol. 81, pp. 115-119, 2010.
[14] L. Huang, A.D. Joseph, B. Nelson, B. Rubinstein, and J.D. Tygar, “Adversarial Machine Learning,” Proc. Fourth ACM Workshop Artificial Intelligence and Security, pp. 43-57, 2011.
[15] M. Barreno, B. Nelson, A. Joseph, and J. Tygar, “The Security of Machine Learning,” Machine