ISSN: 2278-067X, Volume 1, Issue 6 (June 2012), PP.17-24
www.ijerd.com
Liver Classification Using Modified Rotation Forest
Bendi Venkata Ramana
1, Prof. M.Surendra Prasad Babu
21
Associate Professor, Dept.of IT, AITAM, Tekkali, A.P. India.
2
Dept. of CS&SE, Andhra University, Visakhapatnam-530 003, A.P, India,
Abstract––Eesembling Classification techniques have been widely used in the medical field for accurate classification
than an individual classifier. Modified Rotation Forest algorithm was proposed for accurate liver classification by analyzing the combination of selected classification algorithm and feature selection technique. Selected classification algorithms were considered from each category of classification algorithms. The category of classification algorithms are Tree based, Statistical based, Neural Networks based, Rule based and Lazy learners. Modified Rotation Forest algorithm for UCI liver data set has multi layer perception classification algorithm and Random Subset feature selection technique and for INDIA liver data set has nearest neighbour with generalized distance function and correlation based feature selection technique.
Keywords––Ensemble Classifier, Data Mining, Liver diagnosis, Classification, Feature selection
I.
INTRODUCTION
Classification techniques are very popular in various automatic medical diagnoses tools. Problems with liver patients are not easily discovered in an early stage as it will be functioning normally even when it is partially damaged [1]. An early diagnosis of liver problems will increase patient’s survival rate. Liver disease can be diagnosed by analyzing the levels of enzymes in the blood [].
Selected classification algorithms were combined with selected feature selection methods to identify the best combination of classification algorithm and feature selection to modify the Rotation Forest algorithm for accurate classification liver data.
In this paper, J48 and simple cart classification algorithms are from tree based algorithms, Naïve bayes and Bayes net classification algorithms are from statistical based algorithms, MLP and SMO classification algorithms are from multi layer perception based algorithms, IBK and KStar classification algorithms are from lazy learners and PART
Figure 1. The combinations of classification algorithms and feature selection methods
and Zero classification algorithms are from rule based algorithms with all the combinations of Principal component analysis (PCA), Correlation based feature selection (CFS), Random projection and Random subset feature selection methods were considered for evaluating best combination of classification algorithm and feature selection method for modified rotation forest algorithm for UCI and INDIA liver data sets.
Two Liver patient data sets were used in this study, one is from Andhra Pradesh state of India and the second one is BUPA Liver Disorders datasets taken from University of California at Irvine (UCI) Machine Learning Repository [4]. In this experimentation, 10-fold cross-validation have been used. This paper concentrates on performance of combination of classification algorithms with feature selection methods.
Kun- Hong Liu and De-Shuang Huang [1] addressed the microarray dataset based cancer classification using rotation forest. Principal component analysis (PCA) was applied to feature transformation in the original rotation forest. In this paper Independent component analysis (ICA) was applied on breast cancer dataset and prostate dataset to validate the efficiency of rotation forest. The experimental results shows that ICA improves the performance of rotation forest compared with original transformation methods.
Juan J. Rodrı´guez et al. [2] proposed a method for generating classifier ensembles based on feature extraction. The idea of the rotation approach is to encourage simultaneously individual accuracy and diversity within the ensemble. The experimental results with 33 data sets from UCI Machine Learning Repository showed that Rotation Forest outperformed all three methods by a large margin.
Akin Ozcift and Arif Gultenb [3] constructed rotation forest (RF) ensemble classifiers of 30 machine learning algorithms to evaluate their classification performances using Parkinson’s, diabetes and heart diseases from literature. Experiments demonstrate that RF, as a newly proposed ensemble algorithm, proves itself to be efficient to increase classifier accuracies significantly.
Bendi Venkata Ramana et al. [5] compared popular Classification Algorithms for evaluating their classification performance in terms of Accuracy, Precision, Sensitivity and Specificity in classifying liver patients dataset. Accuracy, Precision, Sensitivity and Specificity are better for the AP Liver Dataset compared to UCLA liver datasets with all the selected algorithms. This can be attributed to more number of useful attributes like Total bilirubin, Direct bilirubin, Indirect bilirubin
Bendi Venkata Ramana et al. [7] proposed Bayesian Classification for diagnosis of liver diseases. The Bayesian Classification is combined with Bagging and Boosting for better accuracy. This accuracy can be further improved with huge amount of data.
Bendi Venkata Ramana et al. [8] proposed ANOVA and MANOVA for population comparision between ILPD data set and UCI data set. The results indicates that there exists more significant difference in the groups with all the possible attribute combinations except analysis on SGPT between non liver patients of UCI and INDIA data sets.
Bendi Venkata Ramana et al. [9] proposed Bayesian classification for accurate liver disease diagnosis and its accuracy further improved using
Wei Wanga et al. [11] introduced a multiple classifier ensemble approach based on performance evaluation, and apply it to segmenting tissue regions, especially the biomarker aceto white tissue in digitized uterine cervix images. The multiple classifier system uses a multi-observer segmentation evaluation tool (MOSES) to train and combine SVM classifiers. Experimental results show that the proposed classifier ensemble performs better than a single SVM classifier.
Bing Chen and Hua-Xiang Zhang [12] proposed an approach of multiple classifiers ensemble based on feature selection (FSCE) In order to improve the classification performance of classifiers. FSCE is tested on the UCI benchmark data sets, and compared classification efficiency with member classifiers trained based on the algorithm of Adaboost.
Manju Bhardwaj et al. [13] proposed and empirically evaluate a novel method for generating members of ensemble based on ’learning from- mistakes’ paradigm. SVM is used as the base learner, and a series of dependent classifiers is obtained using model based instance selection method. Simple majority voting has been used to combine learners. It is found that the ensemble created shows better accuracy as compared to the ensembles created using AdaBoost, MAdaBoost, Bagging and Arc-x4SVM.
Lishuang LI [14] presented a gene mention tagging system which utilizes the two-layer stacking classifiers ensemble method to combine multiple powerful machine learning frameworks. The two-layer stacking algorithm is a more effective classifiers ensemble method than voting and simple set operation methods.
M. F. Amasyali [15] compared 12 single classifiers and 11 classifier ensembles over 36 datasets according to Classification accuracy and execution time. According to classification accuracy the best 6 algorithms are ordered as Rotation Forest, Random Committees, Random Forest, Logit Boost, Decorate and Bagging. The results show that Rotation Forest has the highest accuracy. However, when accuracy and execution time are considered together, Random Forest and Random Committees can be the best choices.
Jin Zhou [17] proposed a new ensemble method for cancer data classification. The gene expression data is preprocessed for normalization and then Kernel Independent Component Analysis (KICA) is applied to extract features. Then an intelligent approach is brought forward, which uses Support Vector Machine (SVM) as the base classifier and applied with Binary Particle Swarm Optimization (BPSO) for constructing ensemble classifiers. The leukemia and colon datasets are used for conducting all the experiments. Results show that the proposed method produces a good recognition rate comparing with some other advanced artificial techniques.
Nigar Sen Koktas [18] discussed ensemble methods for gait classification as a part of preliminary studies of designing a semi-automated diagnosis system. For this purpose gait data is collected from 110 sick subjects (having knee Osteoarthritis (OA)) and 91 age-matched normal subjects. A set of Multilayer Perceptions (MLPs) is trained by using joint angle and time-distance parameters of gait as features. The result suggests that ensemble of MLPs could be applied in the automated diagnosis of gait disorders in a clinical context.
Yun Zhai [19] proposed an ensemble classifier model SCECM for imbalanced datasets in a heterogeneous classifier fusion environment, which is based on a differentiated re-sampling technology DSRA and an improved Adaboost algorithmComparative experimental results show that the proposed approach improves performance for the minority class while preserving the ability to recognize examples from the majority classes.
Hualong Yu [20] proposed a novel ensemble classification method named as simple rule-based ensemble classifiers (SREC) and used it for cancer micro array data classification. Experimental results indicate the proposed method is effective and feasible because it has produced less classification errors than many other classifiers. Meanwhile, it has some other advantages such as low time-complexity and storage space etc.
Sung-Bae Cho [21] presented a method to search optimal ensemble of diverse feature-classifier pairs using speciated FA. This paper proposes sophisticated ensemble of such features and classifiers to obtain high classification performance. Speciated genetic algorithm has been exploited to get the diverse ensembles of features and classifiers in a reasonable time. Experimental results with two well-known datasets indicate that the proposed method finds many good ensembles that are superior to other individual classifiers.
III.
CLASSIFICATION ALGORITHMS
The classification techniques are categorized into Eager learners, Lazy learners (learning from neighbors) and other classification techniques. Eager learners will take a set of training tuples, and construct a classification model (learned model) and eager to classify previously unseen tuples. The classification methods belongs to eager learners are decision tree induction, Bayesian classification, rule-based classification, classification by back propagation, support vector machines, and classification based on association rule mining. The Eager learners are tree based classifiers, statistical based classifiers, Rule based classifiers and neural network based classifiers and K-nearest-neighbor classifier is a Lazy learner.
A. Tree Based Algorithms
Decision tree induction is the learning of decision trees from class-labeled training tuples. A decision tree is a flowchart-like tree structure, where each internal node (non leaf node) denotes a test on an attribute, each branch represents an outcome of the test, and each leaf node (or terminal node) holds a class label. The topmost node in a tree is the root node.
Check for base cases For each attribute a
Find the feature that best divides the training data such as information gain from splitting on a Let a best be the attribute with the highest normalized information gain
Create a decision node node that splits on a_best
Recurse on the sub-lists obtained by splitting on a_best and add those nodes as children of node
Figure 2. Algorithm for building a decision tree
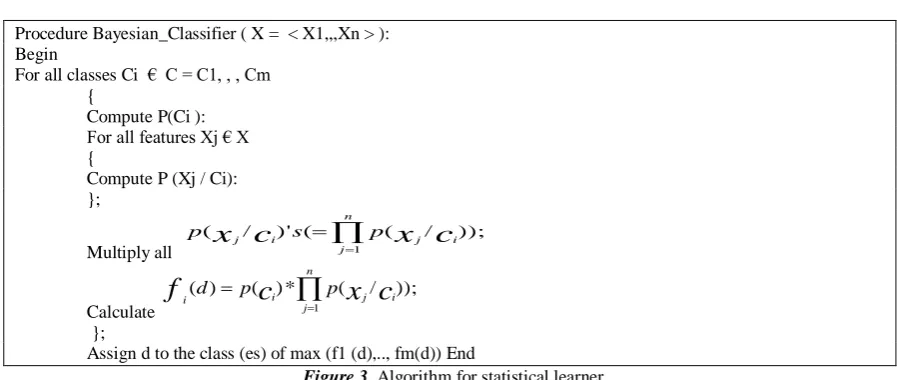
B. Statistical based algorithms
Procedure Bayesian_Classifier ( X = < X1,,,Xn > ): Begin
For all classes Ci € C = C1, , , Cm {
Compute P(Ci ): For all features Xj € X {
Compute P (Xj / Ci): };
Multiply all
)); / ( (
)' / (
1
n
j j i
i
j
c
x
c
x
s pp
Calculate
)); / ( * ) ( ) (
1
n
j
i j i
i
c
x
c
f
d p p};
Assign d to the class (es) of max (f1 (d),.., fm(d)) End
Figure 3. Algorithm for statistical learner
C. Neural network based algorithms
A multi-layer neural network consists of large number of units (neurons) joined together in a pattern of connections. Units in a net are usually segregated into three classes: input units, which receive information to be processed; output units, where the results of the processing are found; and units in between known as hidden units. Feed-forward ANNs allow signals to travel one way only, from input to output.
1. Present a training sample to the neural network.
2. Compare the network's output to the desired output from that sample. Calculate the error in each output neuron.
3. For each neuron, calculate what the output should have been, and a scaling factor, how much lower or higher the output must be adjusted to match the desired output. This is the local error.
4. Adjust the weights of each neuron to lower the local error.
5. Assign "blame" for the local error to neurons at the previous level, giving greater responsibility to neurons connected by stronger weights.
6. Repeat the steps above on the neurons at the previous level, using each one's "blame" as its error. With more details, the general rule for updating weights is:
;
i j jio
w
where:
• η is a positive number (called learning rate), which determines the step size in the gradient descent search. A large value enables back propagation to move faster to the target weight configuration but it also increases the chance of its never reaching this target.
• Oi is the output computed by neuron i
);
)(
1
(
i i i ii
O
O
T
O
for the output neurons, where Ti the wanted output for the neuron i and
k k kj j
j
j
o
(
1
o
)
w
;
for the internal (hidden) neurons
Figure 4. Algorithm for neural network
D. Lazy learners
Lazy-learning algorithms require less computation time during the training phase than eager-learning algorithms (such as decision trees, neural and Bayes nets) but more computation time during the classification process. One of the most straightforward lazy learning algorithms is the nearest neighbour algorithm.
Procedure Lazy Learner (Testing Instances)
for each testing instance
{
find the k most nearest instances of the training set according to a distance metric Resulting Class= most frequent class label of the k nearest instances
}
E. Rule based algorithms
Decision trees can be translated into a set of rules by creating a separate rule for each path from the root to a leaf in the tree (Quinlan, 1993). However, rules can also be directly induced from training data using a variety of rule-based algorithms. Furnkranz (1999) provided an excellent overview of existing work in rule-rule-based methods.
On presentation of training examples Training examples:
Initialize rule set to a default (usually empty, or a rule assigning all objects to the most common class). Initialize examples to either all available examples or all examples not correctly handled by rule set. Repeat
(a) Find best, the best rule with respect to examples.
(b) If such a rule can be found
i. Add best to rule set.
ii. Set examples to all examples not handled correctly by rule set.
until no rule best can be found (for instance, because no examples remain).
Figure 6. Algorithm for rule learners
F. Support Vector Machines
Support Vector Machines (SVMs) are the newest supervised machine learning technique (Vapnik, 1995). SVMs revolve around the notion of a “margin “either side of a hyper plane that separates two data classes. Maximizing the margin and thereby creating the largest possible distance between the separating hyper plane and the instances on either side of it has been proven to reduce an upper bound on the expected generalization error.
Introduce positive Lagrange multipliers, one for each of the inequality constraints This gives Lagrangian:
i N i i
i i N i
p
y
x
w
b
L
1
12
)
.
(
||
w
|
|
2
1
Minimize LP with respect to w, b.
This is a convex quadratic programming problem.
In the solution, those points for which α i >0 are called “support vectors”
Figure 7. Algorithm for SVMs
IV.
RESULTS AND DISCUSSION
In this study we used liver data sets from UCI and INDIA. UCI liver data set has 345 samples with 6 features and INDIA liver data set has 583 samples with 10 features. For the purpose of experimentation, Weka© Data Mining open source machine learning software [10]. It is used on i7 processor with 4 GB RAM. With Each combination of classification algorithm and feature selection method, we have observed Accuracy which can be defined as follows: Accuracy: The accuracy of a classifier is the percentage of the test set tuples that are correctly classified by the classifi er.
TN + FN + FP + TP
TN + TP
Accuracy
Where TP means True Positives, TN means True Negatives, FP means False Positives and FN means False Negatives
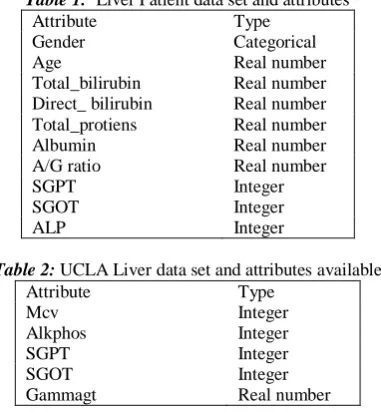
Table 1: Liver Patient data set and attributes
Attribute Type
Gender Categorical
Age Real number
Total_bilirubin Real number Direct_ bilirubin Real number Total_protiens Real number
Albumin Real number
A/G ratio Real number
SGPT Integer
SGOT Integer
ALP Integer
Table 2: UCLA Liver data set and attributes available
Attribute Type
Mcv Integer
Alkphos Integer
SGPT Integer
SGOT Integer
The accuracy of all combinations of ten classification algorithms which were selected from various categories of classification algorithms and feature selection techniques were analyzed for UCI liver data set and INDIA liver data set.
Table 3: UCI Liver Data Set
Feature Selection PCA CFS Random
Projection Random Subset C la ss if ic at ion A lgo ri th m s
J48 73.3333 63.7681 67.2464 68.1159
Simple Cart 73.3333 66.087 68.9855 69.5652 Naive Bayes 54.7826 64.058 56.8116 56.8116 Bayes Net 71.3043 57.971 56.2319 56.5217 MLP 71.3043 63.7681 68.4058 74.7826
SMO 58.5507 57.971 57.971 57.971
IBK 63.1884 64.058 66.9565 61.1594
KStar 67.5362 68.4058 66.6667 67.5362 PART 72.4638 63.4783 68.1159 69.2754
Zero 57.971 57.971 57.971 57.971
0 10 20 30 40 50 60 70 80 J48 Simple Cart Naive Baye s
Bayes N et
MLP SMO IBK KStar
PART Zero
Cla ssifica tion Algorithms
Ac cura cy PCA CFS Random Projection Random Subjet
Figure 8. Accuracy for different combination of classifier and feature selection for UCI liver data set
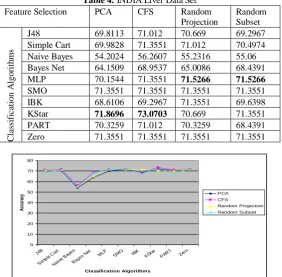
Table 4: INDIA Liver Data Set
Feature Selection PCA CFS Random
Projection Random Subset C la ss if ic at ion A lgo ri th m s
J48 69.8113 71.012 70.669 69.2967
Simple Cart 69.9828 71.3551 71.012 70.4974 Naive Bayes 54.2024 56.2607 55.2316 55.06 Bayes Net 64.1509 68.9537 65.0086 68.4391 MLP 70.1544 71.3551 71.5266 71.5266
SMO 71.3551 71.3551 71.3551 71.3551
IBK 68.6106 69.2967 71.3551 69.6398
KStar 71.8696 73.0703 70.669 71.3551
PART 70.3259 71.012 70.3259 68.4391
Zero 71.3551 71.3551 71.3551 71.3551
0 10 20 30 40 50 60 70 80 J48 Simp le Ca
rt
Naive Bay
es
Baye
s Net MLP SMO IBK KSta r
PART Zero
Classification Algorithms
A
cc
ura
cy PCACFS
Random Projection Random Subset
Training Phase
Given
X: the objects in the training data set (an N X n matrix) Y: the labels of the training set (an N X 1 matrix) L: the number of classifiers in the ensemble K: the number of subsets
{
1,....,
2}: the set of class lablesFor i=1...L
Prepare the rotation matrix Ria
Split F(the feature set) into k subsets: Fij (for j=1...k)
For j=1...k
Let Xij be the data set X for the features in Fij
Eliminate from Xij a random subset of classes
Select a bootstrap sample from Xij of size 75% of the number of objects in Xij. Denote the new set by X’ij
Apply Random subset on X’ij to obtain the coefficients in matrix Cij
Arrange the Cij, for j=1...k in a rotation matrix Riaas in equation (1)
Construct Ri a
by rearranging the columns of Ri so as to match the order of features in F
Build classifier Di using (X Ria, Y) as the training set
Classification Phase
For a given X, let di,j (x Ria) be the probability assigned by the classifier Di to the hypothesis that x comes from class
j. Calculate the confidence for each class
j, by the average combination method:.
,...,
1
),
(
1
)
(
,
1
d
xR
j
c
L
x
aij i L i
j
Assign x to the class with the largest confidence.
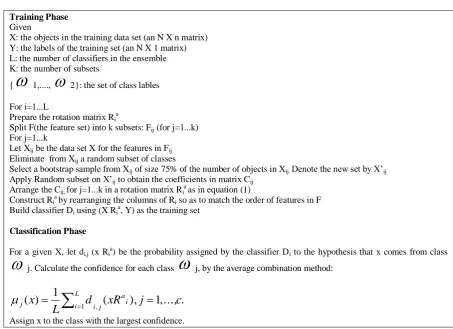
Figure 10. Modified rotation forest algorithm with random subset feature selection and multi layer perception
classification algorithm for UCI liver data set
Training Phase
Given
X: the objects in the training data set (an N X n matrix) Y: the labels of the training set (an N X 1 matrix) L: the number of classifiers in the ensemble K: the number of subsets
{
1,....,
2}: the set of class lables For i=1...LPrepare the rotation matrix Ria
Split F(the feature set) into k subsets: Fij (for j=1...k)
For j=1...k
Let Xij be the data set X for the features in Fij
Eliminate from Xij a random subset of classes
Select a bootstrap sample from Xij of size 75% of the number of objects in Xij. Denote the new set by X’ij
Apply CFS on X’ij to obtain the coefficients in matrix Cij
Arrange the Cij, for j=1...k in a rotation matrix Riaas in equation (1)
Construct Riaby rearranging the columns of Ri so as to match the order of features in F
Build classifier Di using (X Ria, Y) as the training set
Classification Phase
For a given X, let di,j (x Ria) be the probability assigned by the classifier Di to the hypothesis that x comes from class
j. Calculate the confidence for each class
j, by the average combination method:.
,...,
1
),
(
1
)
(
,
1
d
xR
j
c
L
x
aij i L i
j
Assign x to the class with the largest confidence.
Figure 11. Modified rotation forest algorithm with CFS feature selection and nearest neighbor classification algorithm
The results shows that multi layer perception classification algorithm with random subset gives highest accuracy that is 74.7826 for the UCI liver data set and nearest neighbor with CFS gives highest accuracy that is 73.0703 for the INDIA liver data set.
V.
CONCLUSIONS
In this study, ten popular Classification Algorithms were considered with all the combinations of four feature selection methods for evaluating their classification performance in terms of accuracy in classifying liver patient data sets. Modified rotation forest algorithm was proposed with multi layer perception classification algorithm and random subset feature selection method for UCI liver data set. Modified rotation forest algorithm was proposed with nearest neighbor classification algorithm and correlation based feature selection method for INDIA liver data set.
VI.
ACKNOWLEDGEMENTS
We take this opportunity with much pleasure to thank Dr. Bevera Laxmana Rao for his help during the collection of data and Prof. N. B. Venkateswarlu for his helpful comments made during the analysis of this paper.
REFERENCES
[1]. Kun-Hong Liu and De-Shuang Huang: “Cancer classification using Rotation forest”. In Proceedings of the Computers in biology and medicine, 38, pages 601-610, 2008.
[2]. Juan J. Rodrı´Guez, Member, Ludmila I. Kuncheva and Carlos J. Alonso:” Rotation Forest: A New Classifier Ensemble Method”. In Proceedings of the IEEE Transactions on Pattern Analysis and Machine Intelligence, Vol. 28, No. 10, pages 1619-1630, 2006.
[3]. Akin Ozcift and Arif Gulten:” Classifier Ensemble Construction With Rotation Forest To Improve Medical Diagnosis Performance Of Machine Learning Algorithms”. In Proceedings of the Computer Methods and Programs in Biomedicine, pages 443-451, 2011.
[4] BUPA Liver Disorders Dataset. UCI repository of machine learning databases available from ftp://ftp.ics.uci.edu/pub /machine-learningdatabases/ liverdisorders/bupa.data, last accessed: 07 October 2010.
[5]. Bendi Venkata Ramana, Prof. M.Surendra Prasad Babu and Prof. N. B. Venkateswarlu:” A Critical Study of Selected Classification Algorithms for Liver Disease Diagnosis”. In Proceedings of the International Journal of Database Management Systems (IJDMS), Vol.3, No.2, pages 101- 114, May 2011.
[6]. Schiff's Diseases of the Liver, 10th Edition Copyright ©2007 Lippincott Williams & Wilkins by Schiff, Eugene R.; Sorrell, Michael F.; Maddrey, Willis C.
[7]. Bendi Venkata Ramana, Prof. M.Surendra Prasad Babu and Prof. N. B. Venkateswarlu: “A Critical Evaluation of Bayesian Classifier For Liver Diagnosis Using Bagging and Boosting Methods”, International Journal of Engineering Science and Technology (IJEST), Vol.3, No.4, pages 3422-3426, April 2011.
[8]. Bendi Venkata Ramana, Prof. M. S. Prasad Babu and Prof. N. B. Venkateswarlu, “A Critical Comparative Study of Liver Patients From USA and INDIA: An Exploratory Analysis”, International Journal of Computer Science Issues, Vol.9, issue 3, May 2012 (Accepted for Publication).
[9]. Bendi Venkata Ramana, Prof. M. S. Prasad Babu and B. R. Sarath kumar, “New Automatic Diagnosis of Liver Status Using Bayesian Classification”, IEEE International Conference on Intelligent Network and Computing (ICINC 2010), pages V2-385-V2-388, Kuala Lumpur, Malaysia, 26-29 Nov 2010.
[10] Weka-3-4-10jre : data mining with open source machine learning software © 2002-2005 David Scuse and University of Waikato.
[11]. Wei Wanga, Yaoyao Zhua, Xiaolei Huanga, Daniel Loprestia,Zhiyun Xueb, Rodney Longb, Sameer Antanib and George Thomab:” A Classifier Ensemble Based On Performance Level Estimation”. In Proceedings of the IEEE International Symposium on Medical Imaging(IEEE-ISBI'09), pages 342-345, 2009.
[12]. Bing Chen and Hua-Xiang Zhang:” An Approach of Multiple Classifiers Ensemble Based on Feature Selection ”. In Proceedings of the 5th IEEE International Conference on Fuzzy Systems and Knowledge Discovery, pages 390-394, 2008. [13]. Manju Bhardwaj, Trasha Gupta Tanu Grover Vasudha Bhatnagar:” An Efficient Classifier Ensemble Using SVM”. In
Proceedings of the IEEE International Conference on Methods and Models in Computer Science, pages 240-246, 2009. [14]. Lishuang LI, Jing Sun and Degen Huang:” Boosting Performance Of Gene Mention Tagging System By Classifiers
Ensemble ”. In Proceedings of the IEEE International Conference on Natural Language Processing and Knowledge Engineering (NLP-KE), pages 1-4, 2010.
[15]. M. F. Amasyali:” Comparison of Single And Ensemble Classifiers In Terms of Accuracy and Execution Time”. In Proceedings of the International Symposium on Innovations in Intelligent Systems and Applications (INISTA), pages 470-474, 2011.
[16]. Aleksandar Lazarevic and Zoran Obradovic:” Effective Pruning of Neural Network Classifier Ensembles”. In Proceedings of the IEEE International conference on Neural Networks, pages 796-801, 2001.
[17]. Jin Zhou, Yongzheng Lin and V:” Ensemble Classifiers Based on Kernel ICA For Cancer Data Classification”. In Proceedings of the IEEE International conference on Biomedical Engineering and Informatics, 1-5, 2009.
[18]. Nigar Sen Koktas, Nese Yalabik and Günes Yavuzer:” Ensemble Classifiers For Medical Diagnosis of Knee Osteoarthritis Using Gait Data”. In Proceedings of the IEEE International conference on Machine Learning and Applications, pages 225-230, 2006.
[19]. Yun Zhai, Bingru Yang, Nan Ma and Da Ruan:” New Construction of Ensemble Classifiers for Imbalanced Datasets”. In Proceedings of the IEEE International conference on Intelligent Systems and Knowledge Engineering, pages 228-233, 2010. [20]. Hualong Yu and Sen Xu:” Simple Rule-Based Ensemble Classifiers for Cancer DNA Microarray Data Classification”. In
Proceedings of the IEEE International conference on Computer Science and Service System,pages 2555-2558, 2011. [21]. Sung-Bae Cho and Chanho Park:” Speciated GA for Optimal Ensemble Classifiers In DNA Microarray Classification”. In