Applying Principal Component Analysis, Genetic
Algorithm and Support Vector Machine for Risk
Forecasting of General Contracting
Huawang Shi
School of Civil Engineering, Hebei University of Engineering, Handan, P.R.China e-mail: [email protected]
Abstract—In order to evaluate and forecast the general contracting risk, a multi-resolution approach for the price determination of real estate was present in this paper. Real samples have been classified using the novel multi-classifier, namely, support vector machine among which genetic algorithm (GA) is used to determine free parameters of support vector machine. Effects of different sampling approach, kernel functions, and parameter settings used for SVM classification are thoroughly evaluated and discussed. The experimental results indicate that the SVMG method can achieve greater accuracy than grey model, artificial neural network under the circumstance of small training data. It was also found that the predictive ability of the SVM outperformed those of some traditional pattern recognition methods for the data set used here.
Index Terms–- support vector machines; principal component analysis; genetic algorithm; risk forecasting; general contracting
I. INTRODUCTION
At present, in the construction industry, it is a tendency to put into practice the general contracting in engineering project. China also enthusiastically develops general contracting. Construction projects are one-of endeavors with many unique features such as long period, complicated processes, abominable environment, financial intensity and dynamic organization structures [1,2] and such organizational and technological complexity generates enormous risks[3]. The general contracting in engineering project is subjected to the long period, numerous participants and involving government, economic, society, community, culture, technology, environment and other factors. And along with the world economy's continuous development and the project scope's increase extension, the loss caused of the risk occurring will become more great, and the effect to relevant parties will become more distinct too.
How to enhance the risk management is an important question for discussion. The contractor takes more risks under the mode of the engineering general contract. The paper starts from the relative concepts of engineering risk and the theory of the risk management. With the need for improved performance in the construction industry and increasing contractual obligations, the requirement of an effective risk management approach has never been more necessary. Risk assessment is a complex subject shrouded in vagueness and uncertainty. There are some risk
assessment methods now. These risk assessment methods are all based on fuzzy set theory.
According to characteristics and risks of the general engineering, the paper brings forward the risk that the company should be pay attention to, allowing for the theory of total risk management and system and the characteristic of the mode about engineering general contract. The application model of risk management frame system is presented by analyzing the source and characteristic of the engineering risk, and the theory of the risk management. The model based on fuzzy mathematic and analytic hierarchy process(AHP) is used to evaluate risks and some advice is given. There are many factors affecting the accident risk of construction, but some of the factors are related and redundant. PCA is a powerful tool for analyzing data. The goal of PCA is to reduce the dimensionality of the data while retaining as much as possible of the variation present in the original data set. In this paper, we use principal component analysis (PCA) to reduce some related or redundant general contract factors. The paper presents advice for the general engineering contract risk management, provides reference to participation in engineering contract risk management and gives the suggestion of cultivating the ability of competition for the civil engineering general company. Those can be great helpful to develop the market for engineering general company, at the same time also can present theory and practice guidance for dealing with the risk of the project general contractors.
and successfully to a larger range of difficult-to-solve optimization problems.
Developed by Vapnik, SVM is the method that is receiving increasing attention with remarkable results recently. The main difference between ANN and SVM is the principle of risk minimization. ANN implements empirical risk minimization to minimize the error on the training data. However, support vector machine (SVM) implements the principle of structural risk minimization in place of experiential risk minimization, which makes it have excellent generalization ability in the situation of small sample. In addition, SVM can change a non-linear learning problem into a linear learning problem in order to reduce the algorithm complexity by using the kernel function idea present, SVM has been applied successfully to solve non-linear regression estimation problems in financial time series forecasting, bankruptcy prediction, reliability prediction, etc. In this paper, the proposed SVMG model is applied to research the forecasting problem of the ratios of key-gas in power transformer oil, among which GA is used to optimize the parameters of support vector machine, because the election of the parameters plays an important role in the performance of SVM.
This paper is organized as follows: Section 2 introduces the methodology including Principal component analysis (PCA), Genetic Algorithm and regression arithmetic of support vector machine SVM model. The foundations of support vector machines are introduced. The proposed model is presented Section 3 testifies the performance of the proposed model with the real data sets from several companies in China. Finally, the conclusion is provided in Section 4.
II. METHODOLOGY
A. Introduction to PCA
Principal component analysis (PCA) was invented in 1901 by Karl Pearson[2]. Now it is mostly used as a tool in exploratory data analysis and for making predictive models. PCA involves the calculation of the eigenvalue decomposition of a data covariance matrix or singular value decomposition of a data matrix, usually after mean centering the data for each attribute. The results of a PCA are usually discussed in terms of component scores and loadings (Shaw, 2003). PCA[3-7] can be used for dimensionality reduction in a data set by retaining those characteristics of the data set that contribute most to its variance, by keeping lower-order principal components and ignoring higher-order ones. Such low-order components often contain the "most important" aspects of the data. However, depending on the application this may not always be the case.
Problems arise when performing recognition in a high-dimensional space (e.g., curse of high-dimensionality). Significant improvements can be achieved by first mapping the data into a lower-dimensionality space. The goal of PCA is to reduce the dimensionality of the data while retaining as much as possible of the variation present in the original data set.
Supposing n samples, each sample has m target factors,
xj (j = 1,2, ..., m), derived from observation values xij
(i=1,2,...,n), constitute the raw data matrix X=(xij )n×m,
shown as bellow:
⎥
⎥
⎥
⎥
⎦
⎤
⎢
⎢
⎢
⎢
⎣
⎡
=
nm n
n
m m
x
x
x
x
x
x
x
x
x
X
"
#
"
#
#
"
"
2 1
2 22
21
1 12
11
(1)
The target factor is often relevant, thus increasing the internal complexity of the samples. Principal component analysis is to have a correlation between a number of factors into a set of mutually independent factor of a few General methods. These will be the original general factor target factor in the overlapping information removed, to the original contains only significant difference between the target and reflect the original main target factor information purposes. That is, without changing the original data provided by the basic information on more focused and typically show the characteristics of the study. Principal component - the specific algorithm for cluster analysis are as follows.
(1) Original data will be standardized (Z-Score Standardization)
Class and quantity in order to eliminate the impact of different dimension, first of all original data on the standardization of treatment (standardized value of the post-treatment xij*
j j ij ij
S
x
x
x
∗=
−
(2)
Where:
x
j andS
j , respectively, are the mean and standard deviation of the jth target sample, and∑
=
=
ni ij
j
x
n
x
1
1
(3)
(
)
1/21
2
1
1
⎥
⎦
⎤
⎢
⎣
⎡
−
−
=
∑
=
n
i
j ij
j
x
x
n
S
(4)(2) Calculation of correlation between the matrix
Based on the standardized data matrix
X
*=
(
x
ij∗)
, calculated the correlation coefficient matrix R = (rij)m×m.Where, rij are the correlation coefficient between the xi
and xjtarget factor .
(
)(
)
(
) (
)
∑
∑
∑
=
= = ∗
∗
−
−
−
−
=
−
=
nk
j kj n
k
i ki n
k
j kj i ki kj
ki ij
x
x
x
x
x
x
x
x
x
x
n
r
1 2
1
2 1
1
1
(5) Where, i, j=1,2,…,m.
(3) Solving eigenvalue of the correlation matrix and eigenvectors
corresponding Tikhonov unit eigenvector tj=(t1j,t2j,… ,tmj)
∑
= ∗•
=
m k k kjj
t
x
Y
1
(6)
Where: xk* is the standardized sample matrix.
(3)To determine the number of principal components Selecting r principal components in the m principal components that have been identified to finally realize the evaluation analysis. In general, the contribution rate of
variance
∑
=
=
m k k j je
1/
λ
λ
could explain that principalcomponent Yj reflects the amount of information size. R is determined by the principle that accumulated
contribution value
∑
=
=
r k ke
r
G
1)
(
is large enough(typically more than 85%). K is kth measured values of the ith and jth factor , k=1,2,…,r.
B. Introduction to Genetic Algorithm
Gas a search technique that imitates the natural selection and biological evolutionary process were first established on a sound theoretical basis by Holland [6-8]. Genetic algorithm has a wide range of, particularly in combinatorial optimization problems and they were proved to be able to provide near optimal solutions in reasonable time[9], it can deal with arbitrary forms of the objective function and constraints, whether it is linear or non-linear, continuous or discrete, in theory, have access to the optimal solution. However, in practical applications of genetic algorithm to demonstrate the more serious question is "premature convergence" problem, less capable local optimization, the late slow convergence and can not guarantee convergence to global optimal solution and so on. In recent years, many scholars try to improve genetic algorithms, such as improving the encoding scheme, fitness function, genetic operator design. However, these improvements are all make in internal of the genetic algorithm and it has been proved that it is unable to overcome these shortcoming effectively.
The most common type of genetic algorithm works like this: a population is created with a group of individuals created randomly. The individuals in the population are then evaluated. The evaluation function is provided by the programmer and gives the individuals a score based on how well they perform at the given task. Two individuals are then selected based on their fitness, the higher the fitness, the higher the chance of being selected. These individuals then "reproduce" to create one or more offspring, after which the offspring are mutated randomly. This continues until a suitable solution has been found or a certain number of generations have passed, depending on the needs of the programmer[7].
C. Support Vector Machine
1) Linear Support Vector Machine: The basic concept of SVM regression is to map nonlinearly the original data x into a high-dimensional feature space, and to solve a linear regression problem in this feature space[5-7].
Figure 1. The basic concept of SVM regression
Sample set is established:
{
(
x
i,
y
i),
i
=
1
,
2
,
"
l
}
, Regression function with the following linear equation to represent
f
(
x
)
=
ω
⋅
φ
(
x
)
+
b
(1) Assumes that all the training data without errorε
in the linear function fitting,That is 2
2
1
min
ω
l
i
b
x
y
y
b
x
st
i i i i"
,
2
,
1
,
=
⎩
⎨
⎧
≤
−
⋅
−
≤
−
+
⋅
ε
ω
ε
ω
(2) Taking into account the permissible error of the case,the introduction of relaxation factor *
,
i iξ
ξ
, then the above formula will change to become
∑
=+
+
l i i iC
1 * 2)
(
||
||
2
1
.
min
ω
ξ
ξ
(3)
⎪
⎩
⎪
⎨
⎧
=
≥
+
≤
+
⋅
+
≤
⋅
+
l
i
y
b
x
x
y
b
t
s
i i i i i i i i,
,
2
,
1
,
0
,
.
.
* *"
ξ
ξ
ξ
ε
ω
ξ
ε
ω
—
—
—
Where the constant C>0,expressed the degree of punishment of the sample beyond the error of
ε
t, Upperand lower limits for the slack variable were *
,
i iξ
ξ
. Therefore, Lagrange function is constructed:
(
)
(
)
(
)
(
)
* * 1 * 1 * * 11
, ,
2
l i i li i i i
i l
i i i
i
L
b a
C
a
y
x
b
a
y
x
b
ω
ω ω
ξ
ξ
ε ξ
ω
ε ξ
ω
= = + ==
⋅
+
+
⎡
⎤
−
⎣
+
+ −
⋅ +
⎦
⎡
⎤
−
⎣
+
−
⋅ +
⎦
∑
∑
∑
(4)Its dual problem may be H1
H2 H
*
* *
, 1 1
* *
1 1
max .[
(
)(
)(
)
(
)
(
)]
l l
i i j j i j
i j
l l
i i i i i
i i
x x
y
α αα α α α
ε α α
α α
= = = =−
−
⋅
−
+
+
−
∑∑
∑
∑
(5)
⎪
⎩
⎪
⎨
⎧
∈
=
−
∑
=]
,
0
[
,
0
)
(
.
.
* 1 *l
C
t
s
i i l i i iα
α
α
α
Regression function may be:
b
x
x
a
a
b
x
x
f
l i ji
i
i
−
+
=
+
⋅
=
∑
=)
,
(
)
(
)
(
1 *ω
(6)2) Nonlinear support vector machine regression: The problem discussed above is linear, the nonlinear problem,
the input sample x by
ψ
:
x
→
h
mapping to high dimensional feature space H (may be infinite-dimensional). When the feature space, construct the optimal hyperplane, the fact simply performs internal product operation, and this inner product operation is in their original space in the function Lai implementation of, not Biyaozhidao the form. As long as the kernelfunction
K
(
x
i,
x
j)
satisfies the condition, it corresponds to a transformation that is))
(
)
(
(
)
,
(
x
ix
jx
ix
jK
=
Ψ
⋅
Ψ
. Known by the linear support vector regression, quadratic programming Lagrangian objective function:
(
)
(
)
(
)
(
)
* * 1 * 1 * * 11
, ,
2
( )
( )
l i i li i i i
i l
i i i
i
L
b a
C
a
y
x
b
a
y
x
b
ω
ω ω
ξ
ξ
ε ξ
ω
ε ξ
ω
= = ==
⋅
+
+
⎡
⎤
−
⎣
+
+ −
⋅ Ψ
+
⎦
⎡
⎤
−
⎣
+
− +
⋅ Ψ
+
⎦
∑
∑
∑
(7)(
)
j i j( )
i jl
j i l
i
i
y
y
a
a
K
x
x
a
a
b
L
, 1 12
1
,
,
∑
∑
= =−
=
β
ξ
ω
,
,
Dual form: * *, 1 1
* *
1 1
max[
(
) (
)
(
)
(
)]
l l
i j i j
i j
l l
i i i i i
i i
K x x
y
α αα α
ε α α
α α
= = = =−
⋅
−
+
+
−
∑∑
∑
∑
(8)
⎪
⎩
⎪
⎨
⎧
∈
=
−
∑
=]
,
0
[
,
0
)
(
.
.
* 1 *l
C
t
s
i i l i i iα
α
α
α
Regression function can be:
b
x
x
K
a
a
b
x
x
f
l i ji
i
i
−
+
=
+
⋅
=
∑
=)
,
(
)
(
)
(
1 *ω
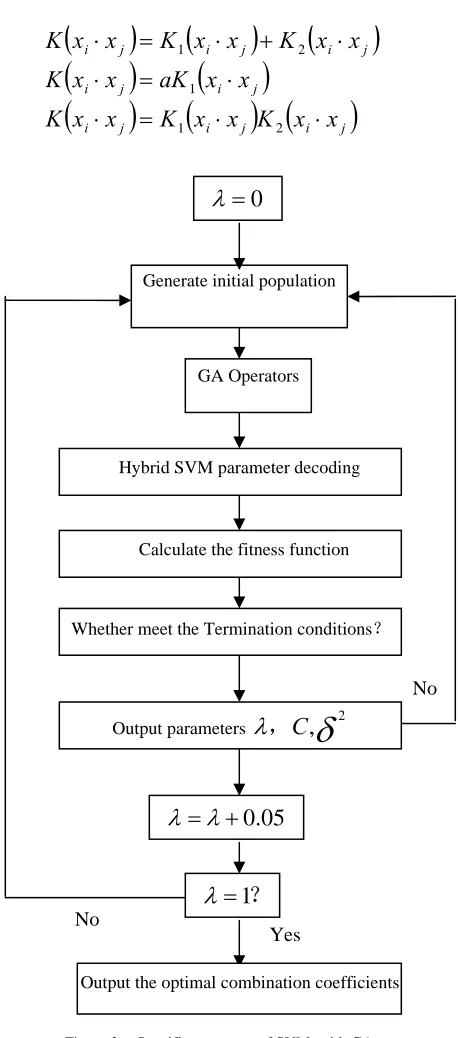
(9)3)Kernel Functions: In order to get better performances for the support vector machine, an improved method is to combine a number of kernel functions to form a mixed kernel. Mixed kernel function of the form as:
Figure 2. Specific processes of SVM with GA
This paper adopted experimental method to select the combination of the kernel function. In other words, each individual kernel function support vector machine was
(
)
(
)
(
)
(
)
(
)
(
i j)
(
i j) (
i j)
j i j i j i j i j i
x
x
K
x
x
K
x
x
K
x
x
aK
x
x
K
x
x
K
x
x
K
x
x
K
⋅
⋅
=
⋅
⋅
=
⋅
⋅
+
⋅
=
⋅
2 1 1 2 10
=
λ
Generate initial population
GA Operators
Calculate the fitness function Hybrid SVM parameter decoding
Whether meet the Termination conditions?
Output parameters
λ
,
C
,
δ
205
.
0
+
=
λ
λ
?
1
=
λ
Output the optimal combination coefficients
No
Yes
established to determine the optimal parameters. Then support vector machine based on several samples of the prediction accuracy to select the best kernel function of two properties, using the combination of the selected two core functions, convex the two combinations to be mixed functions:
(
x
ix
j)
K
(
x
ix
j)
(
)
K
(
x
ix
j)
K
⋅
=
λ
1⋅
+
1
−
λ
2⋅
(10) Which
λ
is a combination coefficient of adjustment for the two functions mixed, when you select the appropriate parameters, the mixed kernel has both a good learning ability and good generalization ability. When identified two nuclear function and parameters, and then need to determine the kernel function is a combination of two factors, namely, to determine which kernel function in this mixed kernel plays a leading role is our task to be accomplished the following. This paper used genetic algorithm to optimize combination of factors and determine the kernel function according to combination of factors. Specific processes were as shown in Fig.1.III. APPLICATION CASE
A. General Contracting Risk Factors
General contracting risk is described by 17 indicators are including in such as the War and civil strifeI1, NationalizationI2 , Non-payment of debtI3. Exchange rate I4 , Prices risk I5 , Pay delay I6 , Design I7 , ConstructionI8, Project estimatedI9. Sub-contractorsI10, Vendor I11 , Geological and foundation conditions I12
Hydro-climatic conditionsI13. Contract managementI14 , Financial managementI15, Engineering managementI16
and Public relationsI17.
B. General Contracting Risk Analysis Based on PCA
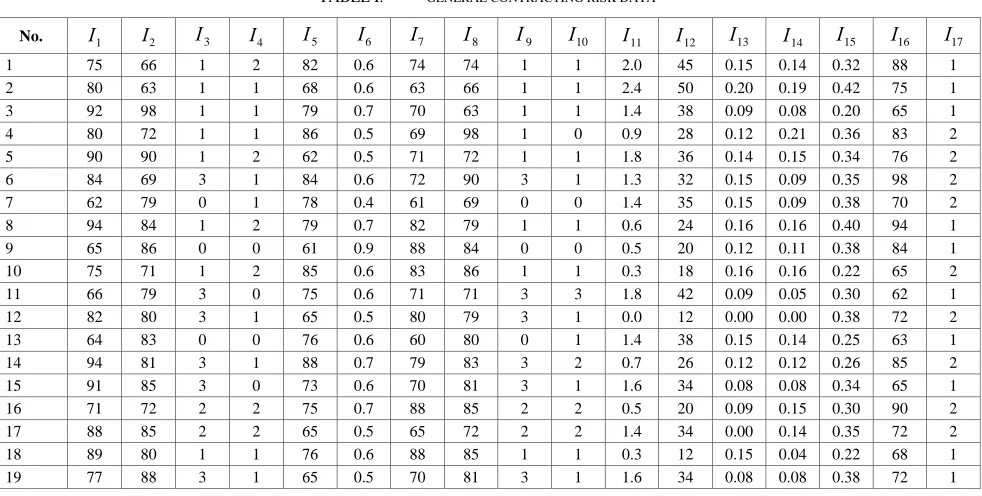
First, the original data in Table1 was processed for the standardization, and by 5, the correlation coefficient matrix was calculated. Then, by the correlation coefficient matrix eigenvalue calculation, as well as all the main components of the contribution rate and the cumulative contribution rate as shown in Table 2. From Table 2, we can see that the first, second and third principal component of the cumulative contribution rate were up to 87.6%, so just find the first, second and the third principal component.
The principal components analysis and fuzzy method were introduced in evaluate the general contracting risk. From Table2, principal components analysis of general contracting risk can be concluded as follow. In the first principal component, War and civil strife I1 , NationalizationI2and Non-payment of debtI3. The first principal component can therefore be considered as Political risk factors. At the second principal components, Exchange rateI4, Prices riskI5, and Pay delay I6, thus, the second principal component can therefore be considered as economic -related risk factors The third principal component of the values of Design I7 , Construction I8 , Project estimated I9 . Sub-contractorsI10and VendorI11were higher, it reflects the technical indicate a high degree risk in the construction. The fouth principal component that including Geological and foundation conditions I12 and Hydro-climatic conditionsI13can therefore be considered as Natural -related factors. The final principal component that including Contract management I14 , Financial managementI15, Engineering managementI16 and Public relationsI17can therefore be considered as management -related risk factors.
TABLE I. GENERAL CONTRACTING RISK DATA
No. I1 I2 I3 I4 I5 I6 I7 I8 I9 I10 I11 I12 I13 I14 I15 I16 I17
1 75 66 1 2 82 0.6 74 74 1 1 2.0 45 0.15 0.14 0.32 88 1
2 80 63 1 1 68 0.6 63 66 1 1 2.4 50 0.20 0.19 0.42 75 1
3 92 98 1 1 79 0.7 70 63 1 1 1.4 38 0.09 0.08 0.20 65 1
4 80 72 1 1 86 0.5 69 98 1 0 0.9 28 0.12 0.21 0.36 83 2
5 90 90 1 2 62 0.5 71 72 1 1 1.8 36 0.14 0.15 0.34 76 2
6 84 69 3 1 84 0.6 72 90 3 1 1.3 32 0.15 0.09 0.35 98 2
7 62 79 0 1 78 0.4 61 69 0 0 1.4 35 0.15 0.09 0.38 70 2
8 94 84 1 2 79 0.7 82 79 1 1 0.6 24 0.16 0.16 0.40 94 1
9 65 86 0 0 61 0.9 88 84 0 0 0.5 20 0.12 0.11 0.38 84 1
10 75 71 1 2 85 0.6 83 86 1 1 0.3 18 0.16 0.16 0.22 65 2
11 66 79 3 0 75 0.6 71 71 3 3 1.8 42 0.09 0.05 0.30 62 1
12 82 80 3 1 65 0.5 80 79 3 1 0.0 12 0.00 0.00 0.38 72 2
13 64 83 0 0 76 0.6 60 80 0 1 1.4 38 0.15 0.14 0.25 63 1
14 94 81 3 1 88 0.7 79 83 3 2 0.7 26 0.12 0.12 0.26 85 2
15 91 85 3 0 73 0.6 70 81 3 1 1.6 34 0.08 0.08 0.34 65 1
16 71 72 2 2 75 0.7 88 85 2 2 0.5 20 0.09 0.15 0.30 90 2
17 88 85 2 2 65 0.5 65 72 2 2 1.4 34 0.00 0.14 0.35 72 2
18 89 80 1 1 76 0.6 88 85 1 1 0.3 12 0.15 0.04 0.22 68 1
TABLE II. PRINCIPAL COMPONENT ANALYSIS
Indicts Y1 Y2 Y3 Y4 Y5
1
I -0.20 -0.19 0.629 -0.450 0.757
2
I -0.28 0.52 0.436 -0.638 0.214
3
I -0.44 0.03 0.455 -0.744 0.046
4
I 0.33 0.76 0.333 -0.593 0.065
5
I 0.23 -0.72 0.713 0.590 0.319
6
I 0.47 0.49 0.788 -0.158 0.184
7
I 0.11 0.12 0.130 0.757 -0.168
8
I 0.79 0.93 0.229 -0.121 0.713
9
I 0.73 0.33 -0.321 -0.273 0.788
10
I 0.89 -0.251 0.409 0.023 0.130
11
I -0.10 -0.016 -0.110 0.189 0.229
12
I 0.78 0.757 0.308 0.096 -0.321
13
I . -0.16 -0.42 -0.216 -0.041 0.409
14
I 0.72 -0.23 0.672 -0.130 -0.110
15
I 0.812 0.308 -0.184 -0.225 0.184
16
I 0.903 -0.216 -0.042 0.125 -0.168
17
I 0.86 0.530 -0.016 -0.016 -0.184
Eigenvalue 7.52 2.97 0.757 1.145 0.742
Contribution
rate(%) 46. 73 22. 64 8.812 6.354 6.235 Cumulative
contribution rate(%)
48.89 52.26 63.56 76.01 83.23
C. General Contracting Risk Forecasting Based on GA- SVM
A total of 500 input-output data pairs were obtained for the training of the SVM for real estate prices. Due to the low dimensionality of the parameters pace and the limited range of variation in the parameters, such number of data reasonably covers the set of different possible operating points. The available data set is randomly partitioned into a training set and a checking set[8].
Figure 3. The relationship between classification accuracy and the parameter combination
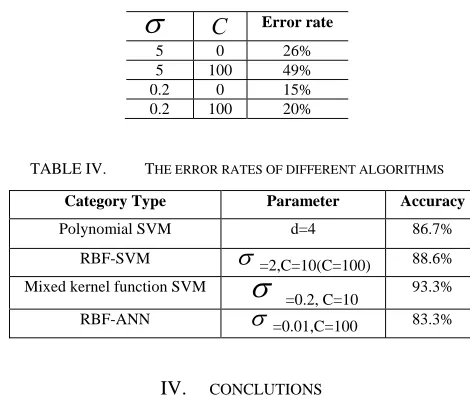
TABLE III. THE ERROR RATE OF RBFKERNEL FUNCTION ON
2-DIMENSIONAL PROBLEMS OF CATEGORY 2 CLASSIFICATION
σ
C
Error rate5 0 26% 5 100 49% 0.2 0 15% 0.2 100 20%
TABLE IV. THE ERROR RATES OF DIFFERENT ALGORITHMS
IV. CONCLUTIONS
In this paper, SVMG is applied to determination real estate price. The real data sets are used to investigate its feasibility in forecasting the risk of general contracting. SVMG implements the principle of structural risk minimization in place of experiential risk minimization, which makes it have excellent generalization ability in the situation of small sample. And it can change a non-linear learning problem into a linear learning problem in order to reduce the algorithm complexity by using the kernel function idea. In addition, GA can be used to select suitable parameters to determination the risk of general contracting, which avoids over-fitting or under-fitting of the SVM model occurring because of the improper determining of these parameters. The experimental results reveal the potential of the proposed approach for forecasting the risk of general contracting.
It is generally acknowledged that the risk of general contracting was highly complicated and was interrelated with a multitude of factors. It will be advantageous if the parties to a dispute have some insights to some degree. Principal component analysis (PCA) was introduced to analyze the risk of general contracting. principal components analysis of general contracting risk can be concluded as follow. In the first principal component, War
and civil strifeI1, NationalizationI2and Non-payment of debtI3. The first principal component can therefore be considered as Political risk factors. At the second
principal components, Exchange rateI4, Prices riskI5, and Pay delay I6, thus, the second principal component can therefore be considered as economic -related risk factors The third principal component of the values of
DesignI7, ConstructionI8, Project estimatedI9 . Sub-contractorsI10and VendorI11were higher, it reflects the technical indicate a high degree risk in the construction. The fouth principal component that including Geological
and foundation conditions I12 and Hydro-climatic conditionsI13can therefore be considered as Natural -related factors. The final principal component that
including Contract management I14 , Financial
Category Type Parameter Accuracy
Polynomial SVM d=4 86.7%
RBF-SVM
σ
=2,C=10(C=100) 88.6%Mixed kernel function SVM
σ
=0.2, C=10 93.3%
managementI15, Engineering managementI16 and Public relationsI17can therefore be considered as management -related risk factors.
This paper introduces an hybrid genetic algorithm (HGA) approach to instance selection in SVM for the risk of general contracting. From the above discussion, the following conclusion can be made:
(1)The factors affecting the housing price were quantified with fuzzy sets and reduced by PCA to the inputs of SVM.
(2) The genetic algorithm was adopted to optimize the weights of SVM. The established SVMG model is capable of accurate determinants for housing price with less time and better convergence.
(3) In Simulation tests, the relative error of Mixed kernel function SVMG models smaller than the Polynomial SVM, the RBF-SVM and of RBF-ANN. Thus, the proposed Mixed kernel function SVMG model is capable of more accurate prediction on risk.
REFERENCES
[1] Hayes, R .W. Rerry, J. G. Thompson, P.A. and willmr. G. Risk management in Engineering Construction Implications for Project Managements: London, Thomas Telford Ltd, 1986:221-229.
[2] Dongping Fang, Mingen Li. Risks in Chinese Construction Market-Contractors' Perspective [J]. Journal of Construction Engineering and Management, 2004(11/12):853-861
[3] Temy Lyons, Martin Skitmore.Froject risk management in the Queensland engineering construction industry a survey[J]. International Journal of Project Management 22(2004)51-61
[4] Wenjuan Liu,Qiang Liu ,FengRuan ,Zhiyong Liang ,Hongyang Qiu. Method for Housing Price Forecasting based on TEI@I Methodology. Systems Engineering-Theory&Practice Volume27,Issue7,July2007.
[5] Keethi S.S,Lin C.J; Asymptotic Behaviors of Support Vector Machines with Gaussian Kernel[J] [M];Neural Computation
[6] Holland J.H., Adaptation in natural and artificial system, Ann Arbor, The University of Michigan Press, 1975.
[7] Hollstien, R. B., Artificial Genetic Adaptation in Computer Control Systems, Ph.D. Thesis, University of Michigan, Ann Arbor, MI., 1971.
[8] Booker, L. B., Improving Search in Genetic Algorithms, pp. 61-73, Genetic Algorithms and Simulated Annealing (L. Davis, editor), Pitman, London, 1987.
[9] Jesus Fraile-Ardanuy, P.J.Zufiria. Design and comparison of adaptive power system stabilizers based on neural fuzzy networks and genetic algorithms. Neuro computing 70 (2007) 2902-2912..
[10] K.M.Saridakis , A.J.DentsorasJ. Integration of fuzzy logic, genetic algorithms and neural networks in collaborative parametric design. Advanced Engineering Informatics 20 (2006) 379-399
[11] Chau, K. W., Ng, F F. & Hung, E.C.T.. Developer's good will assignificant in fluence on apartment unit prices[J]. Appraisal J ournal. 2001b,vol69,pp.26-34.
[12] Wenjuan Liu,Qiang Liu ,FengRuan ,Zhiyong Liang ,Hongyang Qiu. Method for Housing Price Forecasting based on TEI@I Methodology. Systems Engineering-Theory&Practice Volume27,Issue7,July2007.
[13] Keethi S.S,Lin C.J; Asymptotic Behaviors of Support Vector Machines with Gaussian Kernel[J] [M];Neural Computation
[14] Cristinini N. and Taylor J.S.: An introduction to support vector machine and other kernel-based learning methods, Cambridge, Cambridge University Press, 2000.
[15] SmitsG F, Jordan E M.Improved SVM Regressionusing Mixtures of Ker-nels. Proeeedings of the 2002 International Joint ConfereneeonNeuralNet-works.Hawaii:IEEE,2002.2785一2790.
[16] Sheng-wei Fei *, Ming-Jun Wang, Yu-bin Miao, Jun Tu, Cheng-liang Liu. Particle swarm optimization-based support vector machine for forecasting dissolved gases content in power transformer oil. Energy Conversion and Management 50 (2009) 1604–160.
[17] Cristinini N. and Taylor J.S.: An introduction to support vector machine and other kernel-based learning methods, Cambridge, Cambridge University Press, 2000.
[18] SmitsG F, Jordan E M.Improved SVM Regressionusing Mixtures of Ker-nels. Proeeedings of the 2002 International Joint ConfereneeonNeuralNet-works.Hawaii:IEEE,2002.2785一2790.