Volume 1, issue 3 (2012), 43-59
International Journal of Pharmaceutical Research &
Allied Sciences
Development and Optimization of Controlled Drug Release Formulation of
Diclofenac Sodium Based on Osmotic Technology.
Michael Romeo Mutyaba* , Bo Wang , He ying Xue
Department of Pharmaceutics, China Pharmaceutical University Tong Jia Xiang 24 Nanjing 21009, China
*Corresponding author. Email address: [email protected]
Subject: Formulation Science
Abstract:
The aim of this study is to develop and optimize an osmotically controlled drug delivery system of Diclofenac sodium. Osmotically controlled oral drug delivery systems utilize osmotic pressure for controlled delivery of active drugs. Drug delivery from these systems, to a large extent, is independent of the physiological factors of the gastrointestinal tract .Differential scanning calorimeter (DSC) was used to evaluate the drug–excipient compatibility , based on the results of DSC, excipients defined in the formula were found to be compatible with Diclofenac sodium. Formulation variables like type of osmotic agent (Sodium chloride, Mannitol, Lactose) , level of pore former and plasticizer , percent weight gain were found to affect the drug release from the developed formulations. The release performance of Diclofenac sodium from the optimized formulations was studied over a period of 12 h. Drug release was inversely proportional to the membrane weight but directly related to the initial level of pore former in the membrane. On the basis of release results, a three-level three-factorial Box–Behnken experimental design was used to characterize and optimize three formulation parameters, i.e. level of osmotic agent , pore former and plasticizer .The chosen dependent variables (responses) were a cumulative percentage of dissolved diclofenac sodium over a period of 12 h..The release from the developed formulations was independent of pH and agitational intensity, but dependent on the osmotic pressure of the release media. From dissolution models it was observed that drug release from optimized formulation exhibited zero order release kinetics. The formulations were found to be stable after 3 months of accelerated stability studies (40 o C and 75%RH). Prediction of steady-state levels using the superposition method showed the plasma concentrations of Diclofenac sodium to be within the desired range.
Keywords
: controlled drug release; Diclofenac sodium; Osmotic pressure; DissolutionIntroduction:
Oral bioavailability of poorly water-soluble drugs depends on their dissolution rate in the absorption site. In recent years it has been estimated that up to 40% of the new drugs discovered by the pharmaceutical industry are poorly soluble or lipophilic compounds [1]. Many procedures have been investigated to enhance oral bioavailability of drugs. Oral, controlled-release systems for extended release of drugs have provided advantages of safety (improved Cmax/Cmin ratio), improved patient
erosion.[2-4] Osmotic drug delivery technology involves the use of osmotic pressure exerted on a core surrounded by a semi-permeable membrane to pump the drug out at a steady rate. While matrix technology is generally regarded as simpler to manufacture, Drug release from osmotic technology systems is less dependent on pH and other physiological parameters.[5-7] In an elementary osmotic system, the device is in the form of a tablet consisting of a solid core surrounded by a semi-permeable membrane. Aqueous body fluids enter the system continuously through the membrane and dissolve the drug contained within the core. The drug is then released through orifices in the semi-permeable membrane once sufficient pressure is built up to cause the solution containing the drug to be pushed through the orifices. When the drug present in the core is able to produce a sufficiently high osmotic pressure of its own or when additives are present to increase the osmotic pressure (i.e., osmagents), the drug is released at a predetermined rate. Examples published in the literature suggest that single-layer osmotic API delivery of low solubility API's is possible.[8-10] Diclofenac sodium is a potent non-steroidal anti-inflammatory drug (NSAID) with pronounced analgesic and antipyretic properties. It is widely used in the long-term treatment of degenerative joint diseases such as rheumatoid arthritis, osteoarthritis and ankylosing spondylitis. Nevertheless, it produces a relatively high incidence of gastrointestinal side effects due to the physicochemical action on the gastric mucous and the inflammatory action on both small bowel and the colon. Due to these adverse effects and its short biological half life, diclofenac sodium is an ideal candidate for prolonged release preparations.[11-15] Diclofenac sodium has weak acidic properties (pKa about 4) and its solubility depends on the pH of the medium. It is slightly soluble in water, very slightly soluble in phosphate buffer at pH 6.8 and practically insoluble in hydrochloric acid at pH 1.1 [5–7]. Based on the Biopharmaceutics Classification System (BCS), it can be classified as a Class II drug (high permeability, low solubility).[16-18]The aim study was to design and characterize controlled release formulations of Diclofenac sodium based on osmotic technology. A theoretically designed zero-order delivery system was designed to produce plasma levels within the desired range. Drug release from different dosage forms, including osmotic tablets, can be evaluated by means of dissolution testing [19]. Dissolution testing is a very important tool in drug products development and as a quality control procedure in pharmaceutical production. In quality control, dissolution test results can lead to approval or rejection of batches. In product development, it supports formulation selection, enables analysis of
combined effects, such as drug, excipient or process properties, in order to evaluate the effect of these changes on biopharmaceutical characteristics, and is used in comparative studies of formulations.[19-22] Recently, considering the relationship between drug dissolution and bioavailability, several dissolution approaches have been proposed for estimating oral absorption [23] and establishing biowaivers. Sensitive and reproducible dissolution data from predefined conditions are needed in order to compare in vitro dissolution results, and to allow its use for in vitro–in vivo correlations and as surrogates for in vivo bioavailability and bioequivalence testing[24]. Different formulation variables were studied and optimized to achieve the desired release profile. The stability of the formulations was evaluated after 3 months of storage at accelerated stability conditions. Finally, the in vivo performance of the optimized formulation was predicted.[25]
Materials and Methods:
Materials:
Diclofenac sodium salt was provided as a gift from a pharmaceutical factory. The following materials was obtained from commercial vendors .Mannitol, Lactose , Cellulose acetate (CA), polyethylene glycol (PEG) 400, Sodium lauryl sulphate , polyvinyl pyrrolidone (PVP)(Plasdone K-29/32w, ISP, USA), talc, Sodium chloride, Microcrystalline cellulose, Magnesium stearate, castor oil ,methanol, acetone. Water used thought the analysis was prepared by reverse osmosis. All solvents and reagents used in the study were of analytical grade.
Methods:
Differential scanning calorimetry:
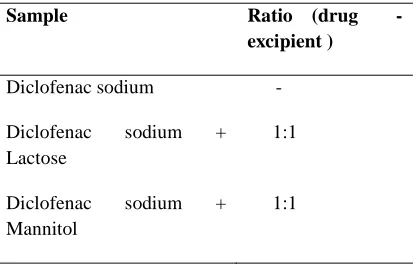
Table 1: Drug – excipient ratio for differential scanning calorimetry study
Sample Ratio (drug
-excipient )
Diclofenac sodium -
Diclofenac sodium + Lactose
1:1
Diclofenac sodium + Mannitol
1:1
Drug analysis
Spectrophotometeric method for determination of Diclofenac sodium was used. The calibration curve of diclofenac sodium (y = 0.029x + 0.015) was linear between 5µg/ml and 30µg/ml (r2 = 0.9995). The drug content of the formulation and the amount of the drug released in dissolution fluids were determined (with appropriate dilution) by using calibration curves. Samples were analyzed on a UNICO UV/VIS spectrophotometer (model 2000) at 276 nm.
Granulation and tablet compression
Tablets were prepared by wet granulation, using 100mg of diclofenac sodium per tablet, magnesium stearate as lubricant, PVP as binder, talc glidant, lactose, Mannitol, sodium chloride as osmagents and microcrystalline cellulose as a diluent, in sufficient quantities to obtain a final mass of 300mg per tablet. The composition of the tablets is described in Table 2. For preparation of core tablets, the batch size was kept as 100 tablets. All the ingredients, except lubricant magnesium stearate, glidant talc and binder polyvinylpyrrolidone (PVP), were manually blended homogeneously in a mortar by way of geometric dilution. The mixture was moisturized with PVP solution in isopropyl alcohol ,and granulated through sieve No. 18 (aperture size 1000 µm, US Standard) to
obtain the desired consistency of the mass . The granulated blend was dried in a hot air oven at 40 oC for sufficient time (3 to 4 hours) so that the moisture content of the granules reached 3–5%. The dried granules were passed through sieve No. 26 (aperture size 710 µm, US Standard) and blended with talc and magnesium stearate. The homogeneous blend was then compressed into tablets (300 mg each) using 9-mm diameter, deep concave punches. The compression force was adjusted to give tablets with approximately 7 kg cm2 hardness on a tablet hardness tester. A constant compression force was obtained by using the same distance between the upper and lower punches.
Coating
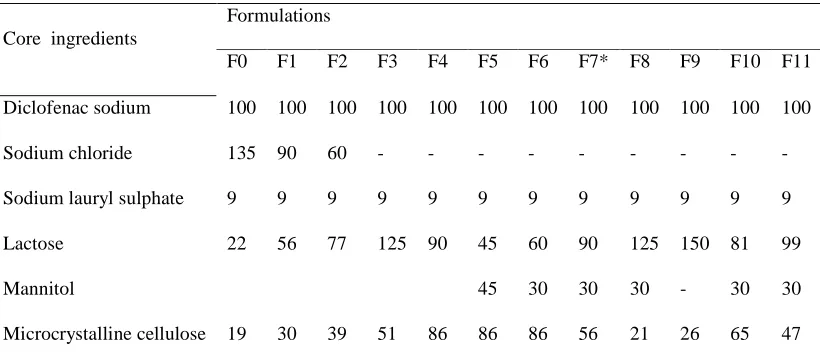
Table 2: Content of Core formulation
Core ingredients
Formulations
F0 F1 F2 F3 F4 F5 F6 F7* F8 F9 F10 F11 Diclofenac sodium 100 100 100 100 100 100 100 100 100 100 100 100
Sodium chloride 135 90 60 - - - -
Sodium lauryl sulphate 9 9 9 9 9 9 9 9 9 9 9 9
Lactose 22 56 77 125 90 45 60 90 125 150 81 99
Mannitol 45 30 30 30 - 30 30
Microcrystalline cellulose 19 30 39 51 86 86 86 56 21 26 65 47 Every formulation contains Magnesium stearate 2mg, Talc 2mg, PVP 11mg, Compositions weight (mg /Tablet) Total tablet weight 300mg. * optimized formulation.
Table 3: Composition of different coating solutions
Coating code O1 O2 O3* O4 O5 O6
Cellulose acetate (% w/v) 2 2 2 2 2 2
Castor oil (% w/w of CA) 10 10 10 20 20 20
PEG – 400 (% w/w of CA)
20 20 30 20 20 30
PVP (% w/w of CA) 25 50 25 35 50 35
Methanol (ml) 20 20 20 20 20 20
Acetone (ml) 76 76 76 76 76 76
Compositions given in terms of % (w/w) of CA, total solids 4 %.( w/w). * optimized formulation
Evaluation of developed formulation
Characterization of tablet formulation:
Physical characteristics of the tablets were tested according to European Pharmacopoeia methods. Tablet weight was measured using an analytical balance (Sartorius basic BA 1005, Germany), data was obtained from 20 tablets, prepared at the same compression force. The tablet disintegration test was performed employing a disintegration tester using
analyzed using a validated UV spectrophotometer method at 276 nm.
In vitro dissolution
The developed formulations (n = 6) were subjected to release studies using USP-I dissolution apparatus () at 100 rpm. Dissolution medium used was simulated intestinal fluid (SIF, pH 6.8, 900 ml) maintained at 37 ± 0.5 ◦C. The samples were withdrawn (10 ml) at different time intervals and replaced with an equivalent amount of fresh medium. The dissolution samples, after filtration through 0.45µm nylon membrane filters, were analyzed using a validated UV spectrophotometer method at 276 nm. After analyzing the drug content in the dissolution samples, corrections were made for the volume replacement and the graph of cumulative percentage of drug release versus time was plotted.Calculation of the similarity factor (f2) The similarity of dissolution profiles was analysed using both the “difference factor, f1[26] and the “similarity factor, f2[27] defined in Eqs. (1) and (2).
…Eqn (1)
……….. Eqn (2)
In this equation wt is an optional weight factor, the reference assay and the test assay at time point t. At least 12 time points were used inform of their mean dissolution values to estimate the similarity factor. Due to its sensitivity to the number of dissolution time points, only one measurement point was considered after 85% release. The two release profiles were considered to be similar; if f1 value was
lower than 15 (between 0 and 15) and f2 value was more than 50 (between 50 and 100). For the calculation of f1 and f2 values, only one data point was taken into consideration after 85% of the drug was released.
Release models and kinetics
Generally, the release of drug from oral osmotic systems is controlled by various factors such as osmotic pressure, aperture diameter, coating thickness, permeability of membrane; solubility of drug pore-forming agent .Dissolution data of the optimized formulation F7O3 was fitted to various mathematical models (zero-order, first-order, and Higuchi) in order to describe the kinetics of drug
release. Sodium diclofenac release kinetics was evaluated according to the following models.
Zero order: Qt = Q0 + K0t ...Eqn (3)
First order: .. Eqn (4)
Higuchi: .. Eqn (5)
Hixson–Crowell: .. Eqn (6)
Korsmeyer–Peppas: Eqn (7)
where Qt is the amount of drug dissolved in time t; Q0 is the initial amount of drug in the solution (most
times Q0 = 0); Qi = is the initial amount of drug in the
pharmaceutical dosage form; Qr is the amount of drug
remaining as a solid state at time t; Mt/M∞ = is the fractional drug release; K0, K1, KH, KS and KK are,
respectively the zero order, the first order, the Higuchi’s, the Hixson–Crowell’s and the Korsmeyer’s release constants; and n is an exponent which characterizes the drug release mechanism.[28-32] Smallest value of SSR and AIC and best goodness-of-fit test (R2) were taken as criteria for selecting the most appropriate model [31].
Effect of PH
The effect of pH was studied to assure a reliable performance of the developed formulations independent of pH. Release studies of the optimized formulations were conducted in media of different pH (Simulated gastric fluid, pH 1.2; acetate buffer, pH 4.5; and Simulated intestinal fluid , pH 6.8).Dissolution apparatus used was rotating basket type (USP-I) at 100 rpm , and the temperature was maintained at 37.5 ± 0.5 oC. The samples (10 ml) were withdrawn at predetermined intervals and analyzed after filtration through 0.45-µm nylon membrane filters. The percentage cumulative drug release of optimized formulations at various pH was plotted and compared.
Effect of agitation Intensity
intervals and analyzed after filtration through 0.45-µm nylon membrane filters
Effect of Osmotic pressure
In order to confirm the mechanism of drug release, release studies of the optimized formulations were conducted in media of different osmotic pressure. To increase the osmotic pressure of the release media, sodium chloride (Osmotically effective solute) was added in SIF [33, 34] and osmotic pressure was measured using an osmometer,. The pH was adjusted to 6.8 ± 0.05. Release studies were carried out in 900 ml of media using USP I dissolution test apparatus (100 rpm). Release profiles of the optimized formulations at different osmotic pressure was plotted and compared.
Effect of type and level of pore former.
To study the effect of type of pore former, formulations were prepared by coating core tablets of Diclofenac sodium with coating compositions containing different levels of pore formers (PVP, PEG-400). The type of pore former affected drug release and it is possible to achieve the desired release by using different types and/or combination of pore formers. To study the effect of pore former on the drug release PEG-400 was used at the level of (20
and 30%) and PVP was used at a level of (25, 35 and 50%) (w/w) of CA. Due to insolubility of PVP in pure acetone, the coating solution was prepared from a methanol –acetone mixture. This increased the miscibility and physical stability of the solution. Prediction of in vivo performance
Using the known pharmacokinetic properties of drugs (Table 4 ) and various drug release parameters (R0 and tDel), which were calculated from in vitro release data, steady-state blood levels of drugs were predicted by the method of superposition [35]. It was assumed that after the administration of a test dose of formulation, the drug would be released at a release rate (R0) for a period of time (tDel) shorter than the selected dosing interval (τ). Time of delivery, tDel, is the time taken to deliver 90% of the total drug within a selected dosing interval (τ =12 h). The predicted steady-state plasma levels of optimized formulations were compared with the desired levels by calculating the percent-predicted error (% PD) in Css max and AUC0–τ . Bioequivalence was anticipated [36, 37], if the average % PD was less than 15% for Css max and AUC0–τ. The % PD was calculated using following equation:
……..Eqn (8)
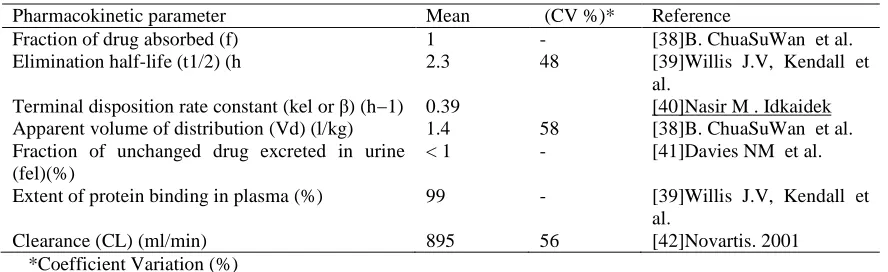
Table 4: Important pharmacokinetic parameters of Diclofenac sodium
Pharmacokinetic parameter Mean (CV %)* Reference
Fraction of drug absorbed (f) 1 - [38]B. ChuaSuWan et al.
Elimination half-life (t1/2) (h 2.3 48 [39]Willis J.V, Kendall et al.
Terminal disposition rate constant (kel or β) (h−1) 0.39 [40]Nasir M . Idkaidek Apparent volume of distribution (Vd) (l/kg) 1.4 58 [38]B. ChuaSuWan et al. Fraction of unchanged drug excreted in urine
(fel)(%)
< 1 - [41]Davies NM et al. Extent of protein binding in plasma (%) 99 - [39]Willis J.V, Kendall et
al.
Clearance (CL) (ml/min) 895 56 [42]Novartis. 2001
*Coefficient Variation (%)
Stability studies
The purpose of stability study is to provide evidence on the quality of a drug substance or drug product which varies with time under the influence of a variety of environmental factors such as temperature, humidity and light. The formulation was subjected to accelerated stability studies as per ICH (The International Conference of Harmonization) guidelines. The optimized formulation was sealed in
Results and Discussions
Formulation development:
Development of a osmotic system for delivery of low-solubility API's involves a core tablet, prepared on a conventional tablet press, which is coated, in a pan-coater, with a semi-permeable membrane. The tablet core is surrounded by a rate controlling membrane that consists of semi permeable membrane forming polymer, water-soluble additive(s), and plasticizer capable of improving film formation properties of the polymers, Cellulose acetate as the water-insoluble polymer. The core compartment imbibes aqueous fluids from the surrounding environment across the membrane and the dissolved drug is released from the pores formed in the membrane after leaching of water-soluble additive. Below, the effects of the components on the performance as well as some mechanistic aspects of the system are discussed..
Table 5: Evaluation parameters of the optimized coated tablets
Parameter Average ± SD
Tablet weight (mg, n=20) 312.44 ± 0.41 Hardness (kg/cm2, n= 10) 7.46 ± 0.35 Content Uniformity (% , n =
5)
98.56 ± 0.88
Weight gain (% of core , w/w)
4.13
Friability (%) of core tablets 0.29
Drug excipient compatibility testing:
Incompatibility between drugs and excipients can alter stability and bioavailability of drugs, thereby, affecting its safety and/or efficacy. Study of drug– excipient compatibility is an important process in the development of a stable solid dosage form. Drug– excipient compatibility testing at an early stage helps in the selection of excipients that increases the probability of developing a stable dosage form. In recent years DSC (differential scanning calorimetry) has gained popularity since it is easy and quick. It is based on the detection of endothermic and exothermic peaks that appear as a consequence of small changes in temperatures. The number, location and shape of these peaks
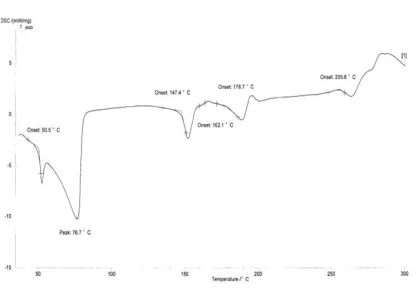
are used to identify a substance .[43] When the substance undergoes a thermal event, the difference in the heat flow to a sample and to a reference is monitored against time or temperature while the temperature is programmed in a specified atmosphere. As a result, energy associated with various thermal events (e.g., melting, glass transition temperature, crystallization, etc.) can be evaluated.[44, 45] The results are shown in Fig. 4. The DSC curve of Diclofenac sodium (active substance) showed an exothermic peak of melting at 280°C followed by an endothermic peak of decomposition as mentioned in the literature .[46]. [47] . In majority of the cases, melting endotherm of drug was well preserved with slight changes in terms of broadening or shifting towards the lower temperature. It has been reported that the quantity of material used, especially in drug– excipient mixtures, affects the peak shape and enthalpy[48] . Thus, these minor changes in the melting endotherm of drug could be due to the mixing of drug and excipient, which lowers the purity of each component in the mixture and may not necessarily indicate potential incompatibility [49].The DSC scan of diclofenac sodium in the presence of lactose showed endothermic peaks at 147.40 ◦C (corresponding to dehydration of bound water), 162.10 ◦C (crystalline transition), 178.7 ◦C (melting point)for lactose. The melting endothermic peak of diclofenac sodium in the mixture was at 255.6 ◦C which suggested compatibility. A sharp melting endotherm for Mannitol was observed at 158.9 ◦C in the DSC trace of Mannitol. The results confirmed that DSC could be used as a rapid method to evaluate the compatibility between drug and excipients. No concrete evidence of interaction was observed between Diclofenac sodium and selected osmotic excipients used in the development of osmotic formulations of Diclofenac sodium.
Figure 2: DSC thermogram of Diclofenac sodium with lactose
Drug analysis UV
A linear relation in the concentration range between 5µg/ml and 30µg/ml (r2 = 0.9995) was found. The Repeatability (RSD %) was 0.167 .On the basis of above results, the analytical method was applied to the direct determination of DS in the formulations.
Formulation aspects of core tablets
Effect of type and level of osmagent
Osmotic pumping release from tablets was first developed by Theeuwes [5], with one drilled exit port through a semi permeable membrane coat but modified by Zentner with a porous barrier membrane coat, in which osmotic pumping showed to be the major release mechanism after dissolving the inner components of the tablet by the water imbibed. Since the osmotic pressure in the GIT remains relatively low, an osmagent that provides a significantly higher osmotic pressure will effect a steady driving force for water imbibition through the tablet coating. The driving force of internal osmotic pressure caused by dissolving either osmotic drug or osmotic agent or both acts radically outwards and deforms the surrounding membrane coat. To study the effect of type and level of osmotic agent, formulations containing different levels and composition of osmotic agents (Mannitol, Sodium Chloride, Lactose) were studied. The release profile of formulations was used to assess the influence of osmagents as shown in this figures, the type and level of osmotically active agent in the core formulation affected the drug release from osmotic formulations. In evaluation of level and type of osmotic agent coating code (O3) 4%, weight gain was used in all the experiments. The results also showed that the formulations with NaCl (F0, F1, and F2) had increased lag time (tlag)[50] before the onset of dissolution, (tlag) 1.255 h, 0.795 h,0.358 h respectively. It was noted that drug release
rate increased as the amount of osmotic sugar lactose increased, this was irrespective of the increase in the amount of sodium chloride. The release profile of formulations (F5, F6, and F7) was used to assess the influence of osmotic agents mannitol and lactose used in combination. From figure it is observed that drug release increase in the level (15% ,20 % , 30% ) of osmotic agent.
Fig 3: Effect of osmotic sugar Lactose on drug
release.
Fig 4: Effect of level of osmagents on drug release
Evaluation of membrane variables
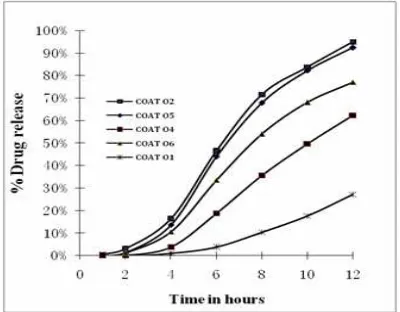
pore former also affected the extent of drug release. Maximum drug release after 12 h was less than 30% in formulations containing up to 25% (w/w) of PVP and around 60% from formulations with 35% (w/w) of PVP. In case of formulations with 50% of PVP, more than 90% of the drug release took place in 12 h. From figure 5 it is observed that as the level of PEG-400 increases from 20% to 30%, COAT 06 and COAT 04 respectively, drug release increased from 62% to 77% in 12 h. As evident from Figure 5, the type of pore former affected drug release and it is possible to achieve the desired release by using different types of pore formers. As the level of pore former increases, the membrane becomes more porous after coming in contact with the aqueous environment, resulting in faster drug release. As the pore former level increases, the membrane becomes porous after coming in contact with the water (when the pore former leaches out of the membrane).[51, 52]
Fig 5: Effect of level of pore forming agents and plasticizer on drug release
Effect of coating thickness on drug release
To investigate the effect of weight gain of the coating on drug release, core tablets of diclofenac sodium (core code:) were coated (coating composition A) for sufficient duration so as to get tablets with different weight gains (3,4,and 6% w/w). Release profile of diclofenac sodium from these formulations is shown in Figure 6. It is clearly evident that drug release decreases with an increase in weight gain of the membrane. No bursting of the systems was observed during the dissolution run in any of the formulations
Fig 6: Effect of weight gain on Diclofenac release
Effect of plasticizer
Plasticizers modify the physical properties of polymers and improve their film-forming characteristics by changing their viscoelastic behaviour. Plasticizers turn a hard and brittle polymer into a softer, more pliable material and possibly make it more resistant to mechanical stress .To study the influence of plasticizer the core tablets were coated using semipermeable membrane of 2% w/v cellulose acetate (CA), coating code O2 and O5. The CA membrane were plasticized with 10% (O2), and 20% (O5) w/w, total weight of CA by castor oil. As observed in fig 5 the increase in level of castor oil resulted in decreased drug release, hydrophobic plasticizers like castor oil were found to decrease drug release from osmotic formulations.[53]
Effect of PH
Fig 7: Effect of agitational intensity of the release media on Diclofenac release
Effect of Osmotic pressure:
The effect of osmotic pressure on the optimized formulation was studied in media of different osmotic pressure, and the release profile with varying osmotic pressure is depicted in fig 8. The results of release studies of optimized formulations in media of different osmotic pressure indicated that, the drug release is highly dependent on the osmotic pressure of the release media. Diclofenac sodium release from the formulations decreased as the osmotic pressure of the media increased from 7.81 atm, 13.84 atm, and 21.28 atm. The release was inversely related to the osmotic pressure of the release media. This finding confirms that the mechanism of drug release is by the osmotic pressure.
Fig 8: Effect of osmotic pressure of the release media on Diclofenac release
Effect of agitational intensity
Drug release from osmotic pumps, to a large extent, is independent of agitational intensity of the release media. Further the effect of agitational intensity on the drug release from the optimized formulation was
investigated (Fig.9).. The f1 and f2 values were found to be 9.77 and 61.9 (between 100 and 50 rpm), 4.03 and 78.14 (between 100 and 150 rpm), and 5.99 and 71.21 (between 50 and 150 rpm), respectively. It was observed that the agitation intensity of 50, 100 150 rpm of dissolution medium had no significant effect (P >0.05) on the rate and extent of Diclofenac sodium release from optimized osmotic formulation. Hence, it can be expected that the release from the developed formulation will be independent of the hydrodynamic conditions of the absorption site.
Fig 9: Effect of agitational intensity of the release media on Diclofenac release.
Performance evaluation of optimized formulation:
sodium in 1, 2, 4, 6, 8, 10, and 12 h. The fitted design was analyzed as polynominal model in quadratic order. Afterwards, the information about the model reliability was verified by using the analysis of variance (ANOVA). The estimation of model factors’ significance was performed by Student’s t-test. The data clearly indicate that the dependent variables are strongly dependent on independent variables. The R-square and adjusted R-R-square value for R4 is 0.9862 and 0.9449 respectively. Whereas for R6 these values are 0.9966 and 0.9863 respectively. The fitted equations relating the response R4 and R6 to the transformed factors are as follow:
R4 (6 hour) = 83.33 + 3.31*A + 6.42*B - 3.38* C - 5.67 * A * B -0.68* A * C - 0.11 * B * C - 3.57 * A2 -7.75 * B2 - 18.81 * C2
R6 (10 hour) = 93.87 + 1.93* A + 5.41*B - 2.88*C - 2.53*A*B - 0.51* A * C + 1.56*B*C + 2.14*A2 - 4.95*B2 -12.17 * C2
Only statistically significant coefficients are included in the equations. A factor is considered to influence the response if the effects significantly differ from zero and the p-value is less than 0.05. Positive sign before a factor in polynomial equations represents that the response increases with the factor, a negative sign means the response and factors have reciprocal relation. It is clear Amount of osmotic agent (A) , Pore former (B) have positive effects on the responses.
Fig: 10A and 10B Response surface plots with contours
Response surface plots with contours, as presented in Fig. 10A and 10B, are very useful to see interaction effects of the factors on the responses. These types of plots show effects of two factors on the response at a time. In all the presented figures, the C factor was kept at level zero. Fig. 10A and 10B predicted that as we increase the concentration of A and B, the R6 and R10 values were increased. However, response surface plots show the scenario more clearly. Fig. 9A and 9B shows that a R6 and R10 value is highest if the A and B are kept at the highest level.
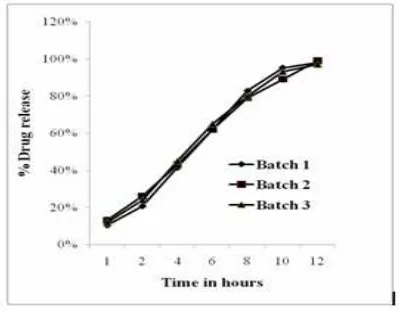
Reproducibility of manufacturing procedure:
The reproducibility of the manufacturing procedure was confirmed by preparing three repeat batches of the final optimized formulation on three different occasions. Release studies were conducted in and similar release profiles were obtained (Fig. 11) demonstrating that the manufacturing procedure is
Fig 11: Reproducibility of the manufacturing procedure—Diclofenac release from three repeat batches
Kinetics and mechanism of drug release
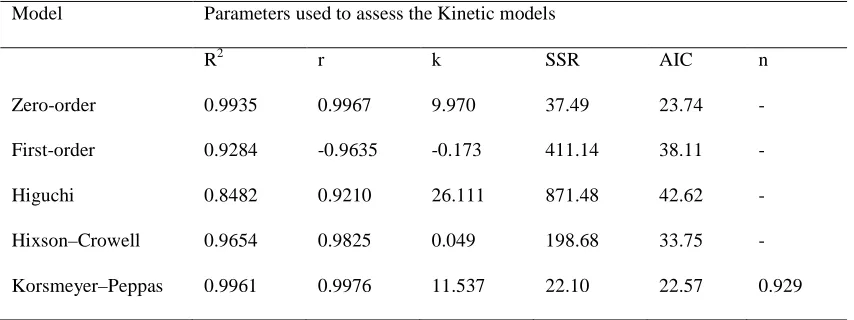
The linear nature of the plots between percent cumulative drug release and time suggests that none of the formulations follow first-order kinetics, which is further confirmed by the higher sum of square residuals and comparatively less volumes of correlation coefficient. The linear nature of the curves obtained for zero order, Hixson–Crowell and Korsmeyer–Peppas model suggests that the release from the formulations may follow any one of these models. While considering the higher correlation coefficient values and fewer sums of squared residual (SSR) values, the release data seem to better fit with zero-order model. Smallest value of SSR and AIC and best goodness-of-fit test (R2) were taken as criteria for selecting the most appropriate model[31] .
The dissolution data of diclofenac sodium osmotic formulation was found to fit well into zero-order kinetics (Table 7) confirming that release from the formulations to be drug load independent. The n exponent from Korsmeyer–Peppas model can be used to characterize the drug release mechanisms as Fick diffusion, when n = 0.5 and as a non-Fickian model if n is between 0.5 and 1.0 or n = 1.0. When n = 0.5, the drug release is controlled by diffusion and is time-dependent while when n = 1.0, the drug release is controlled by swelling and is time-independent with zero order kinetics. Values of n between 0.5 and 1.0 indicate superposition of both phenomena, known as anomalous transport. Based on Korsenmayer–Peppas power model, drug release data were further analyzed for curve fitting and the results confirmed that the formulations showed non-Fickian diffusion kinetics n=0.929 , (n > 0.5) (Table 7).
Table 6: Comparison of experimental and predicted values of optimized formulation
R1 R2 R3 R4 R5 R6
Predicted 9.97 19.94 39.88 59.82 79.76 99.70
Experimental 10.34 20.69 41.38 62.07 82.76 95.17
Table 7: Statistical analysis and correlation coefficient values for dissolution data of the optimized diclofenac sodium formulation based on various kinetic models
Model Parameters used to assess the Kinetic models
R2 r k SSR AIC n
Zero-order 0.9935 0.9967 9.970 37.49 23.74 -
First-order 0.9284 -0.9635 -0.173 411.14 38.11 -
Higuchi 0.8482 0.9210 26.111 871.48 42.62 -
Hixson–Crowell 0.9654 0.9825 0.049 198.68 33.75 -
Korsmeyer–Peppas 0.9961 0.9976 11.537 22.10 22.57 0.929
R2: Goodness-of-fit; r: correlation coefficient; SSR: sum of squared residuals; AIC: Akaike Information Criterion; and k: release rate constant for respective models (k0 in mg/h, k1 in h−1, kH in %/h1/2 , ks and kk for zero-order,
Drug release profile predicted
In the case of controlled release systems, the rate of drug input into the body (the dosing rate) is governed by rate of drug release from delivery system. Although there are different kinetic models and equations that can be used to describe the drug release kinetics from a controlled release system, it is widely accepted that the ideal formulation for many drugs is one that gives zero order in vivo drug release .Hence zero order kinetic models is presumed as a design option to calculate the desired drug release rates for a controlled drug release system (Ritschel,1989).The desired values are influenced by several factors such as therapeutically efficacious blood drug levels, the desired duration of efficacy and the pharmacokinetic characteristics of the drug. The three most important pharmacokinetic parameters are drug clearance (Cl), volume of distribution (Vd) and elimination rate constant (kel). The estimates of Cl,effective drug concentration and extent of availability define the appropriate dosing rate (R0, dose and dosing interval) of the drug by a particular route of administration
(Eq. (1.3)) (Boxenbaum, 1982; Ritschel, 1988).
Eqn (10)
where F is bioavailable fraction of the dose that reaches the systemic circulation, and Cssav is average blood drug concentration at steady state. Ritschel (1989) described a simple approach to calculate design parameters (dose, delivery time and release rate) for a controlled drug delivery system that would achieve desired steady-state blood drug concentration levels on multiple dosing. A stepwise procedure, as described by Ritschel (1989), can be briefly described as follows:
(a) The time span of delivery (tdel) for a predetermined dosing interval is estimated using desired steady-state concentration levels and drug’s elimination half-life.
(b) Pharmacokinetic data of the drug are used to predict the blood drug concentrations (from a test dose, mostly the conventional dose) at different time points during the dosing interval.
If the drug release follows zero order kinetics then the plasma drug concentration at time ‘t’, for a simple, one compartment heterogeneous system is determined by Ritschel.
Eqn (11)
where k0 is zero order release rate = dose/delivery time (tdel). And blood drug concentration at steady state
Eqn (12)
Blood drug concentration versus time data thus generated from the single dose of the drug are then applied to estimate accumulation to the steady state using the superposition method. The pharmacokinetic properties of Diclofenac sodium that are used for calculations are taken from literature. Based on the predicted steady
state levels, the test dose of the drug is modified so that the modified dose achieves the desired concentration levels at the steady state. The desired drug release rate is determined from the dose and tdel [35]. Since osmotic pumps are reported to exhibit a significant in vitro/in vivo correlation, predicted data of steady-state plasma levels from drug release studies can be used for comparison with the desired plasma levels. The desired steady-state plasma levels of diclofenac sodium were predicted from a theoretically designed zero-order delivery system. It is clearly evident from the figure that the predicted steady-state plasma levels are very close to the desired levels. The predicted Css max and AUC0–τ
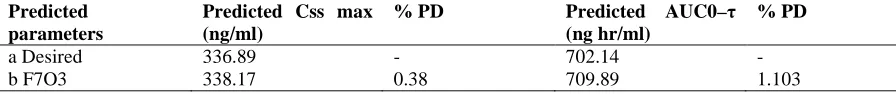
after administration of the optimized formulations of diclofenac sodium, in comparison with the desired ones are listed in Table 8. The %PD of the steady-state parameters of optimized formulations was calculated taking the data of desired profile as the reference. The absolute % PD was found to be less than 15%, ensuring that the optimized formulations will produce plasma levels close to the desired ones [36, 37]. Thus, it can be concluded that the developed formulation will produce plasma levels well within the therapeutic range and similar to those produced by the desired zero order delivery profile.
a Predicted from desired zero-order delivery profile dose =100 mg,
b*Predicted from drug release studies dose = 100 mg %PD Percent – predicted error.
Stability studies
Table .8: Predicted in vivo performance of the developed formulation for Diclofenac sodium.
Predicted parameters
Predicted Css max (ng/ml)
% PD Predicted AUC0–τ
(ng hr/ml)
% PD
a Desired 336.89 - 702.14 -
b F7O3 338.17 0.38 709.89 1.103
Table 9: Physiochemical properties of optimized formulation during 3 month stability
Parameter Initial 1 Month 2 Month 3 Month
Drug Content (%±SD) 98.7±0.51 97.85±0.68 98.07±0.98 97.97±0.34
Hardness (Kg/ cm2 ±SD) 7.84±0.48 6.98±23 7.31±42 7.42±37
f1 value - 4.03 2.92 3.14
f2 value - 75.26 84. 67.85
Initial sample (0 month) was taken as reference to calculate f1 and f2 values.
Fig.10: Dissolution stability of Diclofenac optimized formulations after 3 months of storage at 40 ◦C and 75% RH
Conclusion
In the present study, controlled release formulations of Diclofenac sodium, based on osmotic technology, were developed. The release from the developed formulations was independent of pH and agitational intensity of the release media, assuring the release to be fairly independent of pH and hydrodynamic conditions of the body. Drug release data from Diclofenac sodium formulations fitted well into
studies, steady-state plasma levels were predicted using the method of superposition. The predicted steady-state levels were within the desired range to show the therapeutic. Since osmotic pumps are reported to exhibit a good in vitro/in vivo correlation, based on in vivo performance prediction, the developed formulations can be expected to perform similar in vivo.
“Cite this article”
Michael R. Mutyaba, Bo Wang, He ying Xue “Development and Optimization of Controlled Drug
Release Formulation of Diclofenac Sodium Based on
Osmotic Technology” Int. J. of Pharm. Res. & All. Sci.2012; Volume 1, Issue 3,43-59
References
1. Liversidge, M., Nanocrystals:resolving pharmaceutical formulation issues associated with poorly water-soluble compounds. Marty, J.J. (Ed.),Particles. Marcel Dekker, Orlando., 2002. 2. R.K. Verma, S. Arora, S. Garg, Osmotic pumps
in drug delivery, Crit. Rev. Therap.Drug Carrier Sys. 21 (6) (2004) 477–520.
3. G. Santus, R.W.B., Osmotic drug delivery: a review of the patent literature,J. Control. Release 35 (1) (1995) 1–21.
4. P.S.L. Wong, S.K.G., B.E. Stewart, Osmotically controlled tablets, Drugs Pharm.Sci. 126 (2003) 101–114 (Mod-Rel. Drug Del. Tech.).
5. Theeuwes F, S.D., Wong P, Bonsen P, Place and H.K. V, Kwan KC., Elementary osmotic pump for indometacin. J pharm Sci 1983; 72:253-258. 6. Eckenhoff B, T.F., Urquhart J., Osmotically
actuated dosage forms for rate-controlled drug delivery. Pharm Technol 1987; 11:96–105. 7. Theeuwes, F., Oral dosage form design—status
and goals of oral osmotic systems technology.1984. Pharm. Int. 5, 293–296. 8. X. Liu, D.C., R. Zhang,, Evaluation of
monolithic osmotic tablet system for nifedipine delivery in vitro and in vivo, Drug Dev. Ind. Pharm. 29 (7) (2003) 813–819.
9. J. Shokri, P.A., P. Rashidi, M. Shahsavari, A. Rajabi-Siahboomi, A. Nokhodchi,, Swellable elementary osmotic pump (SEOP): an effective device for delivery of poorly water-soluble drugs, Eur. J. Pharm. Biopharm. 68 (2) (2008) 289–297. 10. E.-X. Lu, Z.-Q.J., Q.-Z. Zhang, X.-G. Jiang,, A water-insoluble drug monolithic osmotic tablet system utilizing gum Arabic as an osmotic, suspending and expanding agent, J. Control. Release 92 (3) (2003) 375–382.
11. Mishra, M.R.a.B., Comparative evaluation of in vitro performance of commercial and fabricated sustained release diclofenac sodium tablets, Ind. J. Pharm. Sci. 63 (2001) 247–250.
12. Mishra, M.R.a.B., Effect of admixed polymers on diclofenac sodium release from matrix tablets, Pharm. Pharmacol. Lett. 11 (2001) 76–78. 13. G. Garcia-Encina, D.T., B. Seijo and J. L. Vila
Jato, Formulation and in vitro evaluation of HPMCP-microencapsulated drug-resin complexes for sustained release of diclofenac, Int. J.Pharm. 121 (1995) 239–243.
14. E. A. Hosny, A.R.M.A.-H.a.M.A.A.-D., Comparative study of in vitro release and bioavailability of sustained release diclofenac sodium from certain hydrophilic polymers and commercial tablets in beagle dogs, Pharm. Acta Helv. 72 (1997) 159–164.
15. C. Sajeev, G.V., R. Archna and R. N. Saha, Oral controlled release formulation of diclofenac sodium by microencapsulation with ethyl cellulose, J. Microencap. 19 (2002) 753–760. 16. C.M. Adeyeeye, P.K.L., in: K. Florey (Ed.),
Analytical Profiles of Drug Substances, vol. 19, Academic Press, New Jersey, 1990, pp.123–144. 17. M.V. Velasco, J.L.F., P. Rowe, A.R. Rajabi-Siahboomi,, Journal of Controlled Release . 57 (1999) 75–85.
18. Guidance, F., The Biopharmaceutics Classification System (BCS) Guidance (accessed 6/16/04). http://www.fda.gov/cder/OPS/ BCS guidance.htm. Part of U.S. Food and Drug Administration (accessed 6/16/04). http://www.fda.gov.
19. Azarmi, S., Roa, W., Löbenberg, R., 2007, Current perspectives in dissolution testing of conventional and novel dosage forms. Int. J. Pharm. 328, 12–27.
20. Pillay, V., Fassihi, R., 1998., Evaluation and comparison of dissolution data derived from different modified release dosage forms: an alternative method. J. Control.Release 55, 45–55. 21. Siewert, M., Dressman, J., Brown, C., Shah, V.,, FIP/AAPS guidelines for dissolution in vitro release testing of novel/special dosage forms. 2003 Diss. Technol. 10,6–15.
22. Graffner, C., Regulatory aspects of drug dissolution from a European perspective. Eur. J. Pharm. Sci.2006 . 29, 288–293.
23. Dokoumetzidis, A., Macheras, P., Acentury of dissolution research: from Noyes and Whitney to the biopharmaceutics classification system. Int. J. Pharm.2006. 321,1–11.
alternative method. J. Control. Release1998. 55, 45–55.
25. Ekarat Jantratid a, V.D.M., Emanuela Rondab, Valentina Mattavelli , and J.B.D. Maria Vertzonic, Application of biorelevant dissolution tests to the prediction of in vivo performance of diclofenac sodium from an oral modified-release pellet dosage form. European Journal of Pharmaceutical Sciences, ( 37 ): p. 434–441. 26. Flanner, J.W.M.a.H.H., ,“Mathematical
Comparison of Dissolution Profiles,” Pharm. Technol. 20 (6), 64–74 (1996).
27. Shah, V.P., Tsong, Y., Sathe, P., Liu, J.P, In vitro dissolution profile comparison—statistics and analysis of the similarity factor, f(2). Pharm. Res1998. 15,889–896..
28. Hixson, A.W., Crowell, J.H.,, Dependence of reaction velocity upon surface and agitation. Ind. Eng. Chem 1931.. 23, 923–931.
29. Higuchi, t., Mechanism of sustained-action medication. Theoretical analysis of rate of release of solid drugs dispersed in solid matrices. J. Pharm. Sci. 52,1963 ,1145–1149.
30. Korsmeyer, R.W., Peppas, N.A., . Macromolecular and modeling aspects of swelling-controlled systems. In: Roseman, T.J., Mansdorf, S.Z. (Eds.), Controlled Release Delivery Systems.1981 Marcel Dekker, New York, pp. 77–90.
31. Costa, P., Lobo, J.M.S.,, Modeling and comparison of dissolution profiles. 2001 Eur. J. Pharm. Sci. 13, 123–133.
32. Tanaka, N., Imai, K., Okimoto, K., Ueda, S., Tokunaga, Y., Ohike, A., Ibuki, R., and K. Higaki, Kimura, T., , Development of novel sustained-release system, disintegration-controlled matrix tablet (DMCT) with solid dispersion granules of nilvadipine. J. Control. Release 2005 108, 386–396.
33. Liu, J., Farber, M., Chien, Y.W., , Comparative release of phenylpropanolamine HCl from long-acting appetite suppressant products: acutrim vs. dexatrim. Drug Dev. Ind. Pharm.1984. 10, 1639– 1661.
34. Schultz, P., Kleinebudde, P., , A new multiparticulate delayed release system. Part I: dissolution properties and release mechanism. J. Control. Release1997. 47, 181–189.
35. Ritschel, W.A., Biopharmaceutic and pharmacokinetic aspects in the design of controlled release peroral drug delivery systems. Drug Dev. Ind. Pharm.1989. 15, 1073–1103. 36. Sheskey, P., Pacholke, K., Sackett, G., Maher, L.,
Polli, J.,. Roll compaction granulation of a controlled release matrix tablet formulation containing HPMC: effect of process scale-up on
robustness of tablets, tablet stability and predicted in vivo performance. Pharm. Technol. 2000. 24, 30–52.
37. Sheskey, P., Sackett, G., Maher, L., Lentz, K., Tolle, S., Polli, and J., Roll compaction granulation of a controlled release matrix tablet formulation containing HPMC: effect of process scale-up on robustness of tablets and predicted in vivo performance. Pharm. Technol 1999.., 6–21. 38. Chuasuwan, B., Binjesoh, V., Polli, J.E., Zhang,
H., Amidon, G.L., Junginger, H.E., Midha, and S. K.K., V.P., Stavchansky, S., Dressman, J.B., Barends, D.M.,, Biowaiver monographs for immediate release solid oral dosage forms: diclofenac sodium and diclofenac potassium. J. Pharm. Sci. 2009. 98, 1206–1219.
39. Willis, J.V., Kendall, M.J., Flinn, R.M., Thornhill, D.P.,Welling, P.G., . , The pharmacokinetics of diclofenac sodium following intravenous and oral administration. Eur. J. Clin. Pharmacol.1979 16, 405–410. 40. Idkaidek NM, A.G., Smith DE, Najib NM,
Hassan MM. , Determination of the population pharmacokinetic parameters of sustained-release and enteric-coated oral formulations, and thesuppository formulation of diclofenac sodium by simultaneous data fitting using NONMEM. Biopharm Drug Dispos1998. 99:169–174. 41. Davies NM, A.K., Clinical pharmacokinetics of
diclofenac. Therapeutic insights and pitfalls. Clin Pharmacokinet 1997 ,33:184–213.
42. 2001., N., Prescribing information of Cataflam and Voltaren. Available from URL http://www.fda.gov/cder/foi/label/2001/20254s2l bl.pdf.
43. W.W. Wendlandt, i., Differential Thermal Analysis and Differential Scanning Calorimetry, in Thermal analysis, Wiley ,1986. p. pp. 213– 298.
44. A.A.S. Araujo, S.S., L.P. Mercuri, F.M.S. Carvalho, M.S. and J.R.M. Filho, Int. J. Pharm. 260 (2003) 303–314.
45. P. Mura, A.M., G. Bramanti, S. Furlanetto, S. Pinzauti, Int. and J.P. 71–79.
46. M.A. Christianan, L.P.-K., in, Florey (Ed.) Analytical Profiles of Drug Substances, New York, 1990, . p. pp. 123–141.
47. M.E. Palomo, M.P.B., P. Frutos *, Analysis of diclofenac sodium and derivatives. Journal of Pharmaceutical and Biomedical Analysis, 1999. 21: p. 83-94.
48. P. Mura, A.M., G. Bramanti, S. Furlanetto, S. Pinzauti,, Int. Int. J. Pharm. 119 (1995) 71–79. 49. C.E.P. Malan, M.M.V., A.P. Lotter,, J. Pharm.
50. SHAN-YANG LIN, K.-H.L., MEI-JANE LI, Influence of Excipients, Drugs, and Osmotic Agent in the Inner Core on the Time-Controlled Disintegration of Compression-Coated Ethylcellulose Tablets. JOURNAL OF PHARMACEUTICAL SCIENCES, 2002. 91(9): p. 2040–2046.
51. Appel, L.E., Clair, J.H., Zentner, G.M., , Formulation and optimization of a modified microporous cellulose acetate latex coating for osmotic pumps. Pharm. Res. 1992. 9, 1664–1667. 52. Okimoto, K., Ohike, A., Ibuki, R., Aoki, O.,
Ohnishi, N., Rajewski, and S. R.A., V.J., Irie, T., Uekama, K., , Factors affecting membrane-controlled drug release for an osmotic pump tablet (OPT) utilizing (SBE)7m--CD as both a solubilizer and osmotic agent. J. Control. Release 1999. 60, 311–319.
53. E. Xian, Z.Q.J., Q. Z. Zhang A water insoluble drug monolithic osmotic tablet system utilizing
gum arabic as an osmotic, suspending and expanding agent. J. Control. Release, 2003, 92: 375-382.
54. Ragonese, R., Macka, M., Hughes, J., Petocz, P, The use of Box–Behnken experimental design in the optimization and robustness testing of a capillary electrophoresis method for theanalysis of ethambutol hydrochloride in pharmaceutical formulation.J. Pharm. Biomed. Anal. (2002) 27, 995–1007.
55. Montgomery, D.C., Design and Analysis of Experiments,1991. third ed. Wiley, New York. 56. M. Kincl, S.T., F. Vrecer, Application of