Measuring Software Component Reusability by
Coupling and Cohesion Metrics
Gui Gui*
Department of Computer Science, University of Essex, Colchester, UK Email: [email protected]
Paul. D. Scott
Department of Computer Science, University of Essex, Colchester, UK Email: {pscott}@essex.ac.uk
Abstract— This paper proposes a set of new static metrics of coupling and cohesion developed to assess the reusability of Java components retrieved from the Internet by a software component search engine. These metrics differ from the majority of established metrics in three respects: they measure the degree to which entities are coupled or resemble each other, they quantitatively take account of indirect coupling and cohesion relationship and they also reflect the functional complexity of classes and methods. An empirical comparison of the new metrics with eight established metrics is described. Results show the new metrics are consistently superior at measuring and ranking the reusability of software components.
Index Terms—Coupling, Cohesion, Metrics, Software Component, Reusability.
I. INTRODUCTION
The work reported in this paper arose as part of a project whose goal is to develop a system for retrieving Java components from the Internet. Users of such a system would be searching the Internet for components that can perform some clearly defined function and be reused within a larger software system. The first step of such a task is clearly to find components offering the required functionality. This part of the system is not included in this paper but has been described elsewhere [1]. However, material retrieved from the Internet is notoriously variable in quality. Consequently, it seems highly desirable that the search engine should also provide the user with an indication of both how reliable the component is and how readily it may be adapted for inclusion as part of a larger software system.
These two aspects of a software component are closely related. A well designed component, in which the functionality has been appropriately distributed to its various subcomponents, is more likely to be fault free and will be easier to adapt. Appropriate distribution of function underlies two key concepts of object-oriented
design: coupling and cohesion. Coupling is the extent to which the various subcomponents interact. If they are highly interdependent then changes to one are likely to have significant effects on the behavior of others. Hence loose coupling between its subcomponents is a desirable characteristic of a component. Cohesion is the extent to which the functions performed by a subsystem are related. If a subcomponent is responsible for a number of unrelated functions then the functionality has been poorly distributed to subcomponents. Hence high cohesion is a characteristic of a well designed subcomponent.
Many metrics have been proposed to measure the coupling and cohesion to predict the fault-proneness and maintainability of software systems. However, few studies had been done using coupling and cohesion to measure reusability of components because of their limitations and the difficulties to evaluate the reusability of components.
We therefore decided that the component search engine should provide the user with reusability evaluations of retrieved components based on measures of their coupling and average cohesion. (Other factors, notably customizability, also have implications for reusability, but these, are outside the scope of the present paper). The next section briefly surveyed a substantial literature on coupling and cohesion metrics. We then describe in detail the metrics we have developed for use in our system which attempt to address some of the limitations of existing metrics. In particular, we consider both the strength and transitivity of dependencies. The following section describes an empirical comparison of our proposed metrics and several popular alternatives as predictors of reusability. Section V presents an analysis of the results demonstrating that our proposed metrics consistently outperform the others. The paper concludes with a discussion of the contribution and the possible wider implications of the research.
II. ESTABLISHED COUPLING AND COHESION METRICS
Lots of research effort has been devoted to developing metrics that can be used to provide a numeric assessment of coupling and cohesion from the source code or detailed
Manuscript received November, 2008; revised February, 2009; accepted February, 2009.
design. A recent paper by Kanmani et al. [9] provides a useful summary of many of these metrics. This paper focuses on the main issues that have arisen in the development of such metrics for object-oriented systems and descriptions of representative examples used in the comparative study.
A. Coupling and Cohesion Metrics
Coupling is defined as: two objects are coupled if and only if at least one of them acts upon the other [18]. Since coupling is the extent to which the modules that make up a system are interdependent, a quantitative measure is to count the way in which one module may dependent on others. Nevertheless there is considerable variation depending on what counts as an interaction, how the counting is done and how the totals are normalised. Table I summarizes the characteristics of the metrics used in the comparative study.
TABLE I. COUPLING METRICS
Name Definition CBO
[5][6]
The coupling for a class is the number of classes to which it is coupled. A class is deemed to be coupled to another class if it accesses one or more of its variables or invokes at least one of its methods. The inheritance based coupling is ignored.
RFC [5] [6]
A count of the response set of a class; the response set comprises all the class’s methods plus all the other methods directly invoked by those methods.
CF [4][7] Classes are coupled if methods or instance variables in one class are used by the other. CF for a software system is number of coupled class pairs divided by total number of class pairs.
DAC[10] DAC for a class is the number of attributes (including methods and instance variables) having other classes as their types.
CBO (Coupling Between Object Classes) and RFC (Response for Class) are developed from a suit of metrics for object-oriented systems (the CK suit that has heavily influenced most subsequent work) proposed by Chidamber and Kemerer [5][6] in the early 90s. RFC although is not strictly pure coupling metrics, has been classed as such in some subsequent reviews and comparative studies [17]. Intuitively, RFC is a measure of how many different things a class can do. DAC (Data Abstraction Coupling) was proposed by Li and Henry in 1993, attempting to capture a rather different notion of coupling [10]. CF (Coupling Factor) belongs to the MOOD set of object-oriented measures developed by Abreu and colleagues. As with CBO, CF defines the variable accessing and method invocation between two classes as coupling but inheritance is ignored.
Cohesion specifies the similarity of methods in a class. It is a measure of the extent to which the various functions performed by an entity are related to one another. Lack of cohesion indicates the class can be divided into two or more subclasses. The intuitive notion of cohesion is the extent to which the modules that make up a system are cohesive. The obvious way to assess this is to consider whether the methods of a class access
similar sets of instance variables. Table II summarizes the characteristics of the cohesion metrics used in the comparative study. Most of the metrics take account of reference and invocation relation between methods.
TABLE II. COHESION METRICS
Name Definition LCOM
[5]
Number of non-similar method pairs in a class of pairs. A method is deemed to be similar to another method if they use (by referencing) one or more attributes in common.
LCOM3 [8]
Number of connected components in graph whose vertices are methods and whose edges link similar methods.
RLCOM [11]
Ratio of number of non-similar method pairs to total number of method pairs in the class.
TCC [2] Ratio of number of similar method pairs to total number of method pairs in the class.
LCOM (Lack of Cohesion in Methods) belongs to the CK suit. It was later modified to include subtraction of the number of similar method pairs (LCOM2). If the subtraction is negative, LCOM2 is set to zero [6]. LCOM2 is not used in the empirical study because it cannot distinguish software very well by giving them cohesion value as zero. LCOM and LCOM2 do not consider the method of invocation. Li proposed RLCOM [11] in 2000. It is an alternative modification of LCOM in which the number of non-similar method pairs is divided by the total number of method pairs.
In 1995, Hitz and Montazeri [8] proposed a cohesion metrics (LCOM3). Although presented as an improved LCOM, it is a more radical modification. It presents the relationship between methods of a class in an undirected graph. Methods of a class are the vertices. If two methods use at least one attribute in common, there is an edge between two corresponding vertices. It should be noted that LCOM, LCOM3, and RLCOM are in fact measures of lack of cohesion.
TCC, in contrast to other metrics, measure cohesion rather than its absence. TCC (Tight class cohesion) was proposed by Bieman and Kang in 1995 [2]. Besides methods using (by referencing) common attributes, these measures also consider invocation between methods. If a method m invokes another method n, all attributes used in method n would be used by method m as well. Two methods are called connected if they use (by referencing or invoking) common attributes.
run time information in the context of assessing components retrieved by an Internet search engine. B. Limitations
Three limitations of established metrics were identified. • First, most of the static metrics discussed above treat
coupling and cohesion as an intransitive relation that is, they only consider direct coupling between classes and direct similarity between methods. Suppose Class A is coupled to Class B, which is in turn coupled to Class C, but there is no direct coupling between Class A and Class C. Clearly a change in Class C may have consequences for Class A because of the indirect coupling through Class B. The indirect similarity between two methods is similar to the indirect coupling between two classes. Although one of the cohesion metrics LCOM3 has suggested extensions to incorporate indirect relationships between methods. It treats indirect and direct cohesion in the same way and cannot numerically specify the indirect and direct cohesion.
• Second, both CBO and CF treat coupling between one class and another as an all-or-nothing quantity; classes are either coupled or they are not. No account is taken of the extent to which one class is dependent on another. If a class has many interactions with another, it is much more likely that a change in one will have consequences for the other than would be the case if their coupling rested on a single interaction. All of discussed cohesion measurements also treat cohesive relation between methods as binary feature. All of the metrics lack of quantitative assessments.
• Third, none of the coupling metrics takes any account of the functional complexity of the class whose coupling is being assessed. Other things being equal, a class that provides a wide range of functionality is likely to have more interactions with other classes than one that is very simple. A metric that assesses the extent of coupling between classes should take account of this. El Emam, Benlarbi and Goel [19] have presented evidence that the correlations between fault-proneness and several metrics, including RFC and CBO, disappear if the analysis controls for class size. For cohesion metrics, except RLCOM and TCC, none of other metrics takes any account of the functional complexity of the method. A metrics that is trying to assess the similarity between methods should take account of this. Some researches have suggested that validation studies should therefore control for size of class and method. We have chosen to avoid the need for this by developing coupling and cohesion metrics that are independent of class or method size/complexity.
III. PROPOSED COUPLING AND COHESION METRICS
A pilot study, using the metrics described in section II was carried out. They were selected, as representative of
the much larger range described in the literature, largely on the basis of how frequently they were referred to in later publications. The results suggested that none was very effective in ranking the reusability of Java components. We therefore decided to develop alternative coupling and cohesion metrics in the hope of achieving superior performance. Since all the metrics treated class interaction and method similarity as binary quantities, one obvious step was to develop measures that reflected the extent to which a pair of classes was coupled or a pair of methods resembled each other. Because none of the measures treated coupling or similarity as transitive relations, we decided that such indirect dependencies should be incorporated into the new metrics. We also take account of the functional complexity of the classes and the methods in the proposed metrics.
A. Proposed Coupling Metrics
In order to develop a coupling metric that takes account of the degree of coupling, functional complexity and transitive (i.e indirect) coupling between classes, we begin by regarding any object-oriented software system as a directed graph. The classes comprising the system are the vertices in the graph. Suppose such a system comprises a set of classes C ≡ {C1, C2,…Cm}. Let Mj be
the set of methods of the class Cj, and Vj be the set of
instance variables of class Cj . MVj,i is the set of methods
and instance variables in class Ci invoked by class Cj for j
≠ i (MVjj is defined to be null). Then the edge from Cj to
Ci exists if and only if MVj,i is not null. Thus an edge of
the graph reflects the direct coupling of one class to another. The graph is directed since MVj,I is not
necessarily equal to MVi,j . MVj, the set of all methods and
instance variables in other classes that are invoked by class Cj, can be defined:
, 1
j j i
i m
MV MV
≤ ≤
≡
U
The number of methods and variables in the set MVi,j
(⎢MVi,j ⎢) reflects the extent of direct coupling from class
Ci to class Cj. It should be larger if the class invokes more
of the other’s methods. However, this number should also reflect the fact that a class that invokes many methods has a greater likelihood of invoking methods from any particular class. Therefore, CoupD(i,j), the measure of direct coupling of class Ci to Cj, is defined as
( )
,, i j
i i i
MV CoupD i j
MV V M
=
+ +
Note that the denominator is the total number of methods used by class Ci, that is the total functionality of
class Ci. This guarantee the CoupD(i,j) is independent of
class size. 1 ≥ CoupD(i,j) ≥ 0. CoupD(i,j) will always be less than one because the extreme value would only be achieved in the extremely unusual case of a class with no members that was coupled to only one other class.
have finite values but that CoupD(i,k) is zero. Thus although there is no direct coupling between classes Ci
and Ck, there is a dependency because Ci invokes
methods in Cj which in turn invokes methods in Ck. Since
the strength of this dependency depends on the two direct couplings of which it is composed, a reasonable measure is provided by their product, CoupD(i,j) × CoupD(j,k). This notion is readily generalised. A coupling between two classes exists if there is a path from one to the other made up edges whose CoupD values are all non-zero. The strength of the coupling is the product of all those CoupD values. Thus we define CoupT(i,j,p), the transitive coupling between classes Ci and Cj due to a specific path
p, as
( )
,
,
,
( , , ) ,
es t p
s t
es t p s s s
CoupT i j p CoupD s t
M
MV
MV V
∈
∈
=
=
+ +
∏
∏
es,t denotes the edge between vertices s and t. Note first
that CoupT represents the direct coupling CoupD as well, which corresponds to path of length one, and second that, because the CoupD values are necessarily less than one, transitive couplings due to longer paths will typically have lower values.
In general there may be more than one path having a non-zero CoupT value between any two classes. This raises the question of how their values may be combined to produce an overall measure of the coupling between the classes. One approach would be to develop some method of adding their values but this raises a number of complications such as how to deal with the fact that some of the paths will have edges in common. While solutions to these difficulties may exist, a simpler pragmatic approach is to simply select the path with largest CoupT value and hence define Coup(i,j), the strength of coupling between the two classes, Ci and Cj to be:
max
( , ) ( , , ( , ))
Coup i j =CoupT i j p i j
where pmax( , ) arg maxi j = p∈ΠCoupT i j p( , , ) and Π is the set of all paths from Ci to Cj. Because of the
attenuation of coupling over longer paths, where a direct coupling exists, the value of maximum CoupT will typically, but not necessarily, be CoupD. While there are obvious objections to ignoring the other weaker couplings, the ultimate test of this method is whether it is effective. The results reported later in this paper suggests that this simple approach is adequate.
Having established a measure for the strength of coupling between pairs of classes, the final step is to use this as a basis for a measure of the total coupling of a software system. This is readily achieved by summing all the couplings of all class pairs and dividing by the total number of such pairs. The weighted transitive coupling (WTCoup) of a system is thus defined
, 1
2
( , )
m
i j
Coup i j WTCoup
m m
=
=
−
∑
where m is the number of classes in the system. An intransitive counterpart of WTCoup, in which only direct coupling is considered, is defined as
, 1
2
( , )
m
i j
CoupD i j WICoup
m m
=
=
−
∑
Note that, like the measures developed earlier in this section, the values of both WTCoup and WICoup fall in the range 0…1. (Both measures are defined to be zero for the trivial case of a system comprising only one class).
B. Proposed Cohesion Metrics
Like the measures already discussed, our proposed metrics of class cohesion is based on the notion of method similarity. Methods are said to be similar if the sets of instance variables that they access overlap. As with the coupling measure, we consider the methods of a class are the vertices of a graph. Suppose a class has a set of method members M ≡ { M1, M2,…Mm} and let Vj≡
{Vj,1, Vj,2, …. Vj,n} be the instance variables accessed by
method Mj (includes referencing and invocation). Then
the edge from Mj to Mi exists if and only if Vj ∩ Vi is not
null. Thus an edge of the graph reflects the direct similarity of the methods in that they have at least one instance variable in common. In contrast to the coupling graph, the similarity graph is undirected because intersection is a symmetric relation.
The next step is to associate a number with each edge that reflects the extent to which the two methods have instance variables in common. SimD(i,j), the proposed measure of direct similarity of two methods, Mi and Mj, is
defined as
( )
, i ji j
V V
SimD i j
V V
∩ =
∪
where i ≠ j (SimD(j,j) is defined to be zero). The denominator is the total number of variables used in two methods and the numerator is the common variables shared by two methods. The denominator is the total functionality of method Mi and Mj.. Thus SimD(i,j) is
independent of method size. Note that 1 ≥ SimD(i,j) ≥ 0. The extreme value 1 would only be achieved when two methods use the same variables.
The extension of the measure to include indirect similarity proceeds along the same lines as we employed for indirect coupling. The strength of similarity provided by a path between two methods is the product of the SimD values of the edges that make up the path. Thus, SimT(i,j,p), the transitive similarity between methods Mi
and Mj due to a specific path p, is defined as
( )
, ,
( , , ) , s t
s t
es t p es t p
V V
SimT i j p SimD s t
V V
∈ ∈
∩
= =
∪
where es,t denotes the edge between vertices s and t. As
in the case of coupling, the path with the highest SimT value is selected to define the similarity of the two methods, Sim(i,j).
max
( , ) ( , , ( , ))
Sim i j =SimT i j p i j
where pmax( , )i j =arg maxp∈ΠSimT i j p( , , )
and Π is the set of all paths from Mi to Mj.
This measure is used to provide a measure of the cohesion of the class, ClassCohT, by summing the similarities of all method pairs and dividing by the total number of such pairs:
, 1
2
( , )
m
i j
Sim i j ClassCohT
m m
=
= −
∑
where m is the number of methods in the class. An intransitive couterpart of ClassCohT, in which only direct cohesion is considered, is defined as
, 1
2
( , )
m
i j
SimD i j ClassCohD
m m
=
=
−
∑
where m is the number of methods in the class.
Finally, the weighted transitive cohesion and intransitive cohesion of the complete software system, WTCoh and WICoh are defined as the mean cohesion of all the classes of which it is comprised:
1 n
j j
ClassCohT WTCoh
n
=
=
∑
1 n
j j
ClassCoD WICoh
n
=
=
∑
where n is the number of classes in the system. Note that, the values of both WTCoh and WICoh fall in the range 0…1.
IV. EXPERMENTS ON COMPARING THE RELIABILITY OF
METRICS
The real test of any software metric is empirical evaluation; unfortunately this presents a number of methodological difficulties. Consequently most existing metrics rest on only modest experimental support. In carrying out the present study, the metrics were intended to serve a very specific purpose: ranking components retrieved from the Internet according to how likely they were to be fault free and how much effort would be necessary to adapt them for use within a larger system.
In view of the existing empirical support for the view that coupling and cohesion metrics are positively correlated with fault-proneness. Essentially all that is required is to take a set of components and ask competent programmers to adapt them for use in larger systems. The correlation between these metrics and the effort required
by the programmers will indicate the success of the former in predicting the latter. This experimental study is therefore concerned with evaluating the metrics as predictors of the adaptation effort required.
A. Experiment Task
In the experimental study, the programmer was required to make simple extensions to Java components retrieved using our component search engine [1]. All had been identified as having appropriate functionality by the search engine and this was confirmed by inspection before the start of the experiment. There were three case studies, each involving the modification of between 20 and 25 components:
z Case 1: HTML Parser (20 components)
Original components: analysed HTML documents, eliminated tags and comments and output the text.
Required extension: count and output the number of tags found during parsing.
z Case 2: Lexical Tokeniser (25 components)
Original components: tokenised a text document using user supplied token rules and output the tokens.
Required extension: count and output the number of tokens retrieved.
z Case 3: Barcode (20 components)
Original components: accepted a sequence of alphanumeric characters and generated the corresponding barcode.
Required extension: count and output the number of letters.
All three component groups included web based user interfaces. There was considerable variation in component size within each group (see Table III). In total, the 65 components contained 1974 classes.
TABLE III.
MEAN VALUES OF NUMBER OF LINES OF CODE AND FILE SIZE FOR COMPONENTS IN EACH GROUP.
Component Group Lines of Code Jar File Size HTML
Parser
1094 78K
Lexical Tokeniser 1348 87K Barcode Generator 2213 161K
The requisite modifications to the 65 components were then carried out by a single experienced Java programmer. There would have been advantages in replicating the study several times using other programmers but, because the process is exceedingly time consuming (the experiment reported took over 70 hours of the programmer’s time), available resources did not permit this.
indicative of what would be found on a wider range of components and modifications. This could only be addressed by an appreciably larger study, which would require lots of resources. Ultimately we expect that our system will be tested in practical use as part of a component search system and feedback from users will provide an indication of the how good the quality ranking metrics are.
A. Measure of Programmer Effort
There are two obvious indications of the amount of effort required to adapt a component: the number of changes made to the original code and the time required carrying them out. Both of these were recorded. The number of changes was defined to be the number of lines of code (NLOC) that were added, deleted or modified; the time required was simply the time in minutes taken to determine and carry out the requisite changes.
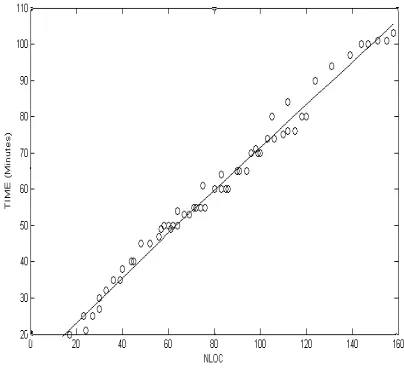
Time would appear to be a better measure of the overall effort entailed but is subject to both random and systematic variations due to programmer fatigue, task learning, interruptions, and other external factors. These could only be eliminated by conducting the experiments under unfeasibly highly controlled conditions. Consequently, NLOC was expected to prove a more robust measure. However, a scatter gram of the results obtained on the 65 components reveals an almost perfect linear relationship between NLOC and time (Pearson correlation = 0.991) see figure 1. Hence either measure would yield very similar results. In this paper, we focus on the correlations of NLOC with coupling and cohesion metrics.
Figure 1: The linear relationship between NLOC and time spent to modify 65 components
About 6000 lines of code were changed for the 65 components considered in the experiment. Despite the relative simplicity of the extensions, there was considerable variation in the quantity of extra code required, as shown in Table IV.
Having established a measure of the reusability of the components, we then proceeded to investigate how successful the various measures of coupling and cohesion are in predicting this quantity. Six measures of coupling
(our proposed measure WTCoup and its transitive version WICoup CF [3], CBO [4], RFC [4] and DAC [10]) and five measure of cohesion (our proposed measure WTCoh and its transitive version WICoh, RLCOM [11], LCOM [4], LCOM3 [8] and TCC [1]) were calculated. The data obtained for the 12 coupling measures and cohesion measures when applied to the retrieved three groups of components are shown in Table V.
TABLE IV.
NUMBER OF LINES OF CODE (NLOC) REQUIRED TO MODIFY COMPONENTS
Cases Mean Min Med Max Std Dev HTML Parser 116.3 58 124 158 34.2 Lexical Tokeniser 62.2 17 61 110 26.4 Barcode Generator 74.1 24 74 120 30.3
Where metrics were defined for classes rather than complete systems, the average value for all the classes in the system was used in the experiment. The scope of measures is various. WTCoup, WICoup, WTCoh, WICoh, CF, RLCOM, TCC are in (0, 1) because all of them normalised by the total number of attributes in the objects. On the other hand, CBO, RFC, LCOM1, LCOM3 are in the scope (1, +∞) because they only count the number of interacted objects. In order to facilitate presentation of the results on the same graph, those measures that do not necessarily produce values in the range (0, 1) were divided by the maximum value 100 to produce values of comparable magnitude. Each measure has enough variance to distinguish the components. The consistent data is observed in all three cases. Therefore, they are effective to be used in analysis procedure.
TABLE V.
DESCRIPTIVE STATISTICS DATA FOR COUPLING AND COHESION MEASURES
Measure Mean Med Max Min StdDev WTCoup 0.29 0.314 0.37 0.14 0.065 WICoup 0.27 0.306 0.4 0.11 0.08
CF 0.32 0.36 0.425 0.18 0.06 CBO 21.05 16 57 6 14.20
RFC 53.73 50 92 18 17.51
DAC 17 18 35 7 0.075 WTCoh 0.316 0.32 0.46 0.21 0.052
WICoh 0.3 0.31 0.44 0.17 0.076 RLCOM 0.26 0.24 0.55 0.045 0.118
LCOM 25.98 26 48 10 8.05
LCOM3 65.19 64 100 34 17.33 TCC 0.30 0.31 0.433 0.146 0.071
IV. EXPERMENTS RESULTS
A. Spearman Rank Correlation
Since the objective is to find a metric that will rank components according to the amount of effort likely to be required for modification, we therefore computed the Spearman rank correlation coefficients [15] between the rankings determined by NLOC and those produced by the various coupling and cohesion measures (Tables VI and VII).
TABLE VI.
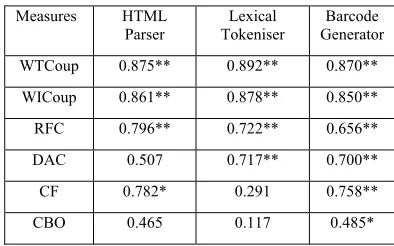
SPEARMAN RANK CORRELATIONS OF COUPLING MEASURES AGAINST NLOC.** DENOTES SIGNIFICANT AT 1% LEVEL;* DENOTES
SIGNIFICANT AT 5% LEVEL. Measures HTML
Parser
Lexical Tokeniser
Barcode Generator WTCoup 0.875** 0.892** 0.870**
WICoup 0.861** 0.878** 0.850** RFC 0.796** 0.722** 0.656** DAC 0.507 0.717** 0.700**
CF 0.782* 0.291 0.758** CBO 0.465 0.117 0.485*
Table VI shows the results obtained for the coupling metrics. The order in which they appear in the table is determined by their average performance over all three component groups. The majority were statistically significant, many of them at the 1% level. Nevertheless there are considerable differences in the degree of correlation achieved. The two proposed new coupling measures, WTCoup and WICoup, perform consistently better than all the other metrics for all three component groups. Furthermore, WTCoup, which takes indirect coupling into account, performs consistently better than WICoup, which only considers direct coupling, and achieves a very high degree of correlation. The best of the established metrics appear to be RFC, which, as noted above, is not a pure coupling measure since it includes the class’s own methods. CBO performed very poorly for all three component groups.
Table VII shows the results obtained for the cohesion metrics. It should be noticed that LCOM, LCOM3, and RLCOM are measures of lack of cohesion. They are inversely proportionate to cohesion and hence should be in direct proportion to the effort required to modify a component. Thus the Spearman rank correlations of these measurements against NLCO are positive values while the Spearman rank correlations of other measures should be negative values. In order to compare the correlations of different metrics in one table, the absolute value of correlation is used. The order in which they appear in the table is determined by their average performance over all three component groups. Similar to the coupling measurements, the majority were statistically significant, many of them at the 1% level. Nevertheless there are considerable differences in the degree of correlation achieved. The two proposed new cohesion measures, WTCoh and WICoh, perform consistently better than all the other metrics for all three component groups.
Furthermore, the measurement WTCoh that considers intransitive cohesion relations performs better than the associated measurements that do not consider intransitive cohesion (WICoh). The measurements that include invocation relations (WTCoh, WICoh TCC) perform better than other measurements that do not consider invocation relations. RLCOM and TCC perform better than LCOM3 and LCOM, which indicates that the size of the methods could affect the performance of measurements. It is clear that WTCoh performs consistently better than all other measurements and LCOM performs poorly in each case.
TABLE VII.
SPEARMAN RANK CORRELATIONS OF COHESION MEASURES AGAINST NLOC.** DENOTES SIGNIFICANT AT 1% LEVEL;* DENOTES
SIGNIFICANT AT 5% LEVEL. Measures HTML
Parser Tokeniser Lexical Generator Barcode WTCoh 0.893** 0.885** 0.890**
WICoh 0.882** 0.841** 0.852** TCC 0.522** 0.757** 0.831** RLCOM 0.342** 0.787** 0.700** LCOM3 0.808** 0.830** 0.100
LCOM 0.218* 0.005 0.508**
B. Linear Regression
These Spearman ranking correlation results suggest that WTCoup and WTCoh appear to be the best metrics for ordering components according to the modification effort they are likely to require. However, it is possible that their superior performances are of no practical significance. For example, it could be the case that they achieve such high rank correlations only because they are better at correctly ordering items that in fact differ very little in the amount of effort they require for modification. If this were the case, then the other metrics could be just as effective in allowing users to choose components that can be readily modified.
In order to address this possibility, it is necessary to consider how effective the various metrics are in predicting the amount of modification effort required. The Pearson linear regression analysis was adopted in the study. Table VIII shows the values of the coefficient of determination (R2) obtained when NLOC is regressed
against each of the six coupling metrics. R2 expresses the
proportion of the variance in NLOC that is explained by the metric.
The results are similar to those obtained in rank correlation. The new metrics, WTCoup and WICoup are the best predictors of the amount of modification effort required, and the transitive measure that takes account of indirect coupling outperform its intransitive counterpart. RFC is the best of the established coupling metrics. Most of the R2 values are highly significant, indicating that the
TABLE VIII.
VALUES OF THE COEFFICIENT OF DETERMINATION (R2)
OBTAINED WHEN NLOC IS REGRESSED ON THE COUPLING METRICS.** DENOTES
SIGNIFICANT AT 1% LEVEL. Measures HTML
Parser
Lexical Tokeniser
Barcode Generator WTCoup 0.806** 0.811** 0.788**
WICoup 0.792** 0.788** 0.754** RFC 0.713** 0.729** 0.534** DAC 0.254 0.738** 0.507**
CF 0.621** 0.098 0.693** CBO 0.259 0.004 0.121
Table IX shows the values of the coefficient of determination (R2) obtained when NLOC is regressed
against each of the six cohesion metrics. The results are similar to those obtained in rank correlation; the two new metrics WTCoh and WICoh are the best predictors of the amount of modification effort required. The metrics considering transitive cohesion relationship is always superior to its transitive counterpart in three cases. TCC and RLCOM are the best of the established metrics.
TABLE IX.
VALUES OF THE COEFFICIENT OF DETERMINATION (R2) OBTAINED WHEN
NLOC IS REGRESSED ON THE COHESION METRICS.** DENOTES SIGNIFICANT AT 1% LEVEL.
Measures HTML Parser Lexical
Tokeniser Generator Barcode WTCoh 0.817** 0.808** 0.812**
WICoh 0.767** 0.798** 0.8**
TCC 0.319 0.783** 0.702**
RLCOM 0.178 0.646** 0.758**
LCOM3 0.564** 0.709** 0.101
LCOM 0.095 0.02 0.177
C. Multiple Regression
The results obtained from linear regression and ranking regression indicate that either WTCoup or WTCoh is a good predictor. However, it is worth considering whether a linear combination might produce even better results. Table X shows the values of the coefficient of determination (R2) obtained when NLOC is regressed
against both WTCoh and WTCoup. These are superior to the results produced by each metric alone but not by a great margin simply because the original results leave only modest scope for improvement. Developing such a composite quality measure would entail assuming the relative weighting of the two metrics should be the same for all types of component. The results indicate that although the methodology is simple but it performs quite well. Thus, at this stage, it is unnecessary to consider different weighting of the two metrics or more complicated combination.
TABLE X.
VALUES OF THE COEFFICIENT OF DETERMINATION (R2)
AND SPEAR MAN RANK CORRELATION OBTAINED WHEN NLOC IS REGRESSED ON THE COMBINATION OF WTCOH AND WTCOUP.** DENOTES SIGNIFICANT AT
1% LEVEL.
HTML Parser Tokeniser Lexical Generator Barcode
R2 0.91** 0.92** 0.86**
Spearman rank correlations
0.95** 0.96** 0.93**
IV. DISCUSSION
These results clearly demonstrate that the proposed metrics for coupling and coherence are very good predictors of the effort required to make simple modifications to Java components retrieved from the Internet. They perform better than all of other established metrics used in the study. Furthermore, they demonstrate that, for this predictive task, both these metrics are superior to any of the alternative established that we tested in the experiment. In this concluding section we first consider the contributions of the proposed metrics. Then we assess whether they are adequate for the purpose for which they were developed: producing a reusability ranking for components retrieved from the Internet. Finally we consider whether the results may be of relevance to other applications of software metrics.
A. Contribution and Possible Improvement
Both our proposed measures share three significant characteristics in the way they measure relationships between pairs of entities. First, they are weighted; that is, they use a numeric measure of the degree of coupling or similarity between entities rather than a binary quantity. Second they are transitive; that is, they include indirect coupling or similarity mediated by intervening entities. Third, they take into account of the functional complexity of classes and methods as a normalizing factor in assessing the extent of the relation.
The methodology used, in both our metrics, to determine the strength of indirect relationships when a pair of vertices was linked by multiple paths was crude though effective: we simply chose the strength indicated by the strongest path. The consequence of this is that indirect relationships may be underestimated. It would be possible to remedy this by aggregating the weights contributed by all possible paths between two vertices. However, in view of the fact using only the largest works well, we see no reason to make such a change.
B. Adequacy for Component Ranking.
reasonable to assume that NLOC is itself a good indicator of how readily a component may be adapted for use in a larger software system.
It could be argued that the modifications used in our study were of a broadly similar nature and therefore may not be indicative of what would be found on a wider range of components and modifications. This is a legitimate objection that could only be addressed by an appreciably larger study. The present investigation involved modifying 60 programs and hence represents a substantial effort. A further criticism might be that all the modifications were carried out by one programmer; other programmers might have produced different results. Again this is a fair objection that could only be remedied by a larger scale study.
C. Wider Implications
This work arose from, and is intended primarily as a contribution to, search engine technology. Nevertheless, we believe it may be of interest to a wider body of researchers: in particular, those involved in developing and evaluating software metrics. The majority of coupling and cohesion metrics treat coupling and similarity as simple binary quantities. Our results suggest that a numeric representation of the degree of the relationship leads is advantageous. Transitive dependencies have received relatively little attention in the literature. Our findings suggest that coupling and coherence metrics may be improved by their inclusion.
Our methodology may also be of interest to those engaged in evaluating software metrics. Empirical evaluations are difficult in this field, largely because it is difficult to obtain suitable material for carrying out systematic studies. Because our study was carried out as part of the development of a component search engine, we were in the happy position of being able to access significant numbers of independently developed programs that had essentially similar functionality. The approach of implementing the same small change to all of them enables a substantial number of comparable data points to be assembled for use in evaluations.
ACKNOWLEDGMENT
We are grateful to the four UK higher education funding bodies (for England, Scotland, Wales and North Ireland) for an oversea research studentship (ORS/2002015010) awarded to G. Gui.
REFERENCES
[1] Gui, G. and Scott, P. D. Vector Space Based on Hierarchical Weighting: A Component Ranking Approach to Component Retrieval. In Proceedings of the 6th International Workshop on Advanced Parallel Processing Technologies (APPT’05)
(Hong Kong, China, Oct 2005).
[2] Bieman, J. M. and Kang, B-Y. Cohesion and Reuse in an Object-Oriented System. In Proc. ACM Symposium on Software Reusability (SSR’95). (April 1995) 259-262. [3] Briand, L., Devanbu, P. and Melo, W. An investigation into
coupling measures for C++. Proceedings of ICSE 1997, (Boston, USA, 1997).
[4] Brito e Abreu, F. and Melo, W. Evaluating the impact of OO Design on Software Quality. Proc. Third International Software Metrics Symposium. (Berlin 1996).
[5] Chidamber, S. R. and Kemerer, C. K. Towards a Metrics Suite for Object Oriented Design. Proceedings of 6th ACM Conference on Object Oriented Programming, Systems, Languages and Applications (OOPSLA’91), (Phoenix, Arizona, 1991), 197-211.
[6] Chidamber, S. R. and Kemerer, C. K. A Metrics Suite for Object Oriented Design. IEEE Transactions on Software Engineering, Vol. 20 (June 1994), pp.476-493.
[7] Harrison, R., S.J.Counsell, and R.V.Nith. Evaluation of the MOOD Set of Object-Oriented Software Metrics. IEEE Transactions on Software Engineering, Vol. 24 (June 1998), 491-496.
[8] Hitz, M. and Montazeri, B. Measuring coupling and cohesion in object-oriented systems. Proceedings of International Symposium on Applied Corporate Computing. (Monterrey, Mexico, 1995).
[9] Kanmani, S., Uthariraj, R., Sankaranarayanan, V. and Thambidurai, P. Investigation into the Exploitation of Object-Oriented Features. ACM Sigsoft, Software Engineering Notes, Vol. 29 (March 2004).
[10] Li, W. and Henry, S. Object-Oriented metrics that predict maintainability. Journal of Systems and Software. 23(2) 1993 111-122.
[11] Li, X., Liu, Z. Pan, B. and Xing, B. A Measurement Tool for Object Oriented Software and Measurement Experiments with It. In Proc. IWSM 2000. (Lecture Notes in Computer Science 2006, Springer-Verlag, Berlin, Heidelberg, 2001), 44-54
[12] Subramanyam, R. and Krishnan, M. S. Empirical Analysis of CK Metrics for Object-Oriented Design Complexity: Implications for Software Defects. IEEE Transactions on Software Engineering, Vol. 29 (April 2003), 297-310 [13] Y.-S.Lee, B.-S.Liang, S.-F.Wu, F.-J.Wang, Measruting the
coupling and Cohesion of an Object-Oriented Program Based on Information Flow, In Proc. International Conference on Software Quality, Maribor, Slovenia, 1995. [14] H. Washizaki, Y.Yamamoto and Y. Fukazawa. Software
Component Metrics and It's Experimental Evaluation, In
Proc. of International Symposium on Empirical Software Engineering (ISESE2002), Vol.II (2002).
[15] S.D.Conte, H.E.Dunsmore and V.Y.Shen, Software Engineering Metrics and Models Benjamin-Cummings Publishing Co., Inc.
[16] D.Kung, j. Gao, P.Hsia, F.Wen, Y.Toyoshima, C.Chen, Change Impact Identification in Object-Oriented Software Maintenance, In Proc. Conf. Software Maintenance, 202-211, 1994.
[17] Briand, L., Daly. J ,Porter. V, Wust.J. A Comprehensive Empirical Validation of Product Measures for Object-Oriented System, Technical Report ISERN-98-07,1998. [18] N. Fenton, "Software Measurement: A Necessary Scientific
Basis,” In IEEE Trans. Software Eng., vol. 20, no. 3, 199-206, March 1994.