http://www.sciencepublishinggroup.com/j/ajce doi: 10.11648/j.ajce.s.2018060301.11
ISSN: 2330-8729 (Print); ISSN: 2330-8737 (Online)
Modelling of Plain Cement Concrete Pavement Patch Using
ANSYS Workbench
Shrikant Madhav Harle
1, Prakash Pajgade
21
Department of Civil Engineering, Professor Ram Meghe College of Engineering and Management, Badnera, India
2Department of Civil Engineering, Professor Ram Meghe Institute of Technology and Research, Badnera, India
Email address:
[email protected] (S. M. Harle), [email protected] (P. Pajgade)
To cite this article:
Shrikant Madhav Harle, Prakash Pajgade. Modelling of Plain Cement Concrete Pavement Patch Using ANSYS Workbench. American Journal of Civil Engineering. Special Issue: Research and Development in Concrete Pavement. Vol. 6, No. 3-1, 2018, pp. 1-8. doi: 10.11648/j.ajce.s.2018060301.11
Received: March 31, 2017; Accepted: April 5, 2017; Published: April 11, 2017
Abstract:
The concrete roads have many advantages as compared to the flexible pavement. The durability, Strength and life are the main characteristics of good road. In the developing countries like India, the flexible roads are deteriorated very easily due to heavy loads of the vehicles. It is important to construct the durable roads and there should not be necessity of maintenance after short span. Therefore it is also important to know the stresses and strains coming out on the concrete pavement due to different loads of vehicles. The present paper has consider these aspects using analysis in finite element software i.e. ANSYS workbench. The present paper has describes the deformation, maximum stress and maximum strain. From the results it has been shown that the maximum stress has occurred at the top surface of the model.Keywords:
Concrete Pavement, ANSYS, Stress, Strain and Deformation1. Introduction
Now days the cement concrete pavement is becoming popular as it has many advantages as compared to bituminous or asphalt pavement. The study of the concrete pavement to minimize the stresses and cracks occurred due to moving or dynamic loads are the main issue of this research work.
Almost all rigid pavements are made up of Portland Cement Concrete (PCC), typically consisting of PCC surface course constructed over either the subgrade or base course over subgrade. The PCC course is the stiffest and provides majority of strength to the pavement. The base course and the subgrade provide drainage and frost protection to the pavement and also contribute to the strength. Rigid pavements can be classified into three major categories:
a) Jointed plain concrete pavement (JPCP): In JPCP, the pavement is divided into individual slabs separated by contraction joints using dowels (for load transfer) and tie bars
to connect adjacent slabs. This is the most common type of rigid pavement.
b) Jointed reinforced concrete pavement (JRCP): This type of pavement is similar to JPCP except that these slabs are much longer and are reinforced to withstand expansion and contraction due to temperature and moisture. The JRCP type is associated with long term performance problems and is not commonly used in the US.
c) Continuously reinforced concrete pavement (CRCP): In this type of rigid pavement the slabs are reinforced and continuous without any joints except construction joints.
2. Methodology
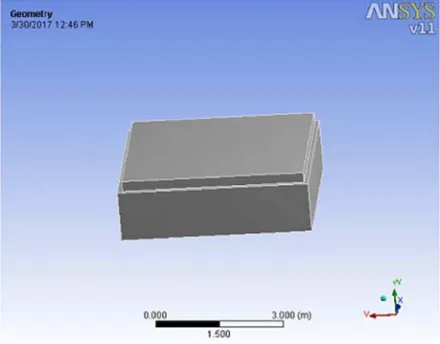
Figure 1. Geometry of the model.
Table 1. Units.
Unit System Metric (m, kg, N, °C, s, V, A)
Angle Degrees
Rotational Velocity rad/s
Table 2. Geometry of the Model.
Object Name Geometry
State Fully Defined
Definition
Source Unnamed.agdb
Type DesignModeler
Length Unit Millimeters
Element Control Program Controlled
Display Style Part Color
Bounding Box
Length X 4.5 m
Length Y 1.4436 m
Length Z 4. m
Properties
Volume 25.566 m³
Mass 58803 kg
Statistics
Bodies 37
Active Bodies 1
Nodes 14011
Elements 8142
Preferences
Import Solid Bodies Yes
Import Surface Bodies Yes
Import Line Bodies Yes
Parameter Processing Yes
Personal Parameter Key DS
CAD Attribute Transfer No
Named Selection Processing No
Material Properties Transfer No
CAD Associativity Yes
Import Coordinate Systems No
Reader Save Part File No
Import Using Instances Yes
Do Smart Update No
Attach File Via Temp File No
Analysis Type 3-D
Mixed Import Resolution None
Table 3. Model Geometry parts.
Object Name Solid
State Meshed
Graphics Properties
Visible Yes
Transparency 1
Definition
Suppressed No
Material Concrete
Stiffness Behavior Flexible
Nonlinear Material Effects Yes
Bounding Box
Length X 4.5 m
Length Y 1.4436 m
Length Z 4. m
Properties
Volume 25.566 m³
Mass 58803 kg
Centroid X 2.2488 m
Centroid Y 0.71199 m
Centroid Z 2. m
Moment of Inertia Ip1 87240 kg·m²
Moment of Inertia Ip2 1.7501e+005 kg·m²
Moment of Inertia Ip3 1.0781e+005 kg·m²
Statistics
Nodes 14011
Elements 8142
Table 4. Model Geometry Body parts.
Object Name Rebar
State Suppressed
Graphics Properties
Visible No
Definition
Suppressed Yes
Material Structural Steel
Bounding Box
Length X 4.1629 m
Length Y 0. m
Length Z 3.5 m
Properties
Volume 0. m³
Mass 0. kg
Statistics
Nodes 0
Elements 0
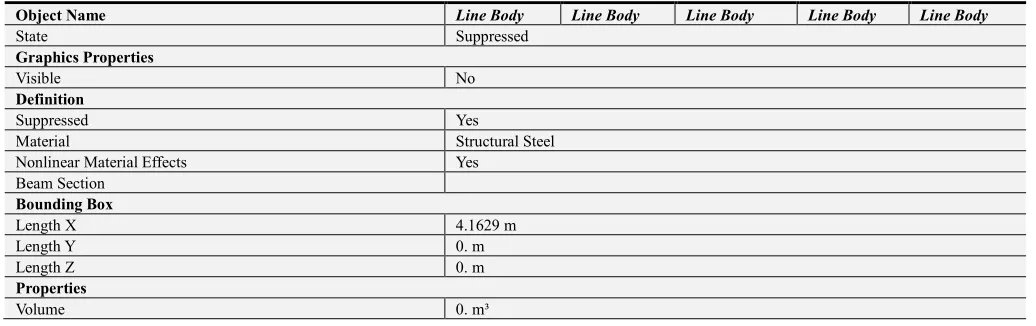
Table 5. Model Geometry Rebar Parts.
Object Name Line Body Line Body Line Body Line Body Line Body
State Suppressed
Graphics Properties
Visible No
Definition
Suppressed Yes
Material Structural Steel
Nonlinear Material Effects Yes
Beam Section
Bounding Box
Length X 4.1629 m
Length Y 0. m
Length Z 0. m
Properties
Object Name Line Body Line Body Line Body Line Body Line Body
Mass 0. kg
Length 4.1629 m
Cross Section Area Cross Section IYY Cross Section IZZ
Statistics
Nodes 0
Elements 0
Table 6. Model Connections.
Object Name Connections
State Fully Defined
Auto Detection
Generate Contact On Update Yes
Tolerance Type Slider
Tolerance Slider 0
Tolerance Value 1.5479e-002 m
Same Body Grouping Yes
Transparency
Enabled Yes
Table 7. Model Connections – Contact Regions.
Object Name Bonded - Solid To Solid
State Fully Defined
Scope
Scoping Method Geometry Selection
Contact 1 Face
Target 4 Faces
Contact Bodies Solid
Target Bodies Solid
Definition
Type Bonded
Scope Mode Manual
Suppressed No
Advanced
Formulation Pure Penalty
Update Stiffness Never
Table 8. Model Mesh.
Object Name Mesh
State Solved
Defaults
Physics Preference Mechanical
Relevance 0
Advanced
Relevance Center Coarse
Element Size 0.15 m
Shape Checking Standard Mechanical
Solid Element Midside Nodes Program Controlled
Straight Sided Elements No
Initial Size Seed Active Assembly
Smoothing Low
Transition Fast
Statistics
Nodes 14011
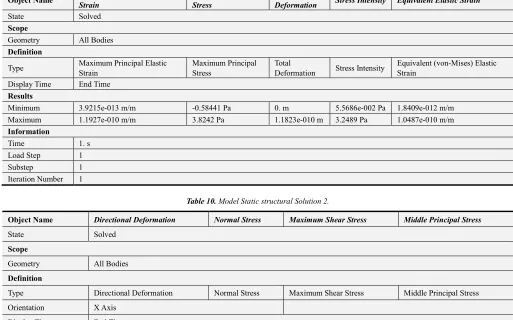
Table 9. Model Static structural Solution 1.
Object Name Maximum Principal Elastic Strain
Maximum Principal Stress
Total
Deformation Stress Intensity Equivalent Elastic Strain
State Solved
Scope
Geometry All Bodies
Definition
Type Maximum Principal Elastic
Strain
Maximum Principal Stress
Total
Deformation Stress Intensity
Equivalent (von-Mises) Elastic Strain
Display Time End Time
Results
Minimum 3.9215e-013 m/m -0.58441 Pa 0. m 5.5686e-002 Pa 1.8409e-012 m/m
Maximum 1.1927e-010 m/m 3.8242 Pa 1.1823e-010 m 3.2489 Pa 1.0487e-010 m/m
Information
Time 1. s
Load Step 1
Substep 1
Iteration Number 1
Table 10. Model Static structural Solution 2.
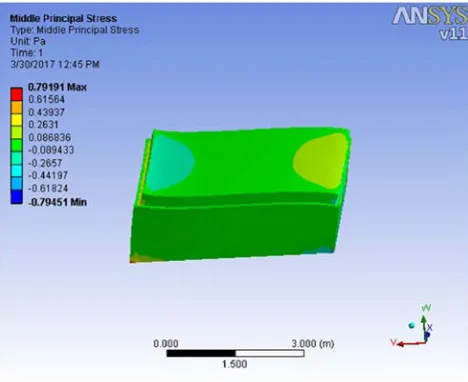
Object Name Directional Deformation Normal Stress Maximum Shear Stress Middle Principal Stress
State Solved
Scope
Geometry All Bodies
Definition
Type Directional Deformation Normal Stress Maximum Shear Stress Middle Principal Stress
Orientation X Axis
Display Time End Time
Results
Minimum -1.0705e-010 m -0.94427 Pa 2.7843e-002 Pa -0.79451 Pa
Maximum 0. m 0.9432 Pa 1.6245 Pa 0.79191 Pa
Information
Time 1. s
Load Step 1
Substep 1
Iteration Number 1
Table 11. Material Data for Concrete.
Structural
Young's Modulus 3.e+010 Pa
Poisson's Ratio 0.18
Density 2300. kg/m³
Thermal Expansion 1.4e-005 1/°C
Tensile Yield Strength 0. Pa
Compressive Yield Strength 0. Pa
Tensile Ultimate Strength 5.e+006 Pa
Compressive Ultimate Strength 4.1e+007 Pa
Thermal
Thermal Conductivity 0.72 W/m·°C
Table 12. Material Data for Structural Steel.
Structural
Young's Modulus 2.e+011 Pa
Poisson's Ratio 0.3
Density 7850. kg/m³
Thermal Expansion 1.2e-005 1/°C
Tensile Yield Strength 2.5e+008 Pa
Compressive Yield Strength 2.5e+008 Pa
Tensile Ultimate Strength 4.6e+008 Pa
Compressive Ultimate Strength 0. Pa
Thermal
Thermal Conductivity 60.5 W/m·°C
Specific Heat 434. J/kg·°C
Electromagnetics
Relative Permeability 10000
Resistivity 1.7e-007 Ohm·m
Table 13. Structural Steel – Strain life parameters.
Strength Coefficient Pa 9.20E+08
Strength Exponent -0.106
Ductility Coefficient 0.213
Ductility Exponent -0.47
Cyclic Strength Coefficient Pa 1.00E+09
Cyclic Strain Hardening Exponent 0.2
3. Results
The following figure shows the behavior of concrete pavement under different loading pattern as described above. The stress, strain and deformation is displayed with the help of figures and tables.
Figure 2. Total Deformation of model.
Figure 3. Directional Deformation of model.
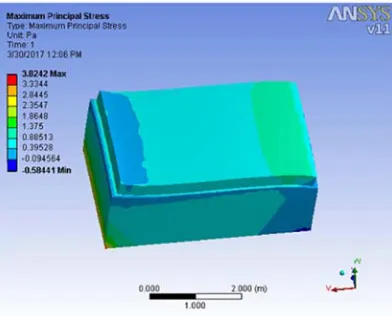
Figure 4. Maximum Principal Stress.
Figure 6. Middle Principal Stress of model.
Figure 7. Maximum Shear stress of model.
Figure 8. Equivalent Elastic Strain.
Figure 9. Safety Factor of model.
Figure 10. Stress Intensity of model.
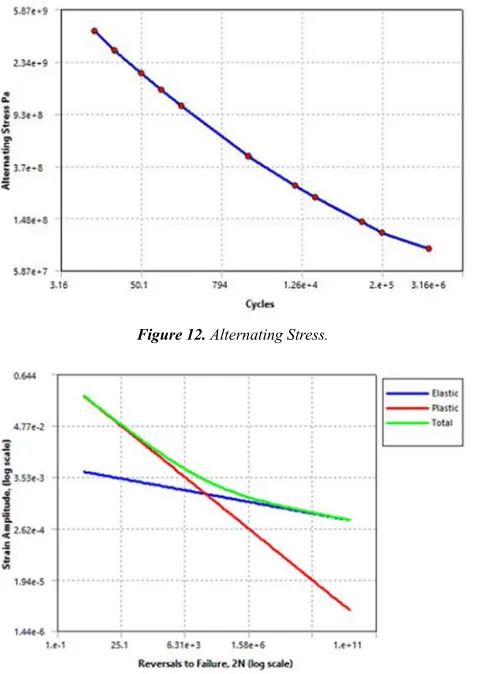
Figure 12. Alternating Stress.
Figure 13. Structural Steel – strain life parameters.
4. Conclusion
1) From the above figures, it is clear that the maximum total deformation is at the top surface while maximum directional deformation is at the bottom surface.
2) Maximum principal stress and maximum normal stress is at the right corner of concrete pavement patch
3) Middle principal stress of the model is distributed almost equally all over the surface (top and bottom).
4) Maximum shear stress is at the top layer of the model 5) Equivalent elastic strain is observed to be at the corners of the concrete patch
6) Stress intensity is observed as maximum at the corners of the concrete pavement patch.
7) Maximum principal elastic strain is observed to be at right corner of the model.
8) The alternating stress is decreases as the number of cycle increases.
9) Plastic strain amplitude drastically decreases as compared to the elastic strain amplitude.
10) Total strain amplitude observed to be curved path.
References
[1] Y. Chen, H. Zhang, X. Q. Zhu and D. W. Liu, “The Response of Pavement to the Multi-Axle Vehicle Dynamic Load”, International Conference of Electrical, Automation and Mechanical Engineering (EAME 2015).
[2] Shwetha and Siddesha H, “Vibration Response of Deck Slab”, Proceedings of Twelveth IRF International Conference, 31st August 2014, Chennai, India.
[3] Audrius Vaitkus, Judita Gražulyt and Rita Kleizien, “Influence of Static and Impact Load on Pavement Performance”, the 9th International Conference “Environmental Engineering” 22–23 May 2014, Vilnius, Lithuania.
[4] Yu Liu, Zhanping You and Hui Yao, “An Idealized Discrete Element Modelfor Pavement-Wheel Interaction”, Journal of Marine Science and Technology, Vol. 23, No. 3, pp. 339-343 (2015).
[5] Mostafa Yousefi Darestani, David P. Thambiratnam, Daksh Baweja and Andreas Nataatmadja, “Dynamic Response of Concrete Pavements under Vehicular Loads”, Proceedings IABSE Symposium - "Response to Tomorrow's Challenges in Structural Engineering" 92, pages pp. 104-105, Budapest, Hungary, 2006.
[6] Mohammed Maaz Salman and Prof. Amaresh S Patil, “Analytical Study of Steel Fibre Reinforced Rigid Pavements Under Moving Load”, International Journal for Scientific Research & Development, Vol. 2, Issue 07, 2014.
[7] Prof. Shrikant Harle and Prof. Prakash S. Pajgade, “Analysis of plain Concrete pavement in ANSYS”, Journal of Construction & Building Materials Engineering, Volume 3, Issue 1, pages 1-10, March 2017.
[8] Prof. Shrikant Harle and Prof. Prakash S. Pajgade, "Cement Grouted Macadam: A Review", Journal of Ceramics and Concrete Sciences, Volume 2, Issue 1, page 1-8, Jan 2017.
[9] Mr. Piyush Madke, Prof. Shrikant Harle, ‘Plastic Cell Filled Concrete Road: A Review’, Journal of Structural and Transportation Studies, Volume 1 Issue 3, pp 1-15, 2016.