Does Visualization Matter? The Role of Interactive Data
Visualization to Make Sense of Information
Arif Perdana
Singapore Institute of Technology [email protected]
Alastair Robb
UQ Business School, University of Queensland
Fiona Rohde
UQ Business School, University of Queensland
Abstract
As part of business analytics (BA) technologies, reporting and visualization play essential roles in mitigating users’ limitations (i.e., being inexperienced, having limited knowledge, and relying on simplified information). Reporting and visualization can potentially enhance users’ sense-making, thus permitting them to focus more on the information’s message rather than numerical analysis. To better understand the role of reporting and visualization in a contextualized environment, we investigate using interactive data visualization (IDV) within accounting. We aim to understand whether IDV can help enhance non-professional investors’ ability to make sense of foundational financial statement analyses. This study conducted an experiment using a sample of 324 nonprofessional investors. Our findings indicate that nonprofessional investors who use IDV are more heuristically adept than non-professional investors who use non-IDV. These findings enrich the theoretical understanding of business analytics’ use in accounting decision making. The results of this study also suggest several practical courses of action, such as promoting wider use of IDV and making affordable IDV more broadly available, particularly for non-professional investors.
Keywords: Human-computer interaction, information processing, visualization.
1
Introduction and Background
The literature focuses on the impact of IDV on individuals’ perceptions and decisions and finds that non-professional investors report favourably on IDV because it aligns with their requirements (Arnold, Bedard, Phillips & Sutton, 2012; Dilla, Janvrin & Raschke, 2010; Dilla & Raschke, 2015; Janvrin, Pinsker & Mascha, 2013; van der Heijden, 2013). Our research falls within the decision-support systems (DSS) domain where Arnott, Pervan & Dodgson (2005) find that theory grounded in judgment and decision-making remain relevant in practice. In light of non-professional investors’ bounded rationality, and by locating this IDV research in an accounting context, the extent to which IDV affects decision making, judgment, and decision outcomes is timely and pertinent.
A rich body of psychology research examines two dominant issues in decision processes and judgments namely, bounded rationality and uncertainty (see, e.g., Brown, 2006; Drechsler, Katsikopoulos & Gigerenzer, 2014; Gigerenzer & Goldstein, 1996; Goodie & Young, 2007; Kahneman, 2003; Tversky & Kahneman, 1974). While bounded rationality assumes that individuals have limited capacity to process information (Crozier & Ranyard, 1997; Simon, 1982), uncertainty refers to the imprecise outcomes that individuals perceive when decision-making (Brown, 2006), for example, due to limited or irrelevant information (Chuang, Kao, Cheng, & Chu, 2012).
Existing research in the accounting and information systems (AIS) field offers little insight, for example, into the role of information presentations in enhancing individuals’ cognition and coping with bounded rationality. Research also provides little understanding whether relevant information can help reduce individuals’ perceived uncertainty. Despite this limited understanding, research in information presentations’ appears to have arrived at some common findings. Such findings reveal that enhancing the presentations of accounting information whether via content or visualization enhancements tends to benefit novices (e.g., non-professional investors) more than experts (e.g., professional investors) when they interact with such information (see, e.g., Anderson & Mueller, 2005; Arnold et al., 2012; Dilla, Janvrin & Jeffrey, 2013). Research also indicates that novices’ (i.e., non-professional investors) capabilities can be improved when their decision-making involves interactions with IDV (Arnold et al., 2012; Tang, Hess, Valacich & Sweeney, 2014). To improve understanding of the role of information presentations relative to individuals’ cognition and bounded rationality, a deeper appreciation of how non-professional investors interact with IDV is needed. Such an inquiry is permitted by the availability of enhanced accounting information presentations like IDV. Against the preceding background and to help guide our investigation, we put forward the high-level research question: Does IDV improve non-professional investors’ understanding of financial information?
XBRL-enabled web versions of the statements represent IDV, and the HTML versions of the same statements represent “nonIDV”. Such IDV representation permits the use of several key IDV features e.g., financial statement comparisons, graphical displays, searchable information disclosures, and customizable presentations.
In this study, we endeavour to contribute to a better understanding of decision making with IDV by offering theoretical and practical research contributions. First, this study provides evidence on IDV’s role in alleviating non-professional investors’ bounded rationality by better leveraging their HIP. Second, this study helps articulate a complete representation of decision-making involving inputs (reporting/visualizations and task characteristics), decision processes (i.e., time spent, HIP), judgment (perceived uncertainty), and decision outcomes (i.e., task accuracy and willingness to invest). Third, this study draws attention to non-professional investors as potentially significant users of IDV. Fourth, this study suggests practical implications pertaining to the more widespread use of IDV for non-professional investors. Fifth, this study emphasizes the role of IDV as a practical tool for non-professional investors to better help them make sense of complex accounting information.
This paper is set out as follows. First, we identify relevant prior studies and develop hypotheses. Second, we describe the research method to address the proposed hypotheses. Third, we present the results including discussion of our hypotheses, findings, and research contributions. Finally, we present the study’s limitations, future research directions, and conclusion.
2
Research Model and Hypotheses Development
This section begins by offering our research model followed by reviewing extant research in judgement and decision making. We then explain relevant literature in IDV and its relationships with task characteristics. Such relationships are the key antecedents of judgement and decision making (JDM) in information presentations’ research. We then establish the importance of understanding the context in which the IDV is used. First, we explain nonprofessional investors’ characteristics when interacting with IDV. Second, we explain how the effect of such interactions can be improved by using IDV, resulting in improved decision making. We then develop our hypotheses on the extent to which IDV can help alleviate nonprofessional investors’ bounded rationality and help reduce uncertainty when decision making.
2.1
Research Model
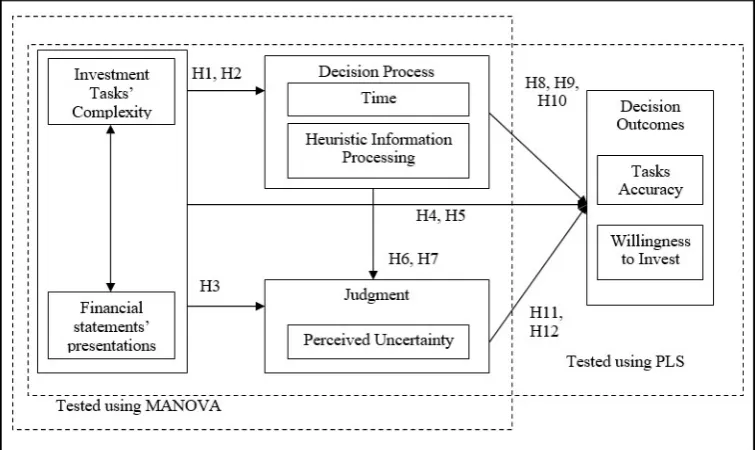
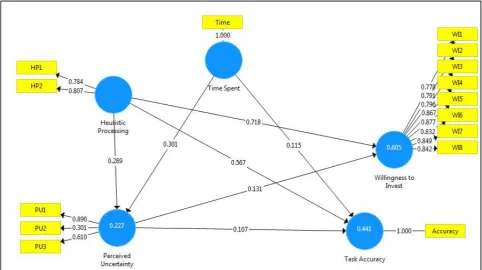
The use of IDV motivates accounting scholars to examine whether such presentation types provide more benefits to novice (e.g., non-professional investors) or experienced (e.g., professional investors) accounting information users. Arnold, et al. (2012), for example, report that IDV helps promote non-professional investors’ abilities to search for relevant information and to assess risks, resulting in better decision performance. Arnold et al. also note that non-professional investors’ abilities when interacting with IDV are more noticeably improved when compared to their professional counterparts. To help explicate the impact of IDV on non-professional investors decision processes, judgment, and decision outcomes, this study proposes the following research model as shown in Figure 1.
processes and perceptions, and whether IDV can help improve performance. Heuristic information processing is a robust strategy to overcome uncertainty when decision making (Mousavi & Gigerenzer, 2014), when faced with limited information and constraints (e.g., cost and time) decision-makers (including non-professional investors) use HIP to aid efficient decision processes to arrive at effective decision outcomes (Artinger, Petersen, Gigerenzer & Weibler, 2015). Further, the complexity of accounting information is likely to produce substantial uncertainty when decision making. At the same time, non-professional investors have to be adaptable to uncertain environments and minimize information search costs when undertaking decision processes but without compromising their decision outcomes.
Figure 1 Research Model
While professional and professional investors can both benefit from IDV, non-professional investors obtain greater improvements than non-professional investors (Arnold et al. 2012). Such improvements likely occur because the IDV enhanced presentations of accounting information better complement non-professional investors’ characteristics (i.e., inexperienced, possessing limited knowledge, and reliant on simplified information). IDV likely permits non-professional investors to avoid complex cognitive effort required to integrate multiple pieces of information prior to making decisions. Recall, they also prefer to use filtered information rather than unfiltered information (Elliott, Hodge, & Jackson, 2008; Hodge & Pronk, 2006). IDV, therefore, helps mitigate this non-integration tendency and enhances non-professional investors’ ability to arrive at better decisions, more akin to those made by their professional counterparts.
salient information instead of being overloaded (Drechsler et al., 2014; Tversky & Kahneman, 1974, 2011). Because individuals seek to reach decisions better more easily (Gigerenzer, Todd, & Group, 1999), they manipulate either the information or its environment to meet this challenge. Manipulating decision-making environments refers to ecological rationality that describes individuals being smarter and motivating other individuals to adjust their judgment and decision making (JDM) to reach better decisions (Todd, Gigerenzer, & the ABC Research Group, 2012).
Being ecologically rational allows us to investigate decision-makers’ interactions with information presentations and visualizations, that is, the decision-making environment, because visualizations enhance the appeals of both the content and appearance of information presentations. Visualizations tend to benefit novices more than experts (e.g., Arnold et al., 2012; Tang et al., 2014).
This study posits that IDV has the potential to provide an environment favourable for individuals to undertake simple, rapid, and economical strategies when decision making that still lead to effective outcomes. This premise agrees with the idea of ecological rationality, that is, the fitness between environment, the individuals, and domain-specificity permits individuals to better apply effective and efficient decision strategies when decision making (Todd, Fiddick & Krauss, 2000; Todd & Gigerenzer, 2007; Mousavi & Kheirandish, 2014). Two essential features of ecological rationality are the structure of the environments and individuals’ adaptability. Ecological rationality suggests that individuals can exploit the information from their environment by applying an effective and efficient decision process, namely, HIP (Mousavi & Kheirandish 2014). While environments may provide abundant information, not all is relevant and useful for decision making. Individuals likely adapt to certain environmental structures by modifying their behaviours when decision making (Gigerenzer, 2008; Mousavi & Kheirandish, 2014).
2.3
Interactive Data Visualization and Task Characteristics
Research has provided the foundation for understanding features in information presentations that potentially affect decision-making (e.g., graphs, tables, electronic-based presentations, and multimedia presentations) (Amer, 1991; Clements & Wolfe, 2000). Such presentations, however, do not allow decision makers to control the information. In other words, decision-makers cannot manipulate the information according to their preferences nor control its relevance to their tasks.
Permitting decision makers to interactively process information and select multiple presentations or visualizations relevant to their tasks can improve their decision-making outcomes. Starting in 2010 (Dilla et al., 2010), accounting researchers have investigated the application of interactive presentations. While the idea of IDV is established in other fields, such as marketing and information visualization, developing semantic web and a markup language (i.e., XBRL) specific to accounting information disclosure has contributed to advances in IDV applications. Dilla et al. (2010) establishes interactive presentation in AIS by defining the term IDV as “the visualization process that allows decision makers to navigate, to select data and display it at various levels of detail and in various formats” (p. 4). Further, advances in IS research have categorized IDV features and capabilities (i.e., reporting and visualization) as part of the suite of BA technologies (Watson, 2010).
Prior research in mainstream information systems (IS) and AIS suggest that individuals’ decision making is contingent on the information provided and the characteristics of their decision tasks (Dennis et al., 2008; Kelton et al., 2010). Individuals’ interactions with information presentations are, therefore, linked to both the presentation and the task characteristics. Individuals, for example, are likely to perform better with diagrams than other information presentations (i.e., icon, structured text, and text) when undertaking tasks requiring understanding, communicating, executing, or improving (Figl & Recker, 2014). Auditors could also perform faster prediction tasks using graphical information than using tabular information (Schulz & Booth, 1995). While research acknowledges that decision outcomes are contingent on information presentations and tasks, apparently little research investigates IDV allowing individuals to exercise greater levels of control. Considering IDV allows individuals to actively control the information relevant to their tasks, this study posits IDV use should lead to improved decision outcomes.
2.4
The Effect of IDV and Task Characteristics on Decision Processes, User
Evaluation, and Decision Outcomes.
more salient financial cues and easier information navigation than non-IDV, non-professional investors’ use of IDV can potentially improve their decision-making outcomes.
The increasing volumes of information that individuals face compels individuals to more efficiently use their time (Todd et al., 2000). This finding can also be applied to professional investors’ interactions with IDV. Using IDV can potentially mitigate non-professional investors’ narrow ability to process information scattered around financial statements. The availability of search features, concise presentations, and multiple relevant visualizations can help non-professional investors to more readily navigate accounting information and better spend their time-solving tasks. Janvrin et al. (2013) report that professional investors provided with IDV spend less time doing tasks than when using non-IDV. Other research confirms this and notes that non-professional investors perform quicker financial statement analyses using IDV (Locke, Lowe, & Lymer, 2015).
Although research broadly finds that IDV helps non-professional investors to make their decision-making more efficient, it does not consider the characteristics of the task of non-professional investors when they interact with IDV. Our study seeks to specify the effects of both IDV and task characteristics to non-professional investors’ decision time. Because IDV helps non-professional investors obtain better information than traditional formats, we suggest two points: first, that IDV is likely to benefit them when they seek to complete investment tasks (either simple or complex); and second, that the effect of both IDV and task characteristics lead to reduced decision time. Hence, we propose Hypothesis 1:
Hypothesis 1: Non-professional investors who interact with IDV to complete investment tasks spend less time than non-professional investors who interact with non-IDV to complete identical investment tasks.
Because of their ecological rationality, we see merit in investigating whether IDV can help non-professional investors cope better with their bounded rationality and their uncertainty. Bounded rationality can stimulate individuals to use heuristic information processing (HIP), thus increasing their decision making efficiency by minimizing their cognitive effort (Tversky & Kahneman, 2011). HIP is likely to occur when individuals seek to reach satisfactory solutions quickly, rather than reaching the best solutions although they may involve more time from comprehensive information processing. HIP, therefore, is likely perceived as time-efficient because it involves speedier decision making. Given these constraints, individuals often rationalize their decisions by efficiency or satisfaction rather than reaching the best solutions. Providing relevant information, offering alternative choices for making decisions, and improving individuals’ reasoning abilities may help alleviate individuals’ bounded rationality. IDV is capable of providing relevant information and thus permits individuals to select and display information fit for their purposes (Arnold et al., 2012; Hodge, Kennedy & Maines, 2004). We thus posit that, while IDV not only affects individuals’ performance, it can also alleviate individuals’ bounded rationality by leveraging their HIP. Accordingly, we offer Hypothesis 2:
Hypothesis 2: Non-professional investors who interact with IDV to complete investment tasks undertake better HIP than non-professional investors who interact with non-IDV to complete identical investment tasks.
Zo, & Ciganek, 2011). For example, XBRL is capable of reducing information asymmetry, making information more transparent, and lowering search costs (Kim et al., 2012; Peng, Shon, & Tan, 2011). By using IDV’s searchable and more readily understood information, non-professional investors are better able to evaluate and integrate multiple information pieces into financial statements and thus reduce the uncertainty of their decisions. Because it complements H2, we expect that using IDV is positively associated with HIP and will thus also reduce non-professional investors’ uncertainty. Against this background, we formulate Hypothesis 3:
Hypothesis 3: Non-professional investors who interact with IDV to complete investment tasks report less perceived uncertainty than non-professional investors who interact with non-IDV to complete identical investment tasks.
Information presentations and task characteristics affect task accuracy: Kelton & Pennington (2012) suggest that non-professional investors perform better relative to decision making by using hyperlinked financial statements rather than paper-based financial statements. Similarly, Speier (2006) notes that graphical presentations help individuals to more accurately seek both simple and complex spatial solutions. More recently, Tang et al., (2014) found that the interactions between IDV and investment task complexity help improve both individuals’ decision accuracy and confidence. To confirm prior empirical findings in this research, we posit that the interactions between IDV and task characteristics can help non-professional investors complete investment tasks more accurately and thus positively influence their willingness to invest. Hypotheses 4 and 5 are thus proposed:
Hypothesis 4: Non-professional investors who interact with IDV to complete investment tasks do so more accurately than non-professional investors who interact with non-IDV to complete identical investment tasks.
Hypothesis 5: Non-professional investors who interact with IDV to complete investment tasks have greater willingness to invest than non-professional investors who interact with non-IDV to complete identical investment tasks.
2.5
The relationships between decision processes, user evaluation, and
decision outcomes
When relevant information can be more readily evaluated, individuals’ certainty when decision making can be increased (Devaraj, Fan, & Kohli, 2002). Simultaneously, individuals can better manage cost and time constraints. Non-professional investors more readily acquire relevant information when interacting with XBRL-enabled financial statements (Kim et al., 2012; Yoon et al., 2011), because they help them to avoid incorrect analyses, and allow them to reduce errors and more efficiently complete their tasks (Arnold et al., 2012; Janvrin et al., 2013). We thus argue that IDV can reduce non-professional investors’ perceived uncertainty. Hence, we propose Hypothesis 6:
Hypothesis 6: When interacting with IDV to undertake investment tasks, non-professional investors’ time spent is reduced and is associated with less uncertainty compared with non-professional investors’ using non-IDV to undertake identical investment tasks.
investment decision faster than non-professional investors (Frederickson & Miller, 2004; Maines & McDaniel, 2000). Non-professional investors may also use HIP but probably because their investment knowledge is restricted (Monti et al., 2012).
HIP describes individuals’ cognitive effort when decision making (Koop & Johnson, 2011) and can thus influence individuals’ perceptions. Xiao & Benbasat (2007), for example, propose that aspects of consumers’ decision processing (e.g., less decision time) when using recommendation agents can lead to positive evaluations of the customers on dimensions, such as, perceived ease of use and perceived usefulness. Trumbo (2002) finds that HIP can predict individuals’ perceived risk, specifically, likely lower levels of it. While uncertain environments are frequently linked to HIP, little is known about whether it can predict the level of individuals’ perceived uncertainty. This study posits that HIP helps individuals to reduce their uncertainty when decision making. Accordingly, we propose Hypothesis 7:
Hypothesis 7: When interacting with IDV to undertake investment tasks, non-professional investors’ HIP is associated with less uncertainty compared with non-professional investors’ using non-IDV to undertake identical investment tasks.
While individuals perceive and process information during decision making (see, Koop & Johnson, 2011; Tversky & Kahneman, 2011; Xiao & Benbasat, 2007), we argue that decision making differs from user evaluation. It describes individuals’ belief about the particular circumstances existing prior to their decisions (Xiao & Benbasat, 2007), while decision processes describe the effort and time required when making decisions (Bonner, 2008). We investigate the relationship between decision making and its outcomes using both process-based and performance-process-based measurement, because Bonner (2008) suggests that reducing time is process-based while accuracy is performance-based.
To more comprehensively consider non-professional investors’ interactions with IDV, we separate decision processes, user evaluation, and decision outcomes. Hypotheses 8 to 12 deal with such distinction. Our first step relates to time spent and accuracy. While time spent can vary greatly, it is one of the variables of a decision process (Rubinstein, 2013). Time spent may predict whether individuals deliberately or quickly process information prior to arriving at decisions. While individuals’ decision processes can be quickened by applying HIP, such information processing may, perhaps contrarily, lead to improved decision outcomes (Todd et al., 2012). We expect that reduced time spent should similarly lead to improved decision outcomes. We argue that reducing the time spent on decision-making will provide the most benefit if it permits more time to be spent on improving task accuracy. These considerations lead to Hypothesis 8:
Hypothesis 8: When interacting with IDV to undertake investment tasks, non-professional investors’ time spent is reduced and is associated with improved task accuracy compared with non-professional investors’ using non-IDV to undertake identical investment tasks.
non-professional investors who cannot access IDV. This is because such access can improve the accuracy of investment, and positively influence their willingness to invest. Hence, we offer Hypotheses 9 and 10:
Hypothesis 9: When interacting with IDV to undertake investment tasks, non-professional investors’ HIP is positively associated with task accuracy compared with non-professional investors’ using non-IDV to undertake identical investment tasks.
Hypothesis 10: When interacting with IDV to undertake investment tasks, non-professional investors’ HIP is positively associated with willingness to invest compared with non-professional investors’ using non-IDV to undertake identical investment tasks.
We extend the literature in accounting decision making evaluating non-professional investors’ willingness to invest. We adapted the variable ‘willingness to invest’, which describes individuals’ decision processes and user evaluations in research into investment decision-making (e.g., Bhandari, Hassanein & Deaves, 2008; Kelton & Pennington, 2012) For example, Kelton & Pennington (2012) assess non-professionals investors’ willingness to invest by evaluating how likely they are to allocate their hypothetical investment funds. We argue that, when non-professional investors use IDV, the visualizations better align with their cognitive and mental representations than when similar professional investors interact with non-IDV. IDV should thus enable non-professional investors to better evaluate the information, be better informed, and have their propensity to allocate investment improved by accessing visualizations.
Teo & Yu (2005) find that the relationship between uncertainty and willingness to buy on online markets is mediated. That is, the lower the uncertainty and the transaction costs, the more likely that individuals will purchase products online. Further, XBRL apparently enables quick information retrieval, improves transparency, and reduces information asymmetry (Kim et al., 2012; Peng et al., 2011; Yoon et al., 2011). Interactions with XBRL can thus aid non-professional investors to use relevant information for their investment analyses rather than having to pay to collect the information. Such interactions should lead to reduced perceived uncertainty, thus encouraging non-professionals to invest more accurately and to more readily allocate their investment funds than non-professional investors undertaking identical investment tasks when interacting with non-IDV. Thus, we propose Hypotheses 11 and 12:
Hypothesis 11: When interacting with IDV to undertake investment tasks, non-professional investors’ reduced perceived uncertainty is positively associated with task accuracy compared with non-professional investors’ using non-IDV to undertake identical investment tasks. Hypothesis 12: When interacting with IDV to undertake investment tasks, non-professional investors’ reduced perceived uncertainty is positively associated with willingness to invest compared with non-professional investors’ using non-IDV to undertake identical investment tasks.
3
Method
3.1
Experimental Design and Variables
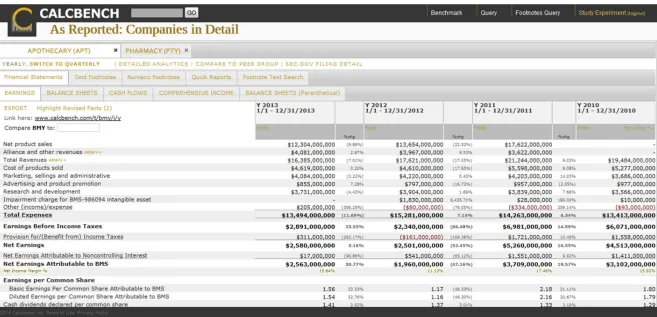
simple tasks; (3) IDV and complex tasks, and (4) Non-IDV and complex tasks. The IDV versions were given to the treatment group, with the control group receiving non-IDV versions of the same financial statements. To achieve greater external validity for both the IDV and non-IDV presentations, we used the actual financial statements obtained from the US SEC of two large pharmaceutical companies, Apothecary and Pharmacy (pseudonyms). The IDV versions of the financial statements were taken from the Calcbench platform, while the non-IDV versions were HTML copies of the same financial statements retrieved from the US SEC. The two companies had comparable financial statements and relatively similar financial performance. We chose manufacturing companies, particularly pharmaceutical, to minimize participants’ bias towards companies’ names and products. We also used manufacturing companies’ financial statements because they are the most commonly used in accounting textbooks and investment guidelines (Merrill Lynch, 2000, 2003). See Appendix D for samples of experimental materials and experimental tasks.
Our research model was tested in two steps. First, we ran the experiment to investigate how the factorial design affected HIP and perceived uncertainty, using MANOVA to test the effect. Second, we classified our data into four groups of non-professional investors: (1) those who interact with IDV to solve simple tasks; (2) those who interact with non-IDV to solve simple tasks; (3) those who interact with IDV to solve complex tasks; and (4) those who interact with non-IDV to solve complex tasks. We then tested how these four groups differed in their willingness to invest, using partial least squares (PLS) to compare them. A web-based interface was used to operationalize the experimental procedures and materials. The following five dependent variables were thus assessed.
Perceived uncertainty(PU) refers to the degree to which non-professional investors can acquire and evaluate the relevant accounting information. This variable is based on measuring their perceptions in a post-task questionnaire using three reflective items reported on a seven-item, Likert-type scale adapted from Devaraj et al. (2002). See Appendix E, Table E, Panel A for measurement items.
HIP refers to non-professional investors’ decision processes reflecting the extent to which they sought efficiency when decision making (Gigerenzer, 2008; Watts, Shankaranarayanan, & Even, 2012). This variable is based on self-reported decision processes captured in a post-task questionnaire. This variable consists of two reflective items and was measured on a seven-item, Likert-type scale adapted from Watts et al. (2012). See Appendix E, Table E, Panel B for measurement items.
Time spent(TS) refers to the time taken by each non-professional investor to complete the assigned investment tasks in our research. This variable is directly recorded automatically using the web-based experiment.
Task accuracy(TA) refers how each non-professional investor scored when answering to the assigned investment tasks. This variable is measured directly with non-professional investors’ answers graded for accuracy by comparing them to model answers, which are straightforward and objective and do not need to be interpreted for their grading.
based on perceptual measurements captured in a post-task questionnaire. This variable was adapted from Kelton & Pennington’s (2012) four reflective items and was applied to the assigned financial information. This study also developed four additional reflective items to measure how individuals perceived financial statements’ presentations. See Appendix E, Table E, Panel C for measurement items.
To address the participants’ heterogeneity, we controlled for five variables: the participants’ familiarity with companies’ names and products, their prior knowledge of accounting and finance, their prior experience of investment analyses, their academic background, and their appetite for risk (i.e., risk aversion vs risk seeking). These control variables were collected using a demographic questionnaire prior to conducting the experimental tasks.
3.2
Participants
Before the main experiment, we conducted a pilot test using 48 PhD students from a large Australian university to ensure that our procedures and treatments were understandable, valid, and reliable. This pilot also asked participants to assess the clarity of instructions, tasks, and questionnaires. Its results indicate that participants understood the experimental materials (i.e., its procedure and treatments) and that all questions about perceptions were deemed reliable. We asked participants about the level of financial statement interactivity, the level of investment task complexity, and what they understood about the experimental procedure using a seven-point, Likert-type scale. Their responses to the manipulation check showed that the experimental procedure would be understandable and the experimental treatments would be successful.
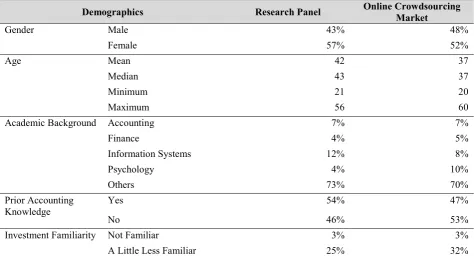
The participants for the main experiment were recruited from an online crowdsourcing market (OCM: Amazon Mechanical Turk) and a research panel (Qualtrics). The main consideration when selecting the sample data was the heterogeneity of non-professional investors. To ensure that participants suitably represented non-professional investors, we asked them screening questions and accepted only those who answered them appropriately. All participants sourced via Qualtrics were from Australia while those sourced using OCM were from the USA. All participants were from relatively diverse backgrounds (see Appendix A, Tables A.1, A.2, & A3).
4
Results
In the following subsections, we explain the results of the multivariate analysis of variance (MANOVA) and PLS used to test the hypotheses. MANOVA compared the interaction effects between financial statement presentations and investment task complexity on non-professional investors’ time spent, HIP, perceived uncertainty, task accuracy, and willingness to invest. PLS with multigroup analysis investigated the strength and the direction of the relationships between variables in the research model.
4.1
Results of the effect of IDV and task characteristics on decision
processes, user evaluation, and decision outcomes.
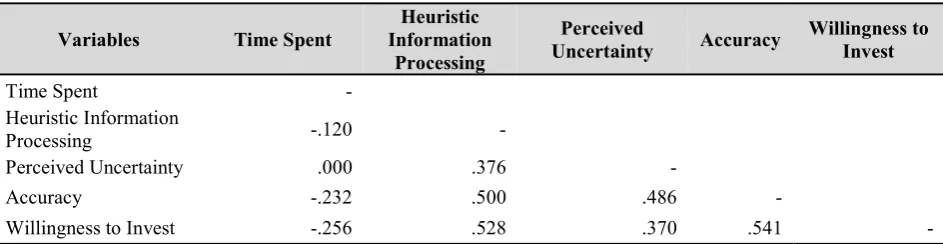
variables were moderately correlated (< .7) indicating that multicollinearity is not a concern for the data (see Appendix B, Table B.2). In addition, the results of the scatterplots for each group indicate linear relationships for each variable. The data violate the assumption of the equal variance of covariance; this is not substantially concerning as the data for each group in the experiment are approximately equal. Thus, the interpretation of the data remains robust (Hair, Black, Babin, & Anderson, 2010; Tabachnick & Fidell, 2007). To deal better with the equality of error variance, we used a more stringent alpha level of .001 to accept or reject the hypotheses tested with MANOVA (Tabachnick & Fidell, 2007).
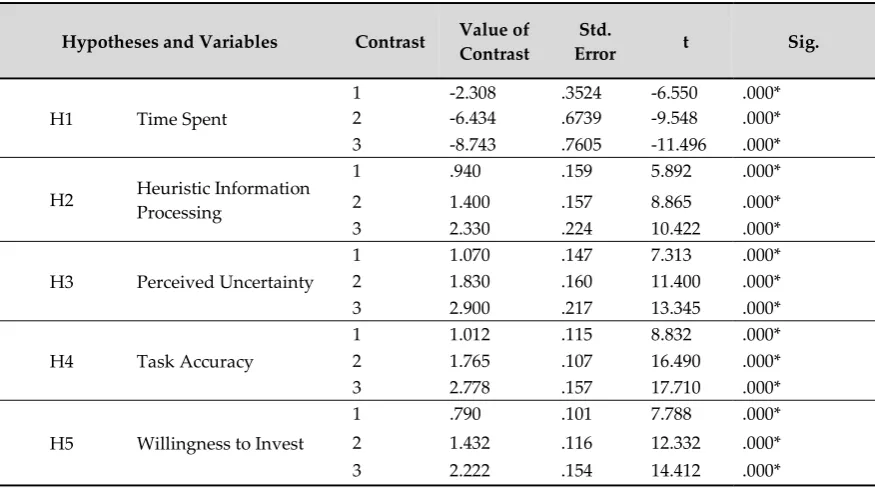
Hypotheses 1, 2, 3, 4 and 5 specifically compare the differences between experimental and control groups. To test the hypotheses further and help specify the differences, we conducted planned comparisons to examine whether such differences occurred between the groups. We provided weighting coefficients for each group to be compared, and zero weight coefficients for groups that were not. The planned comparisons used the weight coefficients of (contrast 1: 1,-1,0,0); (contrast 2: 0,0,1,-1), and (contrast 3: 1,-1,1,-1) for the following four groups: IDV and Simple Tasks; Non-IDV and Simple Tasks; IDV and Complex Tasks; and Non-IDV and Complex Tasks, respectively. Table 1 displays the results of planned comparisons for each group.
Hypotheses and Variables Contrast Value of Contrast Error Std. t Sig.
H1 Time Spent
1 -2.308 .3524 -6.550 .000*
2 -6.434 .6739 -9.548 .000*
3 -8.743 .7605 -11.496 .000*
H2 Heuristic Information Processing
1 .940 .159 5.892 .000*
2 1.400 .157 8.865 .000*
3 2.330 .224 10.422 .000*
H3 Perceived Uncertainty
1 1.070 .147 7.313 .000*
2 1.830 .160 11.400 .000*
3 2.900 .217 13.345 .000*
H4 Task Accuracy
1 1.012 .115 8.832 .000*
2 1.765 .107 16.490 .000*
3 2.778 .157 17.710 .000*
H5 Willingness to Invest
1 .790 .101 7.788 .000*
2 1.432 .116 12.332 .000*
3 2.222 .154 14.412 .000*
* significant at .05 (one-tailed) Table 1 Contrast Tests
products, prior knowledge of accounting and finance, experience of investment analysis, academic background, and appetite for risk. The multivariate tests presented a significant p-value (< .05) for the interaction effects. After adding the control variables to the analysis, the effects of information presentations and task characteristics remained significant for TS, HIP, PU, TA, and WI. The introduction of the control variables had no significant additional effect on the results, thus confirming the strength of the effect of both financial statements’ presentations and investment tasks’ complexity on TA and WI.
4.2
Results of the relationships between decision processes, user evaluation,
and decision outcomes.
The second analysis in this study tested the strength and directions of relationships between non-professional investors’ TS, HIP, PU, TA and WI using component-based structural equation modelling (SEM) or PLS to conduct the analysis. We used the software SmartPLS 3.0 to conduct the three analyses. First, we examined the relationship between the measurement items and the variables to ensure that the items suitably reflect and measure the variables. Second, we conducted a relational analysis between variables for the IDV and non-IDV contexts. Third, we examined the strength of the relationships between variables using a multigroup comparison analysis between IDV and non-IDV.
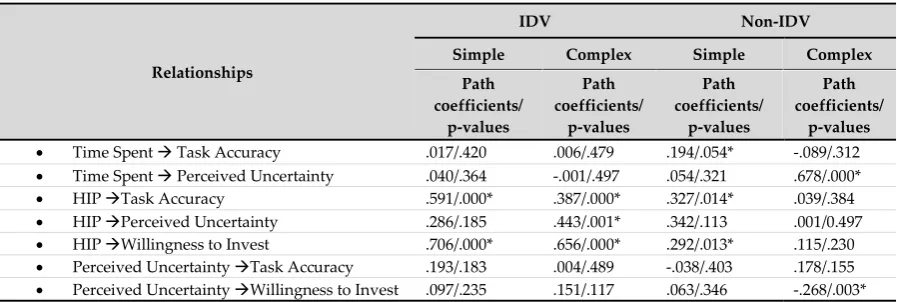
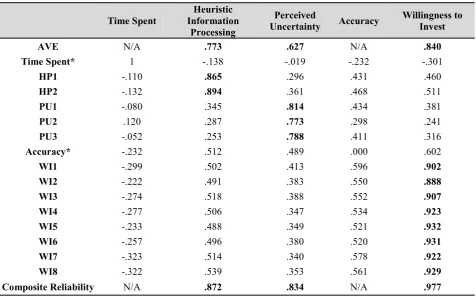
We used the whole dataset (n = 324) to analyse the measurement model and found it to be valid (see details in Appendix C). After this analysis and verifying the construct validity, we divided the data set into four subsets: group 1 (IDV and simple tasks); group 2 (IDV and complex tasks); group 3 (Non-IDV and simple tasks); and group 4 (Non-IDV and complex tasks), which yielded 81 items in each subset. We then analysed the groups in two categories (i.e., IDV and non-IDV) to assess the structural model using multigroup analysis. To determine the significance of the relationships, we performed a Bootstrap analysis using a resampling technique of 1000 random samples. Further, we compared the results of the structural model between IDV and non-IDV use to ascertain whether the relationships between variables in each group were different. Table 2 presents the path coefficients and t statistics of the PLS results for each group.
Relationships
IDV Non-IDV
Simple Complex Simple Complex Path coefficients/ p-values Path coefficients/ p-values Path coefficients/ p-values Path coefficients/ p-values Time Spent Task Accuracy .017/.420 .006/.479 .194/.054* -.089/.312
Time Spent Perceived Uncertainty .040/.364 -.001/.497 .054/.321 .678/.000*
HIP Task Accuracy .591/.000* .387/.000* .327/.014* .039/.384
HIP Perceived Uncertainty .286/.185 .443/.001* .342/.113 .001/0.497
HIP Willingness to Invest .706/.000* .656/.000* .292/.013* .115/.230
Perceived Uncertainty Task Accuracy .193/.183 .004/.489 -.038/.403 .178/.155
Perceived Uncertainty Willingness to Invest .097/.235 .151/.117 .063/.346 -.268/.003*
* significant at .05 (one-tailed)
Table 2 Path Coefficients for Each Comparable Group
that HIP can predict decision-making outcomes. Overall, regarding relational analysis, HIP and PU explained 60% of the variability in WI. TS and HIP contribute 23% of the variance of PU, and 44% of the variance of accuracy is explained by HIP, TS and, PU (see Appendix C, Figure C.1).
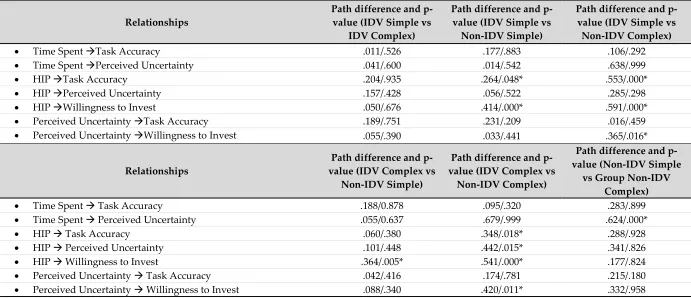
Relationships Path difference and p-value (IDV Simple vs IDV Complex)
Path difference and p-value (IDV Simple vs Non-IDV Simple)
Path difference and p-value (IDV Simple vs Non-IDV Complex)
Time Spent Task Accuracy .011/.526 .177/.883 .106/.292
Time Spent Perceived Uncertainty .041/.600 .014/.542 .638/.999
HIP Task Accuracy .204/.935 .264/.048* .553/.000*
HIP Perceived Uncertainty .157/.428 .056/.522 .285/.298
HIP Willingness to Invest .050/.676 .414/.000* .591/.000*
Perceived Uncertainty Task Accuracy .189/.751 .231/.209 .016/.459
Perceived Uncertainty Willingness to Invest .055/.390 .033/.441 .365/.016*
Relationships value (IDV Complex vs Path difference and p-Non-IDV Simple)
Path difference and p-value (IDV Complex vs
Non-IDV Complex)
Path difference and p-value (Non-IDV Simple
vs Group Non-IDV Complex)
Time Spent Task Accuracy .188/0.878 .095/.320 .283/.899
Time Spent Perceived Uncertainty .055/0.637 .679/.999 .624/.000*
HIP Task Accuracy .060/.380 .348/.018* .288/.928
HIP Perceived Uncertainty .101/.448 .442/.015* .341/.826
HIP Willingness to Invest .364/.005* .541/.000* .177/.824
Perceived Uncertainty Task Accuracy .042/.416 .174/.781 .215/.180
Perceived Uncertainty Willingness to Invest .088/.340 .420/.011* .332/.958
* significant at .05 (one-tailed)
11% of the variance in perceived uncertainty. The R2 value for accuracy and WI was not significant. The multigroup comparison analysis (see Table 3) between the four groups indicates that the relationships between HIP, TA, and WI are stronger for non-professional investors interacting with IDV than those interacting with non-IDV regardless of their tasks’ complexity. The relationship between HIP and PU is stronger for non-professional investors who use IDV to complete complex tasks than non-professional investors who use non-IDV to complete the same tasks. While the path coefficient between TS and PU is not significant for IDV (see Table 2), the relationship between those variables is stronger for non-professional investors interacting with non-IDV when completing complex tasks than those completing simple tasks (see Table 3). The path coefficient between perceived uncertainty and willingness to invest is not significant for IDV (see Table 2). Such a relationship, however, is stronger for non-professional investors interacting with IDV when completing either simple or complex tasks than those interacting with non-IDV when completing complex tasks.
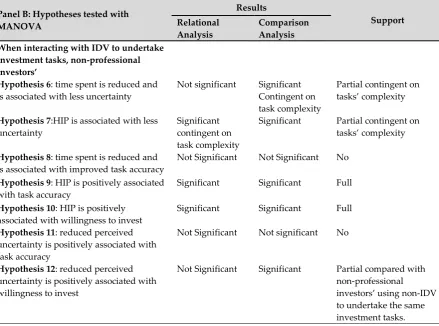
To support the hypotheses tested with PLS, we considered both the relational and comparative analyses. They showed that H9 and H10 were fully supported, H12 was partially support, H6 and H7 were partially supported but contingent on the investment tasks’ complexity, while H8 and H11 were rejected (Table 4, Panel A summarizes the outcomes of hypotheses testing for the experimental and control groups. Table 4, Panel B summarizes the outcomes of hypotheses testing for the interactions between groups and variables).
Panel A: Hypotheses tested with MANOVA Support Non-professional investors who interact with IDV to complete
investment tasks
Hypothesis 1: spend less time Full
Hypothesis 2: undertake better HIP Full
Hypothesis 3: report less perceived uncertainty Full
Hypothesis 4: do so more accurately Full
Hypothesis 5: have greater willingness to invest Full
than non-professional investors who interact with non-IDV to complete
Panel B: Hypotheses tested with MANOVA Results Support Relational Analysis Comparison Analysis When interacting with IDV to undertake
investment tasks, non-professional investors’
Hypothesis 6: time spent is reduced and
is associated with less uncertainty Not significant Significant Contingent on task complexity
Partial contingent on tasks’ complexity
Hypothesis 7:HIP is associated with less
uncertainty Significant contingent on
task complexity
Significant Partial contingent on tasks’ complexity
Hypothesis 8: time spent is reduced and is associated with improved task accuracy
Not Significant Not Significant No
Hypothesis 9: HIP is positively associated
with task accuracy Significant Significant Full
Hypothesis 10: HIP is positively
associated with willingness to invest Significant Significant Full
Hypothesis 11: reduced perceived uncertainty is positively associated with task accuracy
Not Significant Not significant No
Hypothesis 12: reduced perceived uncertainty is positively associated with willingness to invest
Not Significant Significant Partial compared with non-professional investors’ using non-IDV to undertake the same investment tasks. Table 4 Summary of hypotheses testing results
5
Research Contributions
5.1
Theoretical Contributions
While information visualization improves cognition (Mazza, 2009), little research in AIS investigates whether enhancing perception improves cognition. Little is also known about the relationships among non-professional investors’ perceptions, decision processes, and decision outcomes when interacting with IDV while undertaking simple versus complex tasks. The results of this study fill these research gaps. Our first finding suggests that decision processes and user evaluations contribute to the variance of decision outcomes, particularly when non-professional investors interact with IDV to complete either simple or complex investment tasks. We also find that non-professional investors who use IDV to complete their investment tasks do so with greater accuracy and willingness to invest.
Unlike UTAUT and TAM which focus on adoption decisions, our research endeavours to better articulate the underlying framework for decision making with IDV. For example, visualization is perceived to facilitate the use and usefulness of interactive data compared to other presentation formats (Janvrin et al., 2013) and thus potentially lead to users choosing it. However, how this interactive data leads to better decision making remains in contention. Thus, our research assists users to understand the role of IDV in affecting decisions about willingness to invest rather than willingness to adopt IDV.
arriving at decision outcomes. The second finding of this study highlights that non-professional investors who use IDV apply their HIP better than those who use IDV. We found that non-professional investors are more heuristically adept and perceive IDV as offering more certainty than non-IDV when completing both simple and complex investment tasks.
While researchers are divided about whether or not HIP can lead to the best decision making (Daigle, Pinsker, & Pitre, 2015; Hertwig et al., 2008), our third finding shows that using HIP can lead to improved decision outcomes. Our three findings help confirm that decision making under pressure (e.g., time and uncertainty) is not always systematically undertaken but is more likely to be heuristic. IDV positively influences time spent and task accuracy when completing investment tasks. IDV also improves non-professional investors’ accuracy and their ability to allocate time efficiently when completing both simple and complex tasks. Using IDV to complete either investment tasks positively affects the likelihood of non-professional investors allocating their investment funds. This finding aligns with past studies in experimental psychology (see, e.g., Hertwig et al., 2008; Todd et al., 2012).
Overall, our findings show that IDV could be used to positively influence non-professional investors’ perceptions and better use their HIP. While this finding may interest cognitive science (Goldstone, Pestilli, & Börner, 2015), understanding such a mechanism is important to the design knowledge of IDV. The design properties of IDV, such as multiple visualization, active control, and analytics, can help complex accounting information become more intelligible and thus understood.
5.2
Practical Contributions
This study focuses on the context of IDV use by non-professional investors. We find that IDV better equips non-professional investors in their practice of making investment decisions. First, IDV is a valuable tool for non-professional investors’ decision making. Our findings show that IDV can alleviate non-professional investors’ bounded rationality and reduce uncertainty. IDV mitigate, at least, some non-professional investors’ limitations, particularly those associated with HIP. We suggest that accounting and other regulatory bodies could promote widespread use of IDV and help to provide affordable IDV platforms that permit non-professional investors to make more sound investment decisions. Companies could also develop IDV to deliver accounting information that attracts non-professional investors’ funds.
Second, our findings suggest that IDV capabilities may aid non-professional investors to reach better decisions closer to how professional investors do thus showing the potential of IDV in practice. Tools like IDV are increasingly important, particularly in the era of big data where individuals, including non-professional investors, need the means of readily organizing increasing volumes of data. For non-professional investors, IDV can mitigate the complexity of accounting information by offering them greater control over the presentation of information. They can thus, undertake investment analyses using visualizations rather than complex number crunching.
6
Limitations, Future Research, and Conclusion
1
Three limitations should be considered when interpreting the results of this study. First, while we used only research tasks concerned with calculating financial ratios, which are basic to investment analyses (Cong, Du, & Feng, 2008; Hodge et al., 2004), such tasks in practice may differ from what we provided in this experiment. Further, they focused only on information in the financial statements. We did not use investment tasks that require participants to examine other information, such as notes to financial statements and MD&A.
financial statement presentations and the associated tasks. We used the financial statements from two pharmaceutical companies that had relatively similar financial performances. Thus, willingness to invest does not consider other factors such as the economic circumstances of the companies being analysed. We incorporated this variable nonetheless to measure the extent to which IDV assisted non-professional investors to better access information when investing, and how IBV may influence their intention to invest funds.
Third, while we used relatively representative pools of non-professional investors and presented real financial statements to improve the external validity of these results, future studies should confirm our results with other pools of non-professional investors. For example, those with different levels of business knowledge may display relationships between variables (e.g., time spent, HIP, perceived uncertainty, tasks accuracy and willingness to invest) that vary in the degree to which IDV enhances non-professional investors’ decision making. Such research is needed because investigating IDV from the perspective of ecological rationality continues to evolve.
Nonetheless, these limitations motivate future research. First, future research could develop investment task analyses that better represent the practices that require participants to integrate both quantitative and qualitative information from financial statements (e.g., financial reports’ footnotes and MD&A). Sutton, Arnold, Bedard, & Philips (2012) note that XBRL’s capacity to convert qualitative accounting information into structured data can support sound investment analyses. Such a capacity is indeed relevant as exemplified by IDV’s role in helping non-professional investors to analyse qualitative accounting information and incorporate such information into their investment decisions. Second, more research should investigate whether IDV affects professional investors and how it differs from non-professional investors. Third, while our research confirms the efficacy of IDV for alleviating non-professional investors’ bounded rationality and reducing their uncertainty, we did not seek to isolate the aspects of IDV most suited to aiding non-professional investors. Future research could investigate, isolate, and confirm the aspects of IDV that best reduce non-professional investors’ bounded rationality and their uncertainty.
Overall, this study has answered our high-level research questions: Does IDV improve non-professional investors’ understanding of financial information? IDV aids non-non-professional investors by improving their HIP and reducing their levels of uncertainty when undertaking investment tasks. We posit that our research is theoretically and pragmatically relevant as IDV is becoming widespread in accounting to aid non-professional investors’ decision making.
References
Amer, T. S. (1991). An experimental investigation of multi-cue financial information display and decision making. Journal of Information Systems, 5(2), 18–34.
Anderson, J. C., & Mueller, J.M. (2005). The effects of experience and data presentation format on an auditing judgment. The Journal of Applied Business Research, 21(1), 53–63.
Arnold, V., Bedard, J., Phillips, J., & Sutton, S.(2012). The impact of tagging qualitative financial information on investor decision making: implications for XBRL. International Journal of Accounting Information Systems, 13(2), 2–20.
Arnott, D., Pervan, G., Dodgson, G. (2005). A descriptive analysis of decision support systems research between 1993 and 2003. Australasian Journal of Information Systems, 12(2), 178–191. Bhandari, G., Hassanein, K., & Deaves, R. (2008). Debiasing investors with decision support systems:
An experimental investigation. Decision Support Systems, 46(1), 35–40.
Brown, J. C. (2006). The effects of behavioral and outcome feedback on prudent decision-making under conditions of present and future uncertainty. Judgment and Decision Making, 1(1), 76–85. Cardinaels, E. (2008). The interplay between cost accounting knowledge and presentation formats
in cost-based decision-making. Accounting Organizations and Society, 33(6), 582–602.
Chuang, S., Kao, D-T., Cheng, Y-H., & Chu, C-A. (2012). The effect of incomplete information on the compromise effect. Judgment and Decision Making, 7(2), 196–206.
Clements, C. E., & Wolfe, C. J. (2000). Reporting financial results with the video medium: An experimental analysis. Journal of Information Systems, 14(2), 79–94.
Cong, D., Du, H., & Feng, J. (2008). Does web syndication technology facilitate investor decision making? Journal of Emerging Technologies in Accounting, 5(1), 143–159.
Cosic, R., Shanks, G., & Maynard, S. (2016). A business analytics capability framework. Australasian Journal of Information Systems, 19(1), 1–18.
Crozier, W. R., & R. Ranyard. (1997). Cognitive process models and explanations of decision making. In Svenson, Ranyard, R., Crozier W.R. (Ed.), Decision Making: Cognitive Models and Explanations (pp. 5–20). New York: Routledge.
Daigle, R. J., Pinsker, R. E., & Pitre, T. J. (2015). The Impact of Order Effects on Nonprofessional Investors’ Belief Revision When Presented a Long Series of Disclosures in an Experimental Market Setting. Accounting Horizons, 29(2).
Dennis, A., Fuller, R., & Valacich, J. (2008). Media, tasks, and communication processes: A theory of media synchronicity. MIS Quarterly, 32(3), 575–600.
Devaraj, S., Fan, M., & Kohli, R. (2002). Antecedents of B2C channel satisfaction and preference: validating e-commerce metrics. Information Systems Research, 13(3), 316–333.
Dilla, W. N., Janvrin, D. J., & Jeffrey, C. (2013). The impact of graphical displays of pro forma earnings information on professional and nonprofessional investors’ earnings judgments. Behavioral Research in Accounting, 25(1), 37–60.
Dilla, W. N., Janvrin, D. N., & Raschke, R. L. (2010). Interactive data visualization: A new directions for accounting information systems research. Journal of Information Systems, 24(2), 137.
Dilla, W.N. & Raschke, R.L. 2015. Data visualization for fraud detection: Practice implications and a call for future research. International Journal of Accounting Information Systems, 16, 1-22. Drechsler, M., Katsikopoulos, K., & Gigerenzer, G. (2014). Axiomatizing bounded rationality: the
priority heuristic. Theory and Decision, 77(2), 183–196.
Elliott, W. B., Hodge, F. D., & Jackson, K. E. (2008). The Association between Nonprofessional Investors’ Information Choices and Their Portfolio Returns: The Importance of Investing Experience. Contemporary Accounting Research, 25(2), 473–498.
Figl, K., & Recker, J. (2014). Exploring cognitive style and task-specific preferences for process representations. Requirements Engineering, Forthcoming, 1–23.
Frederickson, J. R., & Miller, J.S. (2004). The effects of pro forma earnings disclosures on analysts’ and non-professional investors’ equity valuation judgments. The Accounting Review, 79(3), 667–686.
Gigerenzer, G., & Goldstein, D. G. (1996). Reasoning the fast and frugal way: models of bounded rationality. Psychological Review, 103(4), 650–669.
Gigerenzer, G., Todd, P., & the ABC Research Group. (1999). Simple heuristics that make us smart. New York: Oxford University Press, Inc.
Goldstone, R. L., Pestilli, F., & Börner, K. (2015). Self-portraits of the brain: cognitive science, data visualization, and communicating brain structure and function. Trends in Cognitive Sciences, 19(8), 462–474.
Goodie, A. S., & Young, D. L. (2007). The skill element in decision making under uncertainty : Control or competence? Judgment and Decision Making, 2(3), 189–203.
Hair, J. F., Black, W.C. Babin, B.J. & Anderson, R.E. (2010). Multivariate data analysis 7th Edition. USA: Prentice Hall.
Hertwig, R., Herzog, S. M., Schooler, L. J., & Reimer, T. (2008). Fluency heuristic: A model of how the mind exploits a by-product of information retrieval. Journal of Experimental Psychology: Learning, Memory and Cognition, 34(5), 1191–1206.
Hodge, F. D., Kennedy, J. J., & Maines, L. A. (2004). Does search-facilitating technology improve the transparency of financial reporting. The Accounting Review, 79(3), 687–703.
Hodge, F., & Pronk, M. (2006). The impact of expertise and investors’ use of online financial report information. Journal of Accounting Auditing Finance, 21(3), 267–292.
Janvrin, D. J., Pinsker, R., & Mascha, M. F. (2013). XBRL-enabled, spreadsheet, or PDF? Factors influencing exclusive user choice of reporting technology. Journal of Information Systems, 27(2), 35–49.
Kahneman, D. (2003). Maps of bounded rationality: Psychology for behavioral economist. The American Economic Review, 93(5), 1449–1475.
Kelton, A. S., & Pennington, R. R. (2012). Internet financial reporting: the effects of information presentation format and content differences on investor decision making. Computers in Human Behaviour, 28(4), 1178–1185.
Kelton, A. S., Pennington, R. R., & Tuttle, B. M. (2010). The effects of information presentation format on judgment and decision making: A review of the information systems research. Journal of Information Systems, 24(2), 79–105.
Kim, J., Lim, J.-H., & No, W. G. (2012). The effect of first wave mandatory XBRL reporting across the financial information environment. Journal of Information Systems, 26(1), 127–153.
Koop, G., & J.G. Johnson. (2011). Response dynamics: A new window on the decision process. Judgment and Decision Making, 6(8), 750–758.
Locke, J., Lowe, A. & Lymer, A. (2015). Interactive data and retail investor decision-making: An experimental study. Accounting & Finance, 55(1), 213–240.
Maines, L. A., & McDaniel, L.S. (2000). Effects of comprehensive-income characteristics on non-professional investors’ judgments: the role of financial-statement presentation format. The Accounting Review, 75(2), 179–207.
Mazza, R. (2009). Introduction to Information Visualization. London: Springer-Verlag.
Merrill Lynch. (2003). Merrill Lynch guide to understanding financial reports. USA: Merrill Lynch, Pierce, Fenner & Smith, Inc.
Monti, M., Boero, R., Berg, N., Gigerenzer, G., & Martignon, L. (2012). How do common investors behave? Information search and portfolio choice among bank customers and university students. Mind & Society, 11(2), 203–233.
Mousavi, S., & Gigerenzer, G. (2014). Risk, uncertainty, and heuristics. Journal of Business Research 67(8): 1671–1678.
Mousavi, S., & Kheirandish, R. (2014). Behind and beyond a shared definition of ecological rationality: A functional view of heuristics. Journal of Business Research 67(8): 1780–1785. Ong, K., & Shanks, G. (2015). Editorial for the special issue on business analytics applications.
Australasian Journal of Information Systems, 19(1), 1–3.
Peng, E., Shon, J., & Tan, C. (2011). XBRL and accruals: empirical evidence from China. Accounting Perspectives, 10(2), 109–138.
Raschke, R., & Steinbart, P. J. (2008). Mitigating the effects of misleading graphs on decisions by educating users about the principles of graph design. Journal of Information Systems, 22(2), 23– 52.
Roohani, S., Furusho, Y. & Koizumi, M. (2009). Improving transparency and monitoring functions of corporate governance. International Journal of Disclosure and Governance, 6(4), 355–369. Rubinstein, A. (2013). Response time and decision making: An experimental study. Judgment and
Decision Making, 8(5), 540–551.
Sallam, R. L., Howson, C., Idoine, C. J., Oestreich, T. W., Richardson James L, & Tapadinhas, J. (2017). Magic Quadrant for Business Intelligence and Analytics Platforms.
Schulz, A., & Booth, P. (1995). The effects of presentation format on the effectiveness and efficiency of auditors’ analytical review judgments. Accounting and Finance, 35(1), 107–131.
Simon, H. (1982). Models of Bounded Rationality. Cambridge, MA: MIT Press.
Speier, C. (2006). The influence of information presentation formats on complex task decision-making performance. International Journal of Human Computer Studies, 64, 11115–11131. Sutton, S. G., Arnold, V., Bedard, J.C, & Philips, J.R. (2012). Enhancing and structuring the MD&A
to aid investors when using interactive data. Journal of Information Systems, 26(2), 167–188. Tabachnick, B. G., & Fidell, L. S. (2007). Using multivariate statistics 5th edition. USA: Person
Educations, Inc.
Tang, F., Hess, T., Valacich, J., & Sweeney, J. (2014). The effects of visualization and interactivity on calibration in financial decision-making. Behavioral Research in Accounting, 26(1), 25–58. Teo, T. S., & Yu, Y. (2005). Online buying behavior : a transaction cost economics perspective. Omega,
33(5), 451–465.
Todd, P., Fiddick, L., & Krauss, S. (2000). Ecological rationality and its contents. Thinking & Reasoning, 6(4), 375–384.
Todd, P. M., Gigerenzer, G., & the ABC Research Group. (2012). Ecological rationality: Intelligence in the world. New York: Oxford University Press, Inc.
Trumbo, C. W. (2002). Information processing and risk perception: an adaptation of the heuristic-systematic model. Journal of Communication, 52(2), 367–382.
Tversky, A., & Kahneman, D. (1974). Judgment under uncertainty: heuristics and biases. Science, 185(4157), 1124–1131.
Tversky, A., & Kahneman, D. (2011). Thinking, fast and slow. New York: Farrar, Straus and Giroux. van der Heijden, H. (2013). Evaluating dual performance measures on information dashboards:
effects of anchoring and presentation format. Journal of Information Systems, 27(2), 21–34. Watson, H.J. (2010). BI-based Organizations. Business Intelligence Journal, 15(2), 4
Watts, S., Shankaranarayanan, G., & Even, A. (2012). Data quality assessment in context: a cognitive perspective. Decision Support Systems, 48(1), 202–211.
Xiao, B., & Benbasat, I. (2007). E-Commerce product recommendation agents: use, characteristics, and impact. MIS Quartely, 31(1), 137–209.
Appendices
Appendix A
Table A.1 Screening Questions for Nonprofessional Investors
Questions
1. Are you subscribing on behalf of an investment firm?
2. Are you employed by a bank or an investment firm performing investment related tasks? 3. Are you a broker/dealer, or an investment advisor?
4. Do you have a limited understanding about financial statements and interested in conducting investment tasks? 5. Are you a student (bachelor, postgraduate student or research student, etc.)?
6. Are you a United States (US) citizen or Australian permanent resident?
Note: If participants’ answered “No” to questions 1, 2, 3, and 5, and “Yes” to question 4 and 6 they passed the screening questions and the web-based experimental tasks provided them with an information sheet and a consent form. Question No 6 was distinguished by the data sources. This study targeted US participants from online crowdsourcing market and targeted Australian participants from online research panel.
Table A.2 Participants Responses Selection
Research Panel Online Crowdsourcing Market
Total Responses 131 367
Failed to pass screening questions 0 82
Incomplete responses 43 20
Failed to complete experimental tasks 12 17 Final usable responses 76 248 Percent usable responses 57% 68%
Table A.3 Demographic Distribution
Demographics Research Panel Online Crowdsourcing Market
Gender Male 43% 48%
Female 57% 52%
Age Mean 42 37
Median 43 37
Minimum 21 20
Maximum 56 60
Academic Background Accounting 7% 7%
Finance 4% 5%
Information Systems 12% 8%
Psychology 4% 10%
Others 73% 70%
Prior Accounting
Knowledge Yes 54% 47%
No 46% 53%
Demographics Research Panel Market
Somewhat Familiar 53% 44%
Familiar 17% 13%
Very Familiar 3% 8%
PDF/HTML Financial Statements Familiarity
Not Familiar 10% 15%
A Little Less Familiar 18% 27%
Somewhat Familiar 35% 34%
Familiar 30% 17%
Very Familiar 7% 7%
XBRL-enabled Financial Statements Familiarity
Not Familiar 50% 61%
A Little Less Familiar 24% 27%
Somewhat Familiar 21% 9%
Familiar 4% 3%
Very Familiar 1% 0%
Appetite for Risk Risk Averse 84% 77%
Risk Neutral 8% 13%
Risk Taker 8% 10%
Familiarity with
Apothecary and its products
Not Familiar 65% 35%
A Little Less Familiar 20% 29%
Somewhat Familiar 10% 25%
Familiar 3% 8%
Very Familiar 2% 3%
Familiarity with
Pharmacy and its products
Not Familiar 40% 20%
A Little Less Familiar 24% 30%
Somewhat Familiar 24% 30%
Familiar 7% 17%
Very Familiar 5% 3%
Working Experience No Experience 4% 3%
0-5 Years 22% 21%
6-10 Years 21% 32%
11-15 Years 53% 44%
Areas of Experience Accounting 4% 7%
Finance 11% 4%
Information Systems 8% 13%
Psychology 7% 4%
Appendix B
Table B.1 Rotated Component Matrix
Item Component
1 2 3
PU1 .231 .679 .204
PU2 .053 .820 .154
PU3 .190 .801 -.013
HIP1 .263 .112 .847
HIP2 .320 .207 .771
WI1 .852 .233 .184
WI2 .847 .196 .180
WI3 .857 .189 .220
WI4 .891 .127 .208
WI5 .910 .132 .175
WI6 .898 .173 .179
WI7 .889 .117 .222
WI8 .887 .129 .250
PU – Perceived Uncertainty, HIP – Heuristic Information Processing, and WI – Willingness to Invest
Table B.2 Pearson Correlations
Variables Time Spent Information Heuristic Processing
Perceived
Uncertainty Accuracy Willingness to Invest
Time Spent -
Heuristic Information
Processing -.120 -
Perceived Uncertainty .000 .376 -
Accuracy -.232 .500 .486 -
Appendix C
Table C.1 Loadings and Cross Loadings of Measure (n=324)
Time Spent Information Heuristic Processing
Perceived
Uncertainty Accuracy Willingness to Invest
AVE N/A .773 .627 N/A .840
Time Spent* 1 -.138 -.019 -.232 -.301
HP1 -.110 .865 .296 .431 .460
HP2 -.132 .894 .361 .468 .511
PU1 -.080 .345 .814 .434 .381
PU2 .120 .287 .773 .298 .241
PU3 -.052 .253 .788 .411 .316
Accuracy* -.232 .512 .489 .000 .602
WI1 -.299 .502 .413 .596 .902
WI2 -.222 .491 .383 .550 .888
WI3 -.274 .518 .388 .552 .907
WI4 -.277 .506 .347 .534 .923
WI5 -.233 .488 .349 .521 .932
WI6 -.257 .496 .380 .520 .931
WI7 -.323 .514 .340 .578 .922
WI8 -.322 .539 .353 .561 .929
Composite Reliability N/A .872 .834 N/A .977
Figure C.1 Path diagram for IDV
Appendix D
Experimental Materials
Figure D.2. Instructions for Interactive Data Visualization
Table D.1 Experimental tasks
Experimental Tasks
Simple Tasks Complex Tasks
1. Entering Net Earnings for the two companies 1. Entering Net Earnings for Apothecary and calculating the percentage change (% change Quarter on Quarter) to the Net Earnings attributable to Apothecary
2. Entering the value and/or component to calculating
Net Income or Profit Margin for the two companies 2. Calculating the difference of Net Earnings between Apothecary and Pharmacy 3. Entering Total Assets for the two companies 3. Entering Total Assets for Apothecary and
calculating the percentage change (% change Quarter on Quarter) to the Net Earnings attributable to Apothecary
4. Entering the value and/or component to calculating Current Ratio for the two companies