Development of Ion Sensitive Probe and Its Application to RF
Plasma Device DT-ALPHA
∗
)
Takahiko KOBAYASHI, Hiroyuki TAKAHASHI, Sumio KITAJIMA, Atsushi OKAMOTO
1),
Kenji TOBITA, Peerapat BOONYARITTIPONG, Takeshi SAIKYO, Yusuke ISHIKAWA,
Kenta OGASAWARA and Hidetoshi HASHIZUME
Department of Quantum Science and Energy Engineering, Tohoku University, Sendai 980-8579, Japan
1)Department of Applied Energy, Nagoya University, Furo-cho, Chikusa-ku, Nagoya 464-8603, Japan
(Received 28 December 2017/Accepted 4 June 2018)
An ion sensitive probe was developed and introduced into the radio-frequency (RF) plasma source DT-ALPHA. The collector current was investigated by changing the position of the recessed collector electrode and the offset voltage to optimize these two parameters for ion temperature evaluation. It was found that the ion temperature could be overestimated when the retardation of bulk electrons is insufficient. In addition, it was also found that secondary electron emission from the collector surface results in overestimation of ion temperature. The dependence of ion temperature on RF heating power was then investigated. The ion temperature increased, and the ratio of ion temperature and electron temperature became close to 1 as RF power increased. This trend could be interpreted as a temperature relaxation between ions and electrons. The ion temperature dependence on neutral pressure was also investigated. Ion temperature monotonically decreased with increasing neutral pressure.
c
2018 The Japan Society of Plasma Science and Nuclear Fusion Research
Keywords: ion temperature, ion sensitive probe, RF plasma, divertor, temperature relaxation DOI: 10.1585/pfr.13.3401090
1. Introduction
In magnetically confined fusion research, it is very im-portant to control the enormous heat load flowing onto the divertor plates. Detached divertor formation, which can be achieved by enhancing the volumetric recombination, is a strong candidate for the mitigation of the plasma heat load because volumetric recombination decreases the plasma pressure along magnetic field lines. To utilize volumetric recombination in the divertor region, electron energy re-moval is indispensable because the reaction rate of the vol-umetric recombination becomes large in a relatively lower electron temperature region (typicallyTe<1 eV), whereas
the temperature of the electrons that reach the divertor re-gion is much larger than 1 eV. Therefore, the secondary gas puffing method is widely utilized to enhance volumet-ric recombination [1]. To understand the mechanism of plasma detachment, investigation of the electron energy flow is required. In relatively higher electron temperature regions (Te > 5 eV), electrons lose their energy through
ionization and excitation. In addition, a numerical study has indicated that energy transfer from electron to ion plays an important role when electrons are cooled down below
Te <5 eV [2]. Small linear devices have reported
experi-mental results that support these energy flows [3, 4]. The amount of energy transferred from electrons to ions de-pends on the ion temperatureTi, as well as the electron author’s e-mail: [email protected]
∗)This article is based on the presentation at the 26th International Toki Conference (ITC26).
temperatureTe. However, plasma detachment study with
ion temperature measurement is insufficient, and therefore the role of ions have not been experimentally confirmed.
It is advantageous to use a small linear divertor plasma simulator for conducting experimental studies on the afore-mentioned subject. We have been developing a radio-frequency (RF) plasma device to study divertor plasma, and helium volumetric recombining plasma production was achieved [5]. This achievement enables us to investi-gate the role of ions in electron energy removal. To evalu-ate the amount of energy transferred among electrons, ions, and neutrals, measurement ofTias well asTeis required.
The electron temperature where volumetric recombination is strongly enhanced can be determined by the line and continuum spectra [6]. Although ion temperature also can be determined by optical emission spectroscopy (Doppler broadening), its application to a small device is difficult becauseTi in a small device is rather small. A retarding
field analyzer (RFA) and ion sensitive probe (ISP) are also available forTimeasurement [7, 8]. An RFA consists of
several grids and a collector, so its size is almost compa-rable to the diameter of the plasma produced in a small device. Therefore, the RFA would have an undesirable in-fluence on plasma measurement when it is introduced in a small device. On the other hand, the size of an ISP is rela-tively smaller than that of an RFA. In addition, an ISP can measure low ion temperatures belowTe<1 eV [9]. In the
present work, an ISP was developed, and the first results
c
2018 The Japan Society of Plasma
0.5
1.5
2.0
Collector electrode (Mo) Guard electrode (SUS304) Insulator (Al2O3)
Probe shaft (Φ13.8x400 SUS) Moving rod (M4x300 SUS316) Isolation adapter (PTFE)
Linear motion feedthrough Current terminal
0 100[ mm ] 0.5
Fig. 1 Overview of the ISP developed in the present work.
ofTimeasurement are reported. The design of the ISP and
the experimental setup are described in Sec. 2. Then, the results of ion temperature measurement are presented and discussed in Sec. 3, followed by a summary in Sec. 4.
2. Experimental Setup
2.1
Design of the ion sensitive probe
Usually, the ion current obtained by a Langmuir probe is much smaller than that of the electrons. Therefore, it is necessary to mitigate the bulk electron inflow into an ion-collecting electrode for ion temperature evaluation. To measure bulk ions and electrons individually, an ISP that consists of an ion-collecting electrode and an electron-collecting electrode has been proposed [9]. Figure 1 shows a schematic of the ISP developed in the present work. The ISP consists of a collector electrode and a guard electrode. The collector and guard electrodes are utilized to capture ions and electrons, respectively. As illustrated in Fig. 2, the collector electrode is embedded inside the cylindrical guard electrode. Therefore, ions with larger Larmor radius can reach the collector electrode, whereas electrons with smaller Larmor radius are captured by the guard electrode. The position of the collector electrode can be adjusted by a linear motion feedthrough. In the present paper, the height of the guard electrode from the collector electrode is de-noted byh. The typical magnetic field strength, electron Larmor radius, and ion Larmor radius where the ISP is in-stalled are approximatelyB = 0.15 T,ρe = 0.5 mm, and ρi=3 mm, respectively. Therefore, a guard height
approx-imately 1 mm is considered to be adequte. In the present experiment, the guard height wash =1 - 2 mm when the ion temperature was measured. However, some electrons can still reach the collector electrode owing to theE×B drift because an equipotential surface is formed as the cov-ering surface of an ISP [10]. In order to retard the drifted electrons, the potential of the collector electrodeVC was
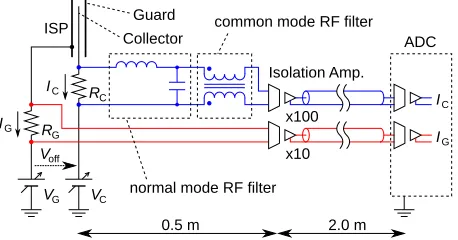
maintained atVG−Voff, as shown in Fig. 3. Here,Voff repre-sents the offset voltage. The collector and guard electrodes were biased individually, and the frequency of the poten-tial sweep was 1 or 2 Hz. The values ofRC andRGwere
RC =1 kΩandRG =10Ω, respectively. As described in
the following subsection, experiments were conducted in a radio-frequency plasma source. Therefore, normal-mode
Guard Collector Insulator
h
B
Voff
VC
A A
IC IG
Fig. 2 Schematic of ion and electron measurements using an ISP.
Collector
IC
ISP Guard
RG
RC
IG
Voff
common mode RF filter
normal mode RF filter
IC
IG
ADC
Isolation Amp.
x10
0.5 m 2.0 m
x100
VG VC
Fig. 3 The schematic diagram of the measurement circuit.
filter (LC low pass filter) and common-mode filter (choke coil) were utilized for the measurement.
2.2
RF plasma device DT-ALPHA
de-ISP End plate
(upstream)
1.85 TMP
50 L / s RF power
supply TMP
350 L / s
TMP 350 L / s
z [ m ]
0.3
Matching circuit
1.13 0.98 0
Fig. 4 Schematic of the RF plasma device DT-ALPHA.
vice, two end-plates made of SUS are installed to terminate the plasma. Helium working gas is supplied to the device near the upstream end-plate. The ISP was installed and ion temperature measurement was conducted atz=1.13 m.
3. Experimental Results and
Discussion
In this section, the results of the ion temperature mea-surement are presented. To evaluate the ion temperature, the guard height and offset voltage should be optimized to retard the bulk electrons. Therefore, the dependence of the collector current on the guard height and offset voltage was investigated. Ion temperature measurement was then conducted by changing the RF heating power and neutral pressure.
3.1
Dependence of collector current on the
guard height and o
ff
set voltage
Figure 5 shows the 2D contour map plotted using the collector current obtained for−20 V VG 80 V, and
0 mm h 2.0 mm. The offset voltage was maintained atVoff =−20 V during the measurement. The position of
the ISP was near the central region of a cylindrical plasma. The guard heighthwas changed with an interval ofΔh=
0.1 - 0.2 mm. The electron temperature, electron density, and space potential evaluated from theI-V curve of guard current were approximatelyTe=6 eV,ne=1×10¹⁷m−3,
andVs =−25 V, respectively. In Fig. 5, the region where
ion current was obtained is mapped with blue color. On the other hand, the region where electron current was mea-sured is mapped with red color. To evaluate the ion tem-perature, the inflow of bulk electrons should be suppressed over the range of the collector potential sweep. However, as shown in Fig. 5, the electron current is clearly measured whenhis smaller than 1.0 mm. On the other hand, elec-tron current is almost zero whenhis larger than 1.0 mm. Therefore, Fig. 5 indicates that in the case ofVoff =−20 V,
h >1.0 mm is suitable for evaluating the ion temperature for these plasma parameters.
Fig. 5 The 2D contour plot mapped with the collector current obtained with various guard heightsh. Ion current was obtained in the region mapped with blue color. The re-gion mapped with red color represents the electron cur-rent. RF heating power and neutral pressure were main-tained at approximatelyPRF=140 W andp=1.1 Pa,
re-spectively.
Fig. 6 The 2D contour plot mapped with the collector current obtained with various offset voltages Voff. Ion current was obtained in the region mapped with blue color. The region mapped with red color represents the electron cur-rent. RF heating power and neutral pressure were main-tained at approximatelyPRF=140 W andp=1.1 Pa,
re-spectively.
By maintaining the guard height at h=1.0 mm, the dependence of the collector current on the offset volt-age was also investigated. Figure 6 shows the 2D con-tour map plotted using the collector current obtained with
−20 V VG 80 V, and −40 V Voff 0 V. Here, the measurement position and plasma discharge conditions were the same as that of Fig. 5. As shown in Fig. 6, the bulk electron inflow depends on the offset voltage as well as guard height. Electron current was obtained in the re-gion whereVoff −20 V, whereas no electron current was observed in the region whereVoff < −20 V. Therefore,
Fig. 6 indicates thatVoff <−20 V is suitable for ion
tem-perature evaluation for this discharge condition and guard height.
For both h > 1.0 mm in Fig. 5 andVoff < −20 V in
col-lector potential, was observed. Figure 7 (a) shows anI
-V curve obtained with h = 1.0 mm and Voff = −40 V.
Although the bulk electron inflow was completely sup-pressed, an ion current of 0.2µA was observed above
VC 10 V. This ion currentI0became larger as the
neg-ative offset voltage increased, and its distinctive feature is thatI0 is almost independent of the collector potential.
Therefore,I0is considered not to reflect the bulk ion inflow
because it should depend on the collector potential. Based on an experiment conducted using an RFA, it has been re-ported that such current can be measured by the secondary electron emission [7]. Therefore,I0appearing in Fig. 7 (a)
is also due to the secondary electrons emitted from the sur-face of the collector electrode. Then, theI-Vcurves using the non-compensated collector current (IC) and
compen-sated collector current (IC −I0) are compared, as shown
in Fig. 7 (b). The slope of the non-compensatedI-Vcurve (red circles) yielded an ion temperature ofTi = 4.0 eV,
whereas that of the compensated one (blue circles) yielded
Ti =2.3 eV. This result indicates that the ion temperature
can be overestimated by the secondary electron emission. The influence of the guard height, offset voltage, and com-pensation of theI-V curve on ion temperature evaluation are summarized in the following subsection.
The space potential corresponding to Fig. 7 is ap-proximately Vs = −25 V. Therefore, Ti is expected to
be obtained using the slope nearVC = −25 V. However,
as shown in Fig. 7 (b), Ti was evaluated using the slope
where the collector potential is larger than the space po-tential, instead of using the slope nearVs because theI
-0 1 2
IC
[
μ
A ]
-10 0 10 20 30
VC [ V ]
10-7
10-6
IC
,
IC
-
I0
[ A ]
(a)
(b)
h = 1.0 mm, V
off = -40 V
I
C - I0
I
C
T
i = 4.0 eV
Ti = 2.3 eV
constant current I
0
Fig. 7 I-V curves of (a) linear plot and (b) semi-log plot. The red and blue dots represent theI-Vcurves obtained using non-compensated collector current (IC) and compensated
collector current (IC−I0), respectively. RF heating power
and neutral pressure were maintained at approximately PRF=140 W andp=1.1 Pa, respectively.
V curve seems to deviate from the Maxwellian distribu-tion nearVs. One possible reason of this deviation is the
space-charge limit. According to Brunneret al.[12], the shape of anI-V curve is affected when a probe is limited by the space-charge. In Ref. 12, a critical bias voltage
Vcrit =d/4 √
nikBTi/ε0 is proposed to avoid the influence
of space-charge and to obtain reliable ion temperature. Here,drepresents the distance between a guard electrode and a recessed collector electrode.ε0is the permittivity of
free space. Utilizingni =1×10¹⁷m−3, Ti=2.3 eV, and
d = 1 mm, we obtainVcrit ∼16 V. Unfortunately, it was
difficult to evaluateTifrom the slope above VC > 16 V;
hence,Tiwas obtained using the slope aroundVC =5 V.
Similarly,Ti presented in the following subsections were
also obtained from the slope where the collector potential was larger than the space potential. Another work on ISP measurement indicated that large offset voltage leads to an anomalousI-Vcurve, which seems to involve high energy tail components [13]. However, a clear tail component was not observed in the present study.
3.2
Influence of the guard height and o
ff
set
voltage on ion temperature evaluation
The influence of secondary electron emission and bulk electron inflow on ion temperature evaluation was investi-gated forh=1.0 mm and 2.0 mm. The results are summa-rized in Fig. 8. The horizontal axis in each figure represents the offset voltage. As described in Sec. 3.1, the electron current is observed whenVoff is insufficient. The electron
Fig. 8 Collector currentI0and ion temperatureTias a function
of the offset voltage. Left-hand side column and right-hand side column correspond to h=1.0 mm and h = 2.0 mm, respectively. RF heating power and neutral pres-sure were maintained at approximatelyPRF=140 W and
current became saturated as the collector potential became large. The open squares in Fig. 8 (a) correspond to this electron saturation current. On the other hand, the filled circles in Fig. 8 (a) represents the collector current due to the secondary electron emission. The open squares and circles in Fig. 8 (b) represent the ion temperatureTi
evalu-ated from theI-Vcurves obtained for these conditions. Al-though the inflow of bulk electrons makesTievaluation
in-adequate, the ion temperature was approximately obtained. In this case,I0has a negative value, so−I0was added to the
I-Vcurve andTiwas obtained using its slope. In principle,
Tiis independent of the measurement parameters, namely
Voff andh. However, as shown in Fig. 8 (b), Ti obtained
from theseI-V curves clearly depends on the offset volt-age. As described above, the positive collector current is due to the secondary electron emission. Then, the current was subtracted from theI-Vcurve, and the ion temperature was evaluated. The filled circles in Fig. 8 (b) represent the ion temperature obtained from the compensatedI-Vcurve.
Ti evaluated from the compensated I-V curve showed an
almost constant value ofTi = 2.3 eV. A similar
investi-gation was conducted usingh=2.0 mm. Figure 8 (c) and Fig. 8 (d) summarize the results. As shown in Fig. 8 (c), the collector currentI0, which is due to the bulk electron inflow
and secondary electron emission, is much smaller than that in Fig. 8 (a). Although the influence of the secondary elec-tron emission onTi evaluation is relatively smaller than
that forh =1.0 mm,Ti obtained using non-compensated
I-Vcurves varies slightly, as shown in Fig. 8 (d). However,
Ti obtained from compensated I-V curves is independent
of the offset voltage and has almost comparable value to that in Fig. 8 (b).
3.3
Ion temperature dependence on RF
power
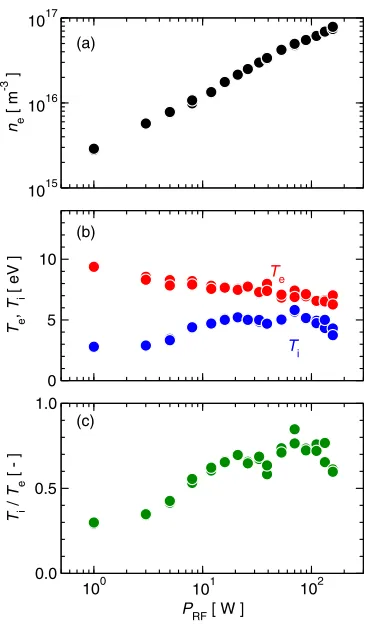
Figure 9 shows the electron densityne, electron
tem-perature Te, ion temperature Ti, and temperature ratio
Ti/Te as a function of RF power PRF. Te and ne were
evaluated using theI-Vcurves obtained by the guard elec-trode. The helium neutral pressure was 0.56 Pa. As the RF power increased, the electron density monotonically in-creased fromne=3×10¹⁵m−3tone=8×10¹⁶m−3. At
relatively lower RF power, the electron temperature was approximately Te = 10 eV and decreased to Te = 6 eV
with increasing RF power. As shown in Fig. 9 (b),Ti at
lower PRF is approximately 3 eV. As PRF increased, Ti
increased gradually and became approximately 5 eV near
PRF = 100 W. The dependence of the temperature ratio
Ti/Teis shown in Fig. 9 (c). AlthoughTi/TeatPRF=1 W
was approximately 0.4, it increased toward the high RF power region. Finally, Ti/Te exceeded 0.7. In a
DT-ALPHA device, ions obtain their energy mainly through the electron-ion collision because no ion heating system is equipped. One of the possible reasons for the increase in the ion temperature is the electron-ion temperature re-laxation. Then,Ti/Te was again plotted as a function of
1015 1016 1017
ne
[ m
-3 ]
0 5 10
Te
,
Ti
[ eV ]
100 101 102
PRF [ W ] 0.0
0.5 1.0
Ti
/
Te
[ - ]
Te
Ti
(a)
(b)
(c)
Fig. 9 Dependence of (a) the electron densityne, (b) the electron
temperature Teand the ion temperatureTi, and (c) the
temperature ratioTi/Te on the RF power PRF. Neutral
pressure was maintained at approximately 0.56 Pa.
10-4 10-3 10-2
τconf / τT ei
[ - ] 0.0
0.5 1.0
Ti
/
Te
[ - ]
Fig. 10 Dependence ofTi/Teonτconf/τeiT.
τconf/τeiT, as shown in Fig. 10. Here,τconfandτeiT represent
the plasma confinement time and the electron-ion tempera-ture relaxation time, respectively. In a DT-ALPHA device, the typical ion Mach numberαisα=0.1 [14]. Using ion sound velocityCs=
√
e(Te+Ti)/mi,τconfis given as τconf=
l
αCs.
the value oflwas chosen as 0.5 m. Note that the ion tem-perature and electron temtem-perature obtained from the ISP were used for evaluatingCs. Electron-ion temperature
re-laxation timeτeiT is given as
τei T =
3√2ππε02mime
niZi2e4lnΛ
Te
me + Ti
mi
3/2
. (2)
Here,Zi,e, and lnΛrepresent the ion charge number,
elec-tron charge, and Coulomb logarithm, respectively. Ion density was assumed to be equal to electron densityne. In
addition to the ion sound velocity,Te,Ti, andneobtained
using the ISP were utilized forτei
T evaluation. As shown in
Fig. 10, Ti/Te increased gradually as τconf/τeiT increased.
At τconf/τeiT = 10−2, Ti/Te becomes approximately 0.8.
This result indicates that the increase in ion temperature was due to the temperature relaxation between electrons and ions. Although temperature relaxation seems to be a possible interpretation of the results, a more detailed un-derstanding is required becauseτconfis much smaller than τei
T even thoughTi/Te ∼0.8. As described above,Te,Ti,
andneutilized for each calculation were obtained by the
ISP (z = 1.13 m). However, temperature relaxation ceeds while ions and electrons move from the plasma pro-duction region to the measurement position. Therefore, a more detailed understanding is expected to be obtained by considering the axial distribution of the electron tempera-ture and ion temperatempera-ture.
3.4
Ion temperature dependence on neutral
pressure
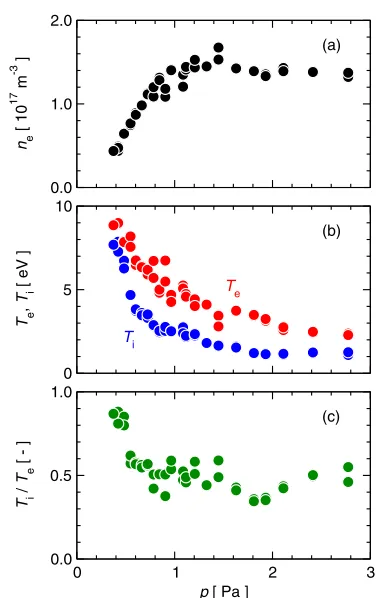
The ion temperature was also measured by chang-ing the neutral pressure from 0.37 Pa to 2.8 Pa. Figure 11 shows the electron densityne, electron temperatureTe, ion
temperatureTi, and temperature ratioTi/Teas a function
of neutral pressure. Here, the neutral pressure was mea-sured at z = 0.98 m. The RF power was maintained at
PRF =140 W during measurements. As the neutral
pres-sure increased, the electron density increased fromne =
0.4×10¹⁷m−3to more thanne=1×10¹⁷m−3. The
elec-tron temperature monotonically decreased with increasing pressure. The increase inneand decrease inTeobserved
inp<1 Pa can be interpreted by the electron impact ion-ization. However,ne had no clear dependence on neutral
pressure in the region wherep>1 Pa. The cross section of the electron impact ionizationσion is strongly dependent
on the electron energy. At aroundTe=10 eV, the rate
co-efficientσionvdecreases considerably when the electron
temperature decreases. Therefore, the decrease in electron temperature is considered to be a possible reason for the trend observed in p > 1 Pa. In addition to the electron temperature, the ion temperature also decreased monoton-ically. The Ti/Te ratio decreased slightly as the neutral
pressure increased. Electrons exhaust their energy due to ionization, excitation, and temperature relaxation between ions. Although ions can obtain energy through tempera-ture relaxation, their energy also moves to neutral particles
0.0 1.0 2.0
ne
[ 10
17 m -3 ]
0 5 10
Te
,
Ti
[ eV ]
0 1 2 3
p [ Pa ] 0.0
0.5 1.0
Ti
/
Te
[ - ]
Te
Ti
(a)
(b)
(c)
Fig. 11 Dependence of (a) the electron densityne, (b) the electron
temperature Teand the ion temperatureTi, and (c) the
temperature ratio Ti/Te on the neutral pressure p. RF
power was maintained at approximately 140 W.
through the charge-exchange interaction. The decrease in ion temperature reflects ion cooling due to the charge-exchange interaction. Quantitative evaluation of the energy balance among electrons, ions, and neutrals will be our fu-ture work.
4. Summary
on RF power was investigated. Although the ion tempera-ture was smaller than the electron temperatempera-ture at relatively lower RF power, it increased as RF power increased. One possible interpretation of this trend is the temperature re-laxation between electrons and ions. However, a more de-tailed investigation is required to understand the results, because the electron-ion temperature relaxation time was still much longer than the plasma confinement time even though in a relatively higher RF power region. The ion temperature dependence on neutral pressure was also in-vestigated. Ion temperature monotonically decreased with increasing neutral pressure. The charge-exchange interac-tion between bulk ions and neutral atoms could account for this trend. To understand the behavior of ion temperature against RF power and neutral pressure, an understanding of the energy transfer among electrons, ions, and neutrals is necessary. This will be investigated in our future work. In addition, we will also conduct ion temperature measure-ment in volumetric recombining plasma.
Acknowledgment
This work is partly supported by Japan Society for the Promotion of Science (JSPS) Grants-in-Aid for Scien-tific Research (KAKENHI), grant number 26420848 and Grant-in-Aid for Young Scientists (B) 17K14895.
[1] N. Ohno, Plasma Phys. Control. Fusion59, 034007 (2017). [2] N. Ohno, S. Mori, N. Ezumi, M. Takagi and S. Takamura,
Contrib. Plasma Phys.36, 339 (1996).
[3] N. Ezumi, S. Mori, N. Ohno, M. Takagi, S. Takamura, H. Suzuki and J. Park, J. Nucl. Mater.241-243, 349 (1997). [4] H. Takahashi, A. Okamoto, T. Miura, D. Nakamura, P. Boonyarittipong, S. Sekita and S. Kitajima, Plasma Fu-sion Res.11, 2402059 (2016).
[5] H. Takahashi, A. Okamoto, Y. Kawamura, T. Kumagai, A. Daibo and S. Kitajima, Fusion Sci. Technol. 63, 404 (2013).
[6] D. Nishijima, U. Wenzel, K. Ohsumi, N. Ohno, Y. Uesugi and S. Takamura, Plasma Phys. Control. Fusion 44, 597 (2002).
[7] C. Böhm and J. Perrin, Rev. Sci. Instrum.64, 31 (1993). [8] I. Katsumata and M. Okazaki, Jpn. J. Appl. Phys.6, 123
(1967).
[9] I. Katsumata, Contrib. Plasma Phys.36S, 73 (1996). [10] N. Ezumi, Contrib. Plasma Phys.41, 488 (2001).
[11] A. Okamoto, K. Iwazaki, T. Isono, T. Kobuchi, S. Kitajima and M. Sasao, Plasma Fusion Res.3, 059 (2008).
[12] D. Brunner, B. LaBombard, R. Ochoukov, R. Sullivan and D. Whyte, Plasma Phys. Control. Fusion55, 125004 (2013).
[13] N. Ezumi, Zh. Kiss’ovski, W. Bohmeyer and G. Fussmann, J. Nucl. Mater.337-339, 1106 (2005).