Licensed under Creative Common Page 441
http://ijecm.co.uk/
ISSN 2348 0386
THE RELATIONSHIP BETWEEN RISK TAKING AND
PERFORMANCE OF SMALL AND MEDIUM AGRO
PROCESSING ENTERPRISES IN KENYA
Angeline Wambui Wambugu
Jomo Kenyatta University of Agriculture and Technology, Kenya
Robert Gichira
Jomo Kenyatta University of Agriculture and Technology, Kenya
Kenneth N. Wanjau
Karatina University, Kenya
Joseph Mung’atu
Jomo Kenyatta University of Agriculture and Technology, Kenya
Abstract
The element of risk taking in entrepreneurial orientation reflects calculated and manageable
risks. Risk taking is a dominant attribute of entrepreneurship as the higher the risk-taking
orientation, the higher a firm’s profitability and growth. This purpose of this paper was to
establish the influence of entrepreneurial risk taking and firm performance of agro processing
small and medium enterprises in Kenya. The study findings revealed that risk taking has a
positive impact on firm performance of agro processing SMEs in Kenya. The implications of
these findings for managerial practice and suggestions for further research are discussed.
Keywords: Entrepreneurship, Entrepreneurial Orientation, Risk taking, Firm Performance, Agro
Licensed under Creative Common Page 442
INTRODUCTION
In many developing countries, small and medium enterprises (SMEs) constitute the bulk of
industrial base (Kormawa, Wohlmuth & Devlin, 2011). SMEs play an increasingly important role
as they address poverty by creating jobs; disperse economic activities in the countryside, and
provide broad-based sources of growth (Singh, Garg & Deshmukh, 2008; Kropp, Lindsay &
Shoham, 2006). Agro processing SMEs, in particular, contribute significantly to value added
creation, maximize the efficiency of the resource allocation and enhance distribution by
mobilizing and utilizing local human and material resources (Cunningham & Rowley 2007).
Despite their importance, agro processing SMEs are faced by global competition, market
liberalization, rapid technological advances and the introduction of stricter quality and safety
regulations (Da silva, Baker, Shepherd, Jenane & Miranda da Cruz, 2009). Today’s dynamic
environment requires SMEs to be entrepreneurial if they are to survive, grow of have superior
performance (Fairoz, Hirobumi & Tanaka, 2010). Firm - level entrepreneurship is Key to
enhancement of firm performance of small firms (Wiklund & Shepherd, 2003; Lumpkin & Dess,
1996; Patel & D’Souza, 2012). Empirical studies done in developed and transition economies
suggest that risk taking as a firm - level strategic posture has constitutes a potential source of
competitive advantage and has positive, long-term effect on growth and financial performance
of SMEs (Wang & Poutziouris, 2010).
Statement of the Problem
In the period 2008 – 2012, the agro processing industries in Kenya experienced low firm
performance, especially the food and beverage, which is the largest component in the agro
processing manufacturing sector. In 2012, the food and beverage industries registered a 0.3 per
cent decline after experiencing a 1.6 per cent decline in 2011. Other agro processing industries
involved in the preparation and preservation of fish, processed liquid milk, production of bakery
products, processed and preserved fruits and vegetables registered a drop by 10.4, 13.7, 14.9
and 2.5 per cent, respectively during the said period (ROK, 2013). In addition, the workforce in
agro processing industries reduced by approximately 2 per cent (ROK, 2012). During the same
period, the average growth percentage remained stagnant at 3 to 4 per cent. This growth rate is
low given that the Kenya Vision 2030 expects that agro processing industries to grow at a rate
of 10 per cent annually (ROK, 2007).
If allowed to continue, low firm performance of agro processing SMEs will lead to
dominance by primary agro-based commodities, thereby increasing the country’s vulnerability to
international market price fluctuations (Onjala, 2010). It will also lead to low incomes for those
Licensed under Creative Common Page 443 the long term survival of these enterprises and can lead to closure despite the fact that the
agricultural products are grown in Kenya (Kormawa, Wohlmuth & Devlin, 2011). A few
researches of entrepreneurial orientation in SMEs have been conducted in Kenya have
centered on overall entrepreneurial orientation and how it affects firm performance, rather than
the individual and independent influence of entrepreneurial orientation dimensions such as risk
taking and its influence on firm performance on SMEs. Osoro (2012) examined the effect of
entrepreneurial orientation of the business performance of SMEs in the Information Technology
in Nairobi. The study failed to identify the influence of risk taking dimension of entrepreneurial
orientation on firm performance of SMEs. This paper seeks to fill that gap by establishing
influence of risk taking on firm performance of agro processing SMEs in Kenya.
LITERATURE REVIEW
Risk Taking
There are many theoretical studies which examine the entrepreneurial orientation- performance
relationship. This study adopted the Lumpkin and Dess (1996) conceptual model of
EO-performance relationship (Figure 1) wherein entrepreneurial orientation which consists of five
dimensions (autonomy, innovativeness, risk taking, proactiveness and competitive
aggressiveness) that affects performance of firms (sales growth, profitability, overall
performance, stakeholder satisfaction) is moderated by environmental factors and
organizational factors. Entrepreneurial orientation as a firm level strategy is used by
entrepreneurial firms to enact their organizational purpose, sustain their vision and create
competitive advantage (Wiklund & Shepherd, 2005).
Figure 1: Factors Affecting Firm Performance
Source: Lumpkin, G.T., & Dess, G.G. (1996). Clarifying the entrepreneurial construct and linking it to performance. Academy of Management Review, 21(1), 135-172.
ENTREPRENEURIAL ORIENTATION
Innovativeness; Proactiveness; Risk Taking; Competitive; Aggressiveness; Autonomy
ENVIRONMENT FACTORS
Dynamism; Munificence; Complexity; Industry Characteristics
PERFORMANCE
Sales Growth; Profitability; Overall Performance; Stakeholder Satisfaction
ORGANIZATIONAL FACTORS
Licensed under Creative Common Page 444 In this study, risk taking dimension of entrepreneurial orientation was used. Risk-taking is often
used to describe the uncertainty that results from entrepreneurial behavior (Tajeddini, 2010).
The risk-taking dimension of entrepreneurial orientation captures the extent to which the firm’s
processes involve and/or ignore risks (McMullen & Shepherd, 2006). Risk taking involves
engaging in calculated and manageable risks in order to obtain benefits, rather than taking
daring risks which are detrimental for firm performance (Dess & Lumpkin, 2005; Morris, Kuratko
& Covin, 2008). Begley and Boyd (1978) posit that entrepreneurial firms’ propensity to take risks
is between low and moderate levels. Firms that adopt a modest level of risk taking are high
performers when compared to those firms that assume very high or very low levels of risk taking
(Kreiser, Marino & Weaver, 2002; Otieno, Bwisa & Kihoro, 2012). Risk taking also entails a
willingness to commit significant resources to opportunities having a reasonable chance of
costly failure and a willingness to break away from the tried-and-true path (Covin & Slevin,
1991; Lumpkin & Dess, 1996; Wiklund & Shepherd, 2005; Okpara, 2009).
Firm Performance
In the field of strategic entrepreneurship, firm performance has been considered as an important
construct. There has been no agreement, however, among researchers on the appropriate
measure of performance. Previous studies have suggested that growth and financial measures
are important performance measures for small enterprises (Murphy, Trailer & Hill, 1996;
Wiklund, 1999). A few studies have used non-financial measures of firm performance such as
customer and product performance, customer satisfaction and employee turnover (Glancey,
1998; Liu, Manolova & Edelmann, 2009; Yucel, 2011). Growth measures are considered to be
more accurate and easily available than account-based measures and hence superior to
financial measures. According to Green and Brown (1997) growth is an important demonstration
of entrepreneurial behavior for small firms. On the other hand, financial measures are
considered critical in determining the survival and success of the firm ( Zainol & Ayadurai,
2011).
Financial measures, however, are considered unstable and sensitive to changing
industry-related factors. They are easily manipulated and hence do not reflect the real
performance (Al-Swidi & Al-Hosam, 2012). In addition, a heavily reliance on financial measures
could hinder future competitive advantage as they do not reflect drivers of future performance
and value creation (Keh, Nguyen & Ng, 2007). Proponents of a combination of both growth and
financial performance measures argue that these measures give a richer description of the
actual performance of the firm than each does separately (Lumpkin & Dess, 1996; Wiklund &
Licensed under Creative Common Page 445 Firm performance may be measured using subjective measures or objective measures.
Objective measures are obtained from firm’s annual accounts and are considered as more
appropriate (Moreno & Casillas, 2008). Lack of formal procedures and control, however, makes
it very difficult to obtain objectives measures. Additionally, owner/managers are generally
unwilling to release financial information to outsiders (Chao & Spillan, 2010). On the other hand,
subjective measures involve seeking for the perception of the owner/manager relative to that of
competitors during a certain time period (Idar & Mahmood, 2011). Venkatraman and
Ramanujam (1986) posit that subjective measures are reliable and subject to minimal functional
biases. They can accurately reflect objective measures and are highly consistent with how the
firm actually performed as indicated by objective measures (Lumpkin & Dess, 2001).
Comparison with competing firms in the market reveals important supplementary information,
especially whether the firm is simply pulled against market trends (Wiklund, 1999).
Risk Taking and Firm Performance
The importance of risk taking and its influence on firm performance has been highlighted in both
theoretical discussions and empirical research. At the theoretical level, the willingness to
engage in relatively high levels of risk taking behavior enables SMEs to seize profitable
opportunities in the face of uncertainty which leads to long term profitability (McGrath, 2001).
Empirically, risk taking firms are able to secure superior growth and long term profitability in
contrast to risk avoiders (Yang, 2008; Wang & Poutziouris, 2010; Ahimbisibwe & Abaho, 2013).
On the basis of these findings, the following hypothesis if proposed:-
Ho1: There is no relationship between risk taking and the firm performance of small and medium
agro processing enterprises in Kenya.
RESEARCH METHODOLOGY
Population and Data Collection
Primary data was collected by means of a self – administered, semi structured questionnaire
completed by owner/managers of agro processing SMEs. A census of agro processing SMEs
registered with Kenya Association of Manufacturers was used. A number of assumptions
underlay the use of self-administered questionnaires. First, it was assumed that the respondents
were capable of answering the relevant questions knowledgeably and accurately. Secondly, that
the top managers were expert informants due their experience and insight about their
enterprises and the industry. Additionally, it was assumed that the answers given by the
Licensed under Creative Common Page 446 The questionnaire was pretested for reliability and validity on 20 agro processing SMEs that
were not registered members of Kenya Association of Manufacturers but comparable to
members of the study population. The pre-test sample was selected using purposive sampling
technique. After the pilot test, any items that were not clear, or were confusing or could cause
bias were modified or omitted. A total of 111 questionnaires were sent out but only 97 usable
questionnaires were received giving a response rate of 87.3% which was considered to be very
good. Fourteen questionnaires were dropped because they were missing vital information
needed in the analysis. According to Mugenda (2008), a response rate of 50% is considered
adequate, 60% and above good, and above 70% very good.
The possibility of non-response bias was measured using the extrapolation method of
Armstrong and Overton (1977) by comparing the means of early respondents and late
respondents based on number of years in operation. Non-response bias exists when there is a
significant difference between the answers of the early respondents and the non-respondents
who are assumed to be similar to late respondents (Bryman & Bell, 2011). In this study, the
early respondents were 51 and the late respondents were 46. The t-test yielded no statistically
significant difference and it was concluded that there was no significant non-response bias in
the study.
Measures
The entrepreneurial dimension risk taking in the firms was measured using 5 items on a five
point Likert scale. All measures used were grounded on literature. The questions solicited
respondents to evaluate 1) the firm’s tendency to commit a large portion of its resources in order to grow 2) the firm’s propensity to invest in high risk projects which promises high returns 3) the firm’s predisposition to finance its major projects through heavy borrowing 4) the firm’s affinity to continuously seek opportunities related to its present operations 5) the firm’s tendency to use
true and tried practices and technologies to explore new opportunities. Firm performance which
included sales and employee growth and profitability was measured by using a five point Likert
scale ranging from 1=not at all satisfied to 5=extremely satisfied. In this study, it was very
difficult to collect objective data because the owner/manager was unwilling to release firm’s
information to outsiders. Subjective approach was adopted in this study where firm performance
was measured based on the perception of the owner/manager. They were requested to state
their satisfaction with firms’ performance for the past five years in comparison to their
Licensed under Creative Common Page 447
ANALYSIS AND FINDINGS
Characteristics of the Respondents
The majority (62.3%) of the owner/managers were male while 37.7% were female. Majority
(47%) of the respondents were between 31 to 40 years, 37% were between 21 to 30 years,
14% were between 4 to 50 years and 2% were below 21years. Most (41.2%) of the
respondents held bachelor degree holders, 39.2% held diploma,11.3% held master degree
holders, 6.2% held certificates while 2.1% held a doctorate degree. The majority (38.5%) of the
respondents had worked for a period between 5 to 9 years, 26.9% for less than 4 years, 19.3%
for a period between 10 to 14 years. A few (3.8%) had worked for a period between 15 to 19
years while 11.5% had worked for over 20 years. Most of the firms were limited liability
companies, 14.4% were sole proprietorships while 10.9% were partnerships. Most (40%) of the
firms had been in operation for 15 years while 24% for 5 to 9 years, another 22% had been in
operation for less than 5 years, yet another 14% had been in operation for a period between 10
to 15 years. The distribution of the respondents according to business activities indicated
72.2% were engaged in food and beverage manufacturing while 4.1% were engaged in leather
and footwear manufacturing, another 8.2% were engaged in textile and garment manufacturing
and yet another 15.5% in paper and board manufacturing. The average firm employed between
51 in 2009 (SD= 50.646) and 78 employees in 2013 (SD= 69.490).
Measurement Model
The outer or measurement model assessed the relationship between the observable variables
and the theoretical constructs they represent. A reliability test was conducted to determine the
internal consistency of the measures used. The Cronbach alpha (𝛼) value for risk taking was
0.600 while firm performance had a value of 0.751 which is higher than the recommended
threshold of 0.500 demonstrating adequate reliability (Hair, Black, Babin & Anderson, 2010).
The variables were validated through factor analysis. Before performing exploratory factor
analysis, two statistical tests were performed to assess the suitability of the data for structural
detection; Kaiser-Meyer-Olkin (KMO) measure of sampling adequacy and Bartlett’s Test of Sphericity. The result of KMO was found to be 0.612 above the threshold of 0.5 and Bartlett’s
Test of Sphericity was significant at p<0.044 which indicated that the data was useful for factor
analysis (Kaiser, 1974). The variability of each observed variable that could be explained by the
extracted factors were checked by extracting the communality values. The extracted
communalities were found to be 0.655 which was greater than 0.5 thus demonstrating that the
Licensed under Creative Common Page 448 using Principle component analysis. Two items of risk taking and one item of firm performance
were deleted as they had factor loadings lower than 0.5 (Cooper & Schindler, 2011).
Confirmatory factor analysis was estimated on multiple criteria of construct reliability,
convergent and discriminant validity. All the variables exhibited construct validity as the
composite reliability was 0.787 above the acceptable threshold of 0.6 and the cronbach alpha
(𝛼) was 0.514 above the acceptable threshold of 0.5 (Ahimbisibwe & Abaho, 2013). The
Average Variance extracted (AVE) for risk taking was 0.655 and for firm performance was 0.616
which exceeded the cut off value of 0.5, thus confirming convergent validity (Bryman, 2012). To
satisfy the requirement of discriminant validity of the measurement model, this study followed
the criterion suggested by Fornell and Larcker (1981). The discriminant validity was confirmed
as the square root of a construct’s AVE was greater than the correlation between the construct
and other constructs in the model (Madhoushi, Sadati & Delavari, 2011).
There was a moderate correlation between risk taking and firm performance (r = 0.536,
p< 0.05).The normality of data was assessed by examining its skewness and kurtosis (Pallant,
2010). The result showed that skewness was within the range of -0.203 and + 0.306 and
kurtosis was within the range of -0.156 and + 0.626 which complied with the normality threshold
of -1 to +1 (Cooper & Schindler, 2011). Multicollinearity was tested using Tolerance and
Variance Inflation Factor. The tolerance value was 0.884 and the VIF value was 1.131 showing
that there was no multicollinearity associated with risk taking and firm performance variables
(Martz, 2013).
Structural Model and Hypothesis Testing
The structural or inner model identification was accomplished by examining path coefficients or
betas for hypothesis testing (Hair et al., 2011). The paths between the constructs represent
each hypothesis. Structural Equation Modeling partial least squares (SEM-PLS) was used for
model analysis and hypothesis testing. SEM-PLS was used because of four reasons. First, PLS
makes no prior distributional assumptions and is applicable to small populations. Secondly, PLS
analyzes complex model with large set of relationships among constructs and sub-constructs
(Esposito Vinzi, Trinchea & Amato, 2010). It provides more flexibility in modeling second order
constructs and formative constructs (Chin, 1998). Thirdly, PLS can account for measurement
errors of latent constructs and assess significance of structural models simultaneously. Lastly,
PLS examines the causal relationships among latent variables in situations of high complexity
and low theoretical information (Byrne, 2001).
The structural model was evaluated by examining the R2 values and the size of the
Licensed under Creative Common Page 449 obtained from a bootstrap test with 500 resamples. The resultant T-tests statistics from the
bootstrapping procedure provided the basis for determining which relationships are statistically
significant (Hensler, Ringle & Sinkovics, 2009). The statistical objective of SEM-PLS is to show
high R2 and significant t-values, thus rejecting the null hypothesis of no effect. R2 values range
between 1 and 0 where 1 means a perfect prediction of the structural model (Hair et al. 2010).
Table 2 below sets out the path coefficient and the t- values observed with the level of
significance achieved from bootstrapping.
Table 2: Path Coefficient and T-values of Risk Taking
Original Sample
Sample Mean
Standard Deviation
Standard Error
Path Coefficient
T Statistics P-value
risk -> FP 0.271805 0.299313 0.071621 0.071621 0.272 3.795042 0.05
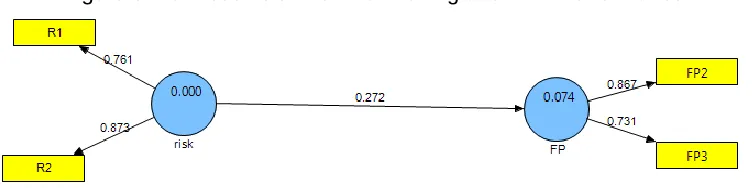
As indicated in Figures 3, the path coefficient between risk taking and firm performance was
positive and significant with a path coefficient of 0.272 and a significance level of 0.05 (β=0.272,
p<0.05). The path coefficient implied that for every 1 unit increase in risk taking, firm
performance was increased by 0.272 units. The value of R2 coefficient was 0.074 which
indicated that 7.4% of the variation in firm performance can be accounted for by risk taking.
Based on the assessment criterion suggested by Cohen (1988), the outer model was found to
reflect a very weak predictive relevance.
Figure 3: Path coefficient for Risk Taking and Firm Performance
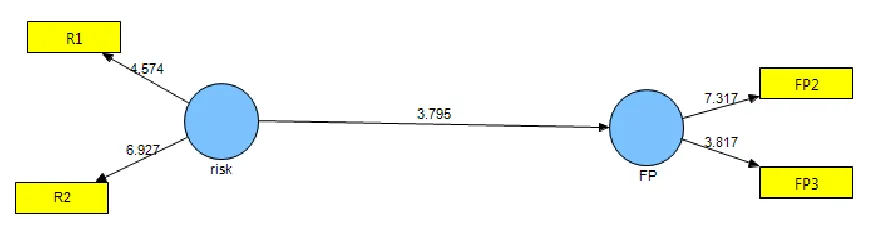
T-statistics was used to test the significance to the relationship between risk taking and firm
performance where critical values for t-statistics should be greater than 1.96 at 0.05 significant
level. The resultant T-tests statistics are illustrated in Figure 4 showed that the model was
significant at 95% significance level for a two tailed test with t = 3.795. The results showed that
risk taking has a positive and statistically significant relationship with firm performance. The null
hypothesis Ho1 was rejected and the alternative hypothesis that stated that there is a
relationship between risk taking and firm performance of small and medium agro processing
Licensed under Creative Common Page 450 Figure 4: T-statistics for the relationship between risk taking and firm performance
DISCUSSION AND CONCLUSIONS
The findings of this study show that risk taking has a great impact on firm performance of agro
processing SMEs in Kenya. Specifically, risk taking has a significant positive effect on firm
performance of agro processing SMEs in terms of growth and profitability (β=0.272, p<0.05,
t=3.795). The results are consistent with the findings from other studies that establish that risk
taking influences the firm performance of small firms (Rao, 2012; Awang, Ahmed, Asgher &
Subari, 2010). The performance of agro processing SMEs could benefit from its owner/mangers
being risk takers. Owner/managers agro processing SMEs need to adopt an entrepreneurial
mindset wherein at the heart lays the ability of the owner/managers to accept and manage risk.
It is the primary way agro processing SMEs can successfully seize profitable opportunities in the
face of uncertainty. The findings demonstrate that the ability of SMEs to stay competitive is
directly related to the intensity of taking risks. The findings contribute to the resource based
theory by illustrating the important role of risk taking as a strategy that leads to competitive
advantage of SMEs.
SUGGESTIONS FOR FURTHER RESEARCH
The present study has a number of limitations that need to be addressed in further research
studies. First, the study focused on agro processing SMEs in Kenya which affects generalization
of the study findings to other industries and regions. There is need for more context specific
research in developing countries before establishing a general theory on the relationship
between risk taking and firm performance. Second, due to the difficulty experienced in getting
financial performance measures of agro processing SMEs in Kenya, this study relied solely on
subjective, self-report measures. There is a need for future studies to use objective indicators of
financial measures or non-financial measures such as customer satisfaction, market share and
innovation performance. Third, the study established the relationship between risk taking and
Licensed under Creative Common Page 451 taking and firm performance relationship under the contingency models of entrepreneurship
such as the resource endowment or organizational structures (Covin & Slevin, 1991; Lumpkin &
Dess, 1996).
REFERENCES
Abbot, M. L., & McKinney, J. (2013).Understanding and Applying Reserch Design. (1sted.). Somerset, NJ:
John Wiley & Sons, Inc.
Aggarwal, N., & Gupta, M. (2006). Market performance measures: Current status in Indian companies. Decision, 33(1), 47−74.
Ahimbisibwe, G. M., & Abaho, E. (2013). Export entrepreneurial orientation and export performance of SMEs in Uganda. Global Advanced Research Journal of Management and Business Studies, 2(1), 56- 62.
Al-Swidi, A. K., & Al-Hosam, A (2012). The effect of entrepreneurial orientation on the organizational performance: A study on the Islamic banks in Yemen using the partial least squares approach. Arabian Journal of Business and Management Review (Oman Chapter), 2(1), 73-84.
Armstrong, J. S. & Overton, T. S. (1977). Estimating nonresponse bias in mail surveys. Journal of Marketing Research, 14(3), 396–402.
Arshad, A.S., Rasli, A., Arshad, A.A., & Zain, Z.M. (2013). The impact of entrepreneurial orientation and business performance: A study of technology-based SMEs in Malaysia. Social & Behavioural Sciences, 46-53.
Atuahene-Gima K., &Ko, A. (2001). An empirical investigation of the effect of market orientation and entrepreneurship orientation alignment on product innovation.Organization Science, 12(1), 54-74.
Awang, A., Ahmad, Z, A., Asghar, A.R., Subari, K.A., & Kassim, S. A. (2011). Firm entrepreneurial orientation and knowledge/networking of agro based enterprises in Malaysia: The role of technology an strategy. African Journal of Business Management, 5 (22), 9685-9706.
Baba, R., & Elumalai, S. (2011). Entrepreneurial orientation of SMEs in Labuan and its effects on performance. Working Paper Series No. 1113. Malaysia.
Blackburn, R. A., & Smallbone, D. (2008). Researching small firms and entrepreneurship in the UK: developments and distinctiveness. Entrepreneurship Theory & Practice, 32(2), 267-288.
Bordens, K. S., & Abbott, B. B. (2014). Research design and methods: A process approach (9th ed.). San Francisco: McGraw Hill.
Boohene, R., Marfo-Yiadom, E., & Yeboah, M.A. (2012). An empirical analysis of the effect of entrepreneurial orientation on firm performance of auto artisans in the Cape Coast Metropolis, Developing County Studies, 2(9), 77- 88.
Byrne, B. M. (2001). Structural equation modeling with AMOS: Basic concepts, applications, and programming. Mahwah, NJ: Lawrence Erlbaum Associates, Inc.
Bryman, A. (2012). Social Research Methods, (4th ed). New York: Oxford University Press.
Bryman, A. & Bell, E. (2011).Business Research Methods, (3rd ed). New York: Oxford University Press. Chao, M.C., & Spillan, J.E. (2010).The journey from market orientation to firm performance. A comparative study of US and Taiwanese SMEs.Management Research Review, 33(5), 472-483.
Chin, W. W. (1998). The partial least squares approach for structural equation modeling. In George A. Marcoulides (Ed.), Modern Methods for Business Research, Lawrence Erlbaum Associates, 295-336. Cohen, J. (1988). Statistical power analysis for the behavioural sciences, (2nd ed.). Hillsdale
Licensed under Creative Common Page 452 Coulthard, M. (Spring, 2007). The role of entrepreneurial orientation on firm performance and potential influence of relational dynamism. Journal of Global Business and Technology. 29- 39.
Covin, J.G., & Miles, M.P. (1999). Corporate entrepreneurship and the pursuit of competitive Advantage. Entrepreneurship Theory & Practice, 23(3), 47-63.
Covin, J. G., & Slevin, D. P. (1986). The development and testing of an organizational-level entrepreneurship scale in Ronstadt, R., Hornaday, J.A., Peterson, R. & Vesper, K.H. (Eds). Frontiers of Entrepreneurship Research. Wellesley: Babson College.
Covin, J. G., & Slevin, D. P. (1988).The influence of organization structure on the utility of an entrepreneurial top management style. Journal of Management Studies, 25, 217–234.
Covin, J. G., & Slevin, D. P. (1989). Strategic management of small firms in hostile and benign Environments. Strategic Management Journal, 10(1), 75-87.
Covin, J. G., & Slevin, D. P. (1991). A conceptual model of entrepreneurship as firm behavior. Entrepreneurship Theory & Practice, 16(1), 7-25.
Covin, J., Green, K. M., & Slevin, D. P. (2006). Strategic process effects on the entrepreneurial orientation-sales growth rate relationships. Entrepreneurship: Theory & Practice, 30(1), 57-81.
Cunningham, L. X., & Rowley, C. (2007).Human resource management in Chinese small and medium enterprises. Personnel Review, 36(3), 415-439.
Da Silva, C.A., Baker, D., Shepherd, A.W., Jenane, C., & Miranda-da-Cruz,S.(2009). Agro – industries for Development. Wallingford, United Kingdom: CABI Publishing.
Dess, G. G., & Lumpkin, G.T. (2005). The role of entrepreneurial orientation in stimulating effective corporate entrepreneurship. Academy of Management Executive, 19(1), 147-156.
Eggers, F., Kraus, S., Hughes, M., Laraway, S., & Syncerski, S. (2013). Implications of customer and entrepreneurial orientations for SME growth. Management Decision, 51(3), 524-546.
Esposito Vinzi, V., Trinchera, L., & Amato, S. (2010). PLS Path Modeling: From Foundations to Recent Developments and Open Issues for Model Assessment and Improvement. In. V. Esposito Vinzi, W.W. Chin, J. Henseler & H. Wang (Eds) Handbook of Partial Least Squares: Concepts, Methods and Applications (47-82) Berlin, Germany: Springer Berlin Heidelberg.
Fairoz, F.M., Hirobumi, T., & Tanaka, Y. (2010). Entrepreneurial orientation and performance of small and medium enterprises of Hambantoa District , Sri Lanka. Asian Social Science, 6(3), 34- 47.
Fornell, C., & Larcker, D. F. (1981). Evaluating structural equation models with unobservable variables and measurement error. Journal of Market Research, 18(1), 39–50.
Glancey, K. (1998). Determinants of growth and profitability in small entrepreneurial firms. International Journal of Entrepreneurship Behaviour and Research, 4(1), 18-27.
Green, P & Brown, T.E. (1997). Resource needs and the dynamic capitalism typology. Journal of Business Venturing, 12,161-173.
Hair, J. F., Black, W. C., Babin, B. J., & Anderson, R. E. (2010). Multivariate Data Analysis. A Global Perspective. (7thed.) Upper Saddle River, Boston: Pearson Education lnc.
Henseler J., Ringle, C. M., & Sinkovics, R. R. (2009). The Use of Partial Least Squares Path Modeling in International Market. Advances in International Market, 20, 277–319.
Idar, R & Mahmood, R. (2011). Entrepreneurial and market orientation relationship to performance: The SME Perspective. Interdisciplinary Review of Economics and Management, 1(2), 1-24.
Kaiser, H.E. (1974). An index of factorial simplicity. Psychometrika, 39, 31-36.
Licensed under Creative Common Page 453 Kirsten, J., Karaan, A.S., & Dorward, A..R. (2009). Exchange, contracts and property rights enforcement in Kirsten, J.F., Dorward, A.R., Poulton, C., & Vink, N.(eds) Institutional Economics Perspectives on African Agricultural Development, Washington: International Food Programme Research Institute.
Kormawa, P.M., Wohlmuth, K., & Devlin, J. (2011). Agribusiness for Africa’s prosperity: Country case studies. Working Paper. ( 2nd Ed.). Vienna: UNIDO.
Krauss, S.I., Frese, M., Freidrich, C & Unger, J.M. (2005). Entrepreneurial orientation: a psychological model of success among Southern African small business owners. European Journal of Work and Organizational Psychology, 14(3), 315–344.
Kirsten, J., Karaan, A. S., & Dorward, A. R. (2009). Exchange, contracts and property rights enforcement in Kirsten, J.F., Dorward, A.R., Poulton, C., & Vink, N.(eds) Institutional Economics Perspectives on African Agricultural Development. Washington: International Food Programme Research Institute, 35 - 73.
Kreiser, P., Marino, L., & Weaver, K. (2002).Assessing the psychometric properties of the entrepreneurial orientation scale: A multi-country analysis. Entrepreneurship Theory and Practice, 26(4), 71-95.
Kropp, F., Lindsay, N.J., & Shoham, A. (2008). Entrepreneurial orientation and international entrepreneurial business venture startup. International Journal of Entrepreneurial Behavior & Research, 14(2), 102-117.
Kropp, F., Lindsay, N.J., & Shoham, A. (2006). Entrepreneurial, market and learning orientations and international entrepreneurial business venture performance in South African firms. International Market Review, 23(5), 504 – 523.
Liu, Q., Manolova, T.S., & Edelman, L.F. (2009). Entrepreneurial Orientation and firm performance in China: the role of resource endowments. Frontiers of Entrepreneurship Research, 29 (13), 1-13.
Low, D.R., Chapman, R.L., & Sloan, T. R. (2007). Inter-relationships between innovation and market orientation in SMEs. Management of Research News, 30(12), 878-891.
Lumpkin, G.T., & Dess, G.G. (1996). Clarifying the entrepreneurial construct and linking it to Performance. Academy of Management Review, 21(1), 135-172.
Lumpkin, G.T., & Dess, G.G. (2001). Linking two dimensions of entrepreneurial orientation to firm performance: the moderating role of environment and industry life cycle. Journal of Business Venturing, 16, 429-451.
Lyon, D., Lumpkin, G., & Dess, G. (2000).Enhancing entrepreneurial orientation research: Operationalising and measuring a key strategic decision making process. Journal of Management, (26)5, 1055-1085.
Madhoushi, M., Sadati, A., & Delavari, H. (2011). Entrepreneurial orientation and innovation performance. The mediating role of knowledge management. Asian Journal of Business Management, 3(4), 310 – 316. Madsen, E.L. (2007). The significance of sustained entrepreneurial orientation on performance of firms – a longitudinal analysis. Entrepreneurship & Regional Development, 19(2), 185-204.
McGrath, R. G. (2001). Exploratory learning, innovative capacity and managerial oversight. Academy of Management Journal, 44(1), 118–131.
Miller, D., & Friesen, P. H. (1984).Organizations: A Quantum View, Englewood Cliffs, New Jersey: Prentice-Hall.
Moreno, A. N., & Casillas, J. C. (2008). Entrepreneurial orientation and growth of SMEs. A causal model. Entrepreneurship Theory & Practice, May, 507-528.
Morris, M. H., Kuratko, D. F., & Covin, J. G. (2008).Corporate Entrepreneurship & Innovation, 2nd ed. Mason: Thomson Higher Education.
Licensed under Creative Common Page 454 Murphy, G. B., Trailer, J. W., & Hill, R. C. (1996).Measuring performance in entrepreneurship research. Journal of Business Research, 36(1),15−23.
Onjala J. (2010). Impact of China –Africa Trade Relations: The case of Kenya, Final Report submitted to the African Economic Research Consortium (AERC), Nairobi.
Otieno, S., Bwisa, H.M., & Kihoro, J. M. (2012).Influence of entrepreneurial orientation on Kenya’s manufacturing firms operating under East African regional integration. International Journal of Learning & Development, 2(1), 299 – 320.
Pallant, J. (2010). SPSS Survival Manual. A step by step guide to data analysis using SPSS (4th ed.). Melbourne: Open University Press.
Patel, P., & D’Souza, R. (2009).Leveraging entrepreneurial orientation to enhance SME export performance. An Office of Advocacy Working Paper. No.337, 1-32.
Rao, S. (2013). The impact of entrepreneurial orientation and leadership styles on business performance: A study on micro, small and medium enterprises. Journal of Entrepreneurship & Business Environment Perspective, 2(1), 111-118.
Rauch, A., Wiklund, J., Freese, M., & Lumpkin, G, T. (2004). Entrepreneurial orientation and firm performance: Cumulative empirical evidence. Paper presented at the 23rd Babson College Entrepreneurship Research Conference. Glasgow.
Rauch, A., Wiklund, J., Lumpkin, G.T., & Frese, M. (2005). Entrepreneurial orientation and firm performance: An assessment of past research and suggestions for the future. Entrepreneurship Theory and Practice, 19(7), 12-18.
Rauch, A., Wiklund, J., Lumpkin, G.T., & Frese, M. (2009). Entrepreneurial orientation and firm performance: an assessment of past research and suggestions for the future. Entrepreneurship: Theory & Practice, 33(3), 761-787.
Republic of Kenya. (2007). Kenya -Vision 2030, A Globally Competitive and Prosperous Kenya. Nairobi: Government Printer. .
Republic of Kenya. (2012). Stastical Abstract. Nairobi: Kenya National Bureau of Statistics. Republic of Kenya. (2013). Economic Survey. Nairobi: Government Printer.
Tajeddini, K. (2010). Effect of customer orientation and entrepreneurial orientation on innovativeness: Evidence from the hotel industry in Switzerland. Tourism Management, 31(2), 221 – 231.
Venkatraman, N. (1989). Strategic orientation of business enterprises: the construct, dimensionality, and measurement. Management Science, 35(8), 942-962.
Venkatraman, N., & Ramanujam, V. (1987). Measurement of business economic performance: an examination of method convergence. Journal of Management, 13(1), 109-122.
Wang, Y., & Poutziouris, P. (2010). Entrepreneurial risk taking: empirical evidence from UK family firms. Entrepreneurial Behavior & Research, 16(5), 370- 388.
Wilkinson, J., & Rocha, R. (2009). Agro-industries trends, patterns and development impacts in Da Silva, C.A., Baker, D., Shepherd, A., Jenane, C. & Miranda-da-Cruz, S. (Eds). Agro-industries for Development, Wallingford, United Kingdom: CABI Publishing.
Wiklund, J. (1999). The sustainability of the entrepreneurial orientation – performance relationship. Entrepreneurship Theory & Practice, 24(1), 37-48.
Wiklund, J., & Shepherd, D. (2003).Knowledge-based resources, entrepreneurial orientation, and the performance of small and medium sized business. Strategic Management Journal, 24 (13), 1307-1314. http://dx.doi.org/ 10.1002/smj.36.
Wiklund, J., & Shepherd, D. (2005). Entrepreneurial orientation and small firm performance: a configurational approach. Journal of Business Venturing, 20, 71-91.