R E S E A R C H
Open Access
Concurrent validity of the non-exercise based
VO
2
max prediction equation using percentage
body fat as a variable in asian Indian adults
Shweta Shenoy
*†, Bhupinder S Tyagi
†and Jaspal S Sandhu
†Abstract
Background:Aerobic capacity (VO2max) is highly dependent upon body composition of an individual and body
composition varies with ethnicity. The purpose of this study was to check the concurrent validity of the non-exercise prediction equation developed by Jackson and colleagues (1990) using percentage body fat as a variable in Asian Indian adults.
Methods:One hundred twenty college-aged participants (60 male, 60 female, mean age 22.02 ± 2.29 yrs) successfully completed a maximal graded exercise test (GXT) on a motorized treadmill to assess VO2max. VO2max
was then estimated by the non-exercise prediction equation developed by Jackson and colleagues (1990) using percentage body fat. Percentage body fat was calculated by three different models (Sandhu et al’s fat mass equation, Durnin-womersley’s 4 site percentage body fat and Jackson & Pollock’s 4 site percentage body fat) and was used in the above equation. The results of VO2max obtained using“gold standard”treadmill methods were
then compared with the three results of VO2max obtained by Jackson et al’s equation (using three different models
to calculate percentage body fat) and it was determined which equation is best suited to determine percentage body fat and in turn VO2max for Indian population.
Results:Jackson et al’s prediction equation overpredicts VO2max in Asian Indian subjects who have a lower
VO2max (33.41 ± 14.39 ml/kg/min) than those reported in other age matched populations. percentage body fats
calculated by the three equations were significantly different and the correlation coefficient (r) between VO2max
calculated by Jackson and colleagues (1990) using Sandhu et al’s equation for percentage body fat with VO2max
calculated using treadmill (gold standard) (r = .817) was found slightly more significantly correlated than the other two equations and was not statistically different from the measured value.
Conclusions:This study proves that VO2max equation using Sandhu et al’s model for percentage body fat yields
more accurate results than other studied equations in healthy college-aged participants in India.
Background
Maximal oxygen uptake or consumption (VO2max) is
the maximum capacity of an individual’s body to trans-port and use oxygen during incremental exercise which reflects the physical fitness of an individual [1]. The measurement of VO2max as a parameter of
cardio-respiratory fitness is useful when educating individuals about their overall fitness status, considering cardiovas-cular risk such as physical inactivity and overweight
status [2]. Since this method involves the direct meas-urement of expired gas samples, it is considered highly reliable and accurate and is, thus considered the “gold standard” for determining VO2 max [3]. This approach
though is practically difficult, requires fairly expensive equipment and the assistance of trained personnel. Ac-curately measuring the VO2max involves a physical
ef-fort sufficient in duration and intensity to fully tax the aerobic system, the performance of which is influenced by the individual’s motivation. This intense effort makes the procedure difficult to perform because of which, some older or higher-risk individuals should not perform the test without medical supervision[4].
* Correspondence:[email protected]
†Equal contributors
Reader, Department of Sports Medicine & Physiotherapy, Guru Nanak Dev University, Amritsar, Punjab, India
As a result, researchers have generated various non-exercise based tests for predicting VO2max that utilize
variables of physical parameters (viz. age, gender, height, weight, BMI, body fat percentage) [4]. There are very few valid models available which utilize percentage body fat as a determinant of VO2max.These models include
those of Heil et al. (1995) [5] and Jackson et al. (1990) [6]. Body composition is known to vary with ethnicity [7]. People of South Asian origin have a higher percent-age of body fat for any given BMI while those of Black Caribbean origin have a lower percentage body fat for any given BMI [8-11], (c.f. Higgins,2008) [12]. Higher amounts of body fat and obesity are associated with increased risk of adverse health events and greater mor-tality [13]. Obesity has been defined by the American College of Sports Medicine [2] as an excessive amount of adipose tissue, which is defined in young adults as body fat > 25percentage in males and >32percentage in females.
Percentage of body fat is usually assessed by using skinfold thickness in clinical & field setting because this method is simple to use and low in cost [14]. Regres-sion equations are used to calculate body composition (body density, percentage body fat) from these skinfold measurements [15]. However, as all these prediction equations are based on mathematical relationships, they predict body composition only if population resembles the reference population that was used in the develop-ment of the prediction equation [16]. Most of the exist-ing equations or the estimation of body fat percentage for example Jackson and Pollock [6] and Durnin and Womersley [17] which are widely used in epidemio-logical studies using skinfolds have been developed and validated in the Caucasian population and tend to under predict body fat percentage in Asian Indians. Considering the ethnic differences in fat percentage in 2010, Sandhuet al. [18] developed a body fat mass pre-diction equation for young Indian adults using skinfold data and body fat percentage using under water weighing.
Several non exercise prediction equations for the es-timation of VO2max use percentage body fat in their
formulation. Again these equations were also devel-oped and validated in ethnic populations other than Indians. The ethnic differences in percentage body fat may make them unsuitable for use in Asian Indians. Jackson et al. (1990) [6] & Heil et al.(1995) [5] pro-posed prediction models which use body fat percentage of an individual in their formulation. These equations have been shown to be fairly reliable and valid. Researchers [19] have checked the cross-validation of non-exercise models (N-Ex) [6] and have found it ac-curate for healthy adults and suggested its use in epi-demiological studies.
We believe that these N-Ex prediction equations may not be very accurate in the Asian Indian population be-cause of the inherent differences in body compositions that exist in different races, specifically the fact that for a given BMI the percentage body fat in Asian Indians is higher [20] and hence a limited sub maximal aerobic capacity and reduced VO2max relative to body weight
[21] Jackson [6] equation has been widely used in epi-demiological studies. Since it utilizes body fat percentage in its formulation, our study was designed with the ob-jective of trying to examine the correlation between lab measurement of VO2max and the VO2max calculated
through [6] NEX prediction equation. As it incorporates an individual’s body fat percentage we decided to use the body fat percentage calculated through 3 methods and analyse which of these predicted VO2max values more
closely to the lab measured VO2max. Lastly we wanted
to analyze the validity of this non-exercise prediction equation using body fat percentage calculated through the above methods.
Methods
Participants and procedures
One hundred twenty college students (males = 60; females = 60), aged 18 to 27 year, satisfied the require-ments of this study. Volunteers, recruited for the study, were primarily the students of Department of Sports Medicine & Physiotherapy, Guru Nanak Dev University, Amritsar, Punjab India. Criteria for inclusion in the study were, participants who were non athletic, but who occa-sionally participated in recreational activities, who were able to perform exercise, with no prior history of cardio-vascular, peripheral cardio-vascular, respiratory diseases, malig-nancy, orthopaedic or musculoskeletal lesion. Subjects should have been non smokers, non alcoholic, not taking any medications and non diabetics. All participants signed an informed consent document in accordance with University ethical Committee guidelines.
Non exercise questionnaires and physical measurements
Prior to testing, all subjects completed
*brief Physical Activity Readiness Questionnaire (PAR-Q) [22] to screen for cardiovascular contraindications. *Physical Activity Recall (PA-R) questionnaire (0–7 scale)[6].
The physical activity rating (PAR) was determined as follows
The participant was asked to give the appropriate PAR score (0–7) based on the following scale:
0 points: Avoids walking or exercise (for example, always uses elevators, drives whenever possible instead of walking).
1 point: Walks for pleasure, routinely uses stairs, occasionally exercises sufficiently to cause heavy breathing or perspiration.
II. Participates regularly in recreation or work requiring modest physical activity (such as golf, horseback riding, calisthenics, gymnastics, table tennis, bowling, weight lifting, or yard work).
2 points: 10–60 min per week 3 points: Over 1 h per week
III. Participates regularly in heavy physical exercise (such as running or jogging, swimming, cycling, rowing, skipping rope, running in place) or engages in vigorous aerobic type activity (such as tennis, basketball, or handball).
4 points: Runs less than 1 mile per week or spends less than 30 min per week in comparable physical activity.
5 points: Runs 1–5 miles per week or spends 30– 60 min per week in comparable physical activity. 6 points: Runs 5–10 miles per week or spends 1–3 h
per week in comparable physical activity. 7 points: Runs more than 10 miles per week or
spends more than 3 h per week in comparable physical activity.
Four-site skinfold measures were evaluated for females and males (biceps, triceps, subscapularis, and suprailiac) using Harpenden caliper to determine percent body fat (percentage fat).
Participants were instructed to drink plenty of water and abstain from strenuous exercise for 24 h prior to testing, and not to consume food, alcohol, caffeine, or tobacco products three hours before testing [2]. Each participant was fitted with a HR monitor (Polar Inc., NY) to measure exercise HR during the maximal GXT on a calibrated motor driven treadmill (Vacuumed Vista MX, California, USA). Participants’ height and body mass were measured and recorded while wearing light-weight clothing and no shoes, using a stadiometer and calibrated digital weight scale(model:EB-EQ90,equinox overseas (P) Ltd., India). Instructions about the maximal GXT (involving the protocol, electronic heart rate moni-tor, mouth piece, and rating of perceived exertion (RPE) scale [23] were given to all participants prior to testing. Also participants were allowed to practice treadmill walking/jogging as needed to become familiar with the equipment.
Maximal treadmill graded exercise test
Participants performed a maximal GXT using Bruce graded GXT protocol [24] consists of seven stages. Each stage comprised of 3 mins. During the maximal GXT, metabolic gases were collected using the Vacuumed Vista MX metabolic measurement system (California, USA). The VO2max and respiratory exchange ratio (RER) were
computed, averaged, and printed by an online computer system every 10 seconds. The participants’exercise heart rate (HR) and RPE score was recorded at the end of each stage. VO2max was considered valid when at least two of
the following criteria were met [4]:
1 Maximal heart rate within 15 beats of age predicted maximal heart rate [25].
2 Respiratory exchange ratio equal to or greater than 1.10 [26].
3 RPE equal to or greater than 17.
4 The subject did not show any increase in oxygen consumption even after increasing the intensity of exercise.
5 Participants who failed to meet at least two of these criteria were dropped from the study.
Body fat percentage was then calculated by using three different formulae i.e.
1 Sandhu et al’s fat mass equation [18] (S’s eqn) 2 Durnin-Womersley’s 4 site percentage body fat [17]
(D-W‘s eqn)and
3 Jackson & Pollock’s 4 site percentage body fat [27]. (J-Ps eqn)
The calculated body fat percentage was utilized in the estimation of VO2max by usingJackson et al’s [6] pre-diction equation i.e.
NEx VO2max using percentageF
¼50:513þ1:589 History of physical fitness 0ð 7Þ
0:289 ageð Þ 0:552 percentageFð Þ
þ5:863 gender 0ð 1Þ:
Statistics
Three different formulae for the calculation of body fat percentage for males and females were applied and thus three different values of the same for both males and females were obtained. ANOVA was applied to test for the statistical significance between these values followed by Scheffe’s post hoc test. Then VO2max was calculated
body fat followed by post hoc Scheffe’s test. Inter- class correlation matrix was also used on the calculated VO2
max (through substituting percentage body fats) to test the correlation between the measured VO2max and the
calculated VO2max.
Results
Table 1 shows the mean values and standard deviations of the VO2max obtained by a graded exercise treadmill test
in the lab indicated as VO2max (lab); the VO2max
obtained by substituting body fat percentage value obtained by Jackson and Pollock’s equation(JP eqn) for es-timation of body fat through skinfolds indicated as VO2
max(J-JP); the Vo2max obtained by substituting body fat
percentage value obtained from Durnin and Womerslay’s equation(DWs eqn) [17] for estimation of body fat per-centage indicated as VO2max (J-DW); and theVO2max
obtained by substituting body fat percentage obtained from Sandhu et al’s [18] body fat equation(Ss eqn) for the estimation of fat mass indicated as VO2max (J-S). This
table indicates that VO2 max (J-S) gives a mean value
(36.05 + _6.04 ml/kg/min) which is closest to the mea-sured VO2max (mean value of 33.41 + _14.39 ml/kg/min)
as compared to VO2max (J-JP) and Vo2max (J-DW)
which clearly overestimate the VO2max in our subjects.
ANOVA values indicated in Table 2 further highlight the fact that the differences between the values for VO2max
obtained from the 3 equations and measured lab value are statistically significant. Post hoc analysis using Scheffe’s test in Table 3 shows that the difference between VO2max
(lab) and VO2max (J-S) is not statistically significant
(p = 0.226) but the differences between VO2max (lab) and
VO2 max(J-JP) and VO2max(J-DW) are statistically
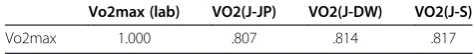
sig-nificant(p < 0.0001). The application of Inter class correl-ation matrix (Table 4) further indicates that Vo2max (J-S)
is slightly more correlated to the measured VO2max than
the others. Table 2 also indicates the analysis of variance for percentage body fat. The “F” value 191.103 is highly significant. The application of post hoc Scheffe’s test indi-cates that all 3 body fat percentages were significantly dif-ferent (p < 0.05).
Discussion
In this study we measured the VO2max by means of a
GXT in college aged participants in India. This study was conducted to check the validity of Jackson et al’s [6] VO2max prediction equation using percentage body fat
as a variable. An earlier study [21] has indicated that obese individuals have a reduced (VO2max) relative to
body weight thus indicating that percentage body fat has a significant effect on the aerobic capacity (VO2max) of
an individual. Secondary to this is the fact that body composition varies with ethnicity [7]. Recent evidence in the field of body composition has indicated that racial differences may exist in body composition. Specifically researchers [28] have indicated that Asians had more subcutaneous fat than whites and had different fat distri-butions from whites. Asians had more upper-body sub-cutaneous fat than whites. Researchers [28] have also indicated that BMI for given weight under predicts the percentage body fat in Asian Indians. A study [29] has indicated that for the same BMI, percentage BF for Paci-fic Island men was 4percentage points lower and for Asian Indian men was 7–8percentage points higher compared to Europeans. Compared to European men for the same percentage BF, BMI was 2–3 units higher for Pacific Island and 3–6 units lower for Asian Indians. Asian Indians have more abdominal fat deposition than their European and Pacific Island counterparts. Consid-ering this evidence we believed that prediction equations for the estimation of VO2max would be inaccurate and Table 1 VO2max values obtained by the substitution of
body fat values obtained by different formulae
Mean ± SD ml/kg/min
VO2max (Lab) 33.41 ± 14.39
1. VO2max (J-JP) 43.25 ± 7.81
2. VO2max (J-DW) 40.47 ± 8.79
3. VO2max (J-S) 36.05 ± 6.04
Table 2 Analysis of Variances (ANOVA) for VO2max and percentage Body fat from Jackson Pollock, Durnin Womersley
and Sandhu
1. VO2Max Sum of squares df Mean square F Sig.
Between Groups 6977.761 3 2325.920 24.343 .000*
Within Groups 45480.583 476 95.547
Total 52458.345 479
2. percentage Body Fat Sum of Squares df Mean Square F Sig.
Between Groups 8237.445 2 4118.722 191.103 .000*
Within Groups 3814.765 177 21.552
Total 12052.210 179
substituting percentage body fat values obtained from formulae developed specifically for Asian Indians would be better correlated to lab measured values of VO2max.
Our results indicated that our Asian Indian subjects indeed did have lower VO2max values as compared to
age matched subjects from Caucasian populations indi-cating a lower level of fitness. Specifically we recorded a mean value of 33.41 ± 14.39 ml/kg/min which is much lower than those recorded by other investigators in age matched subjects (Heilet al [5]. :45.83 ± 6.57 ml/kg/min and Bradshaw et al. [22] :45.17 +−7.59 ml/kg/min). We believe the lower levels could be because of two reasons. Firstly as reported by previous investigations our sub-jects did indeed have greater amounts of fat mass for a given weight as compared to other ethnicities which would indeed hamper fitness and not contribute to metabolic activity. Secondly is observation that in gen-eral South Asians have lower levels of physical fitness than their European counterparts [30,31]. Reasons for this have been suggested to a more restricted range of sporting and leisure activities than Europeans [30].
We also found that Jackson et als’[6] predictive equa-tion overestimated the VO2max compared to the
mea-sured value irrespective of which of the three studied equations was used to estimate the fat percentage of sub-jects. However of the three studied equations we found that substituting fat percentage values obtained from Sandhu et al’s [18] fat mass equation yielded a VO2max
value that was closer to the measured value as compared to the other two equations. This better correlation observed could be due to the fact that the indigenously developed body fat mass equation generated by Sandhu
et al., 2010[18] used actual values of body fat measured using the “gold standard” under water weighing method in its generation and the fact that it was developed on Asian Indian subjects increased its accuracy in this population.
Earlier researchers have proved that Durnin- Womer-slay’s [17] equation, which was derived using under-water weighing method, over estimate body fat and per-centage body fat in populations of developing countries [32]yet it is widely used in many epidemiological studies. Similarly Jackson and Pollock’s [6] equation also devel-oped in Caucasian populations is also used worldwide for the estimation of body fat percentage.
Our study has many implications. Despite the fact that we had delimited our study to the investigation of only one predictive equation, our study suggests that prediction equations may not be very accurate when used in popula-tions other than those on whom they were generated. Hence they need to be used with caution in other ethnic populations. Though this study indicates that when fat percentage is determined, Sandhu et al's [18] equation is used, the value for VO2max is slightly more reliable than
the other two. However, further study regarding its validity when it is used in prediction equation is warranted. Therefore, validation of Sandhu et al’s [18] equation and cross validation of Durnin-Womerslay’s [17] body fat equation is warranted.
Conclusions
Our results suggest caution in the use of Jackson et al’s [6] equation in Indian population given the observation that it tends to over predict the VO2max in Asian Indian
subjects. Similarly the validity of equations for the meas-urement of percentage body fat is also questionable when used in this population. Thus our study supports the development and validation of population specific prediction equations for the estimation of both body fat and VO2max.
Table 3 Post Hoc Test Scheffe’s for VO2max(lab),VO2max (J-JP),VO2max (J-DW) and VO2max (J-S)
Variables Sig. 95percentage confidence interval
Lower Bound Upper Bound
VO2max (lab) VO2max (J-JP) .000* −13.3742 −6.2935
VO2max (J-DW) .000* −10.6037 −3.5230
VO2max (J-S) .226 −6.1785 .9022
VO2max (J-JP)
VO2max (J-DW) .187 -.7698 6.3109
VO2max (J-S) .000*. 3.6554 10.7361
VO2max (J-DW)
VO2max (J-S) .007* .8849 7.9656
*. The mean difference is significant at the 0.05 level.
Table 4 Inter class correlation between VO2max(lab), VO2max (J-JP),VO2max (J-DW) and VO2max (J-S)
Vo2max (lab) VO2(J-JP) VO2(J-DW) VO2(J-S)
Competing interests
The authors declare that they have no competing interests.
Authors’contributions
SS conceived and designed the study, interpreted the data, drafted and revised the manuscript. BT carried out the data collection, statistical analysis and interpretation and drafted the manuscript. JS participated in its design, coordination and revised it critically for important intellectual content. All authors read and approved the final manuscript.
Received: 3 June 2011 Accepted: 3 September 2012 Published: 21 September 2012
References
1. Lars H, Lange A:Aerobic work capacity in young Norwegian men and women.J. of Applied Physiology1965,20(3):425–431.
2. American College of Sports Medicine:ACSM’s Guidelines for Exercise Testing and Prescription. 7th edition. Philadelphia, PA: Lippincott Williams & Wilkins Publishers; 2006.
3. American College of Sports Medicine:ACSM's guidelines for exercise testing and prescription. 8th edition. Baltimore, MD: Lippincott Williams & Wilkins; 2010.
4. American College of Sports Medicine:ACSM’s guidelines for exercise testing and prescription. 6th edition. Philadelphia: Lippincott Williams & Wilkins; 2000.
5. Heil DP, Freedson PS, Ahlquist LE, Price J, Rippe J:Nonexercise regression models to estimate peak oxygen consumption.Med Sci Sports Exerc1995, 27:599–606.
6. Jackson AS, Blair SN, Mahar MT, Wier LT, Ross RM, Stuteville JE:Prediction of functional aerobic capacity exercise testing.Med Sci Sports Exerc1990, 22:863–870.
7. Harsha DW, Bray GA:Body composition and childhood obesity.Endocrinol Metab Clin North An1996,25:871–878.
8. Snehalatha C, Viswanathan V, Ramachandran A:Cutoff values for normal anthropometric variables in Asian Indian adults.Diabetes Care2003, 26:1380–1384.
9. McKeigue PM, Shah B, Marmot MG:Relation of central obesity and insulin resistance with high diabetes prevalence and cardiovascular risk in South Asians.Lancet1991,337:382–386.
10. Prentice A, Jebb S:Beyond body mass index.Obes Rev2001,2:141–147. 11. Rush EC, Goedecke JH, Jennings C, Miclesfiled L, Dugas L, Lambert EV, Plank
LD:BMI, fat and muscle differences in urban women of five ethnicities from two countries.Int J Obesity2007,31:1232–1239.
12. Higgins V:Ethnic Differences in Obesity, Diet and Physical Activity–A Literature review.CCSR Working Paper2008,17:1–20.
13. Deurenberg P, Deurenberg YM, Wang J, Lin FP, Schmidt G:The impact of body build on the relationship between body mass index and percent body fat.Int J Obesity1999,23:537–542.
14. Heymsfield S, Smith R, Aulet M, Benson B, Litchman S, Wang J, Pierson RN Jr:Appendicular skeletal muscle mass: measurement by dual-photon absorptiometry.Am J Clin Nutr1990,52:214–218.
15. Jackson AS, Pollock ML:Generalized equations for predicting body density for men.Br J Nutr1978,40:497–504.
16. Wickramasinghi VP, Laabadusuriya SP, Cleghorn GJ, Davis PS:Development of height weight based equation for assessment of body composition in Sri Lankan Children.Indian J. of Paediatrics2010,77:155–160.
17. Durnin JV, Womerslay GA:Body fat assessed from total body density and its estimation from skinfold thickness: measurements on 481 men and women aged from 16 to 72 years.Brit J of Nutr1974,32:77–97. 18. Sandhu JS, Gupta G, Shenoy S:Prediction equation for calculating fat
mass in young Indian adults.Asian J of Sports Med2010,1(2):101–107. 19. Williford HN, Scharff-Olson M, Wang N, Blessing DL, Smith FH, Duey WJ:
Cross-validation of non-exercise predictions of VO2peak in women.Med Sci Sports Exerc1996,28:926–930.
20. Liew CF, Seah ES, Yeo KP L:Nondiabetic asian Indians have decreased insulin sensitivity and insulin clearance, and raised leptin compared to Caucasians and Chinese subjects.Int J Obes2003,27:784–789. 21. Goran M, Fields DA, Hunter GR, Herd SL, Weinsier RL:Total body gat does
not influence maximal aerobic capacity.Int J Obes2000,24:841–848.
22. Bradshaw DI, George JD, Hyde A, LaMonte MJ, Vehrs PR, Hager RL, Yanowitz FG:An accurate VO2max non-exercise regression model for 18– 65-year-old adults.Res Q Exerc Sport2005,76(4):426–432.
23. Borg GAV:Psychophysical Bases of Perceived Exertion.Med Sci Sports Exerc1982,14:377–381.
24. Bruce RA, Kusumi F, Hosmer D:Maximal oxygen intake and nomographic assessment of functional aerobic impairment in cardiovascular disease.
Am Heart J1973,85:546–562.
25. Howley ET, Bassett DR Jr, Welch HG:Criteria for maximal oxygen uptake: a review and commentary.Med Sci Sports Exerc1995,9:1292–1301. 26. Issekutz B, Birkhead NC, Rodahl K:The use of respiratory quotients in
assessment of aerobic power and capacity.J of App Physiol1962,1:47–50. 27. Body fat calculator 6 formula to calculate body fat percentage Database.
http://www.linear-software.com/online.html.
28. Wang J, Thornton JC, Russell M, Burastero S, Heymsfield S, Pierson NR Jr: Asians have lower body mass index (BMI) but higher percent body fat than do whites:comparisons of anthropometric measurements.Am J Clin Nutr1994,60:23–28.
29. Elaine R, Lindsay P, Vishnu C, Manaia L, David S, Boyd S, Chittaranjan Y: Body size, body composition, and fat distribution: a comparison of young New Zealand men of European, Pacific Island, and Asian Indian ethnicities.NZMJ2004,117:1207.
30. Hayes L, White M, Unwin N, Bhopal R, Fichsbacher C, Harland J, Alberti KGM: Patterns of Physical activity and relationship with risk markers for cardiovascular disease and diabetes in Indian, Pakistani Bangladeshi and European adults in a UK population.Journal of Public Health Medicine
2002,24(3):170–178.
31. Erens B, Primatesta P, Prior G:Health Survey for England 1999. InThe Health of Minority Ethnic Groups, Volume 1. London: TSO; 2001. 32. Immik MD, Flores R, Diaz EO:Body mass index, body composition and
chronic energy deficiency classification of rural adult population in Guatemela.Eur J Clin Nutri2003,77:71–75.
doi:10.1186/1758-2555-4-34
Cite this article as:Shenoyet al.:Concurrent validity of the non-exercise
based VO2max prediction equation using percentage body fat as a
variable in asian Indian adults.Sports Medicine, Arthroscopy, Rehabilitation, Therapy & Technology20124:34.
Submit your next manuscript to BioMed Central and take full advantage of:
• Convenient online submission
• Thorough peer review
• No space constraints or color figure charges
• Immediate publication on acceptance
• Inclusion in PubMed, CAS, Scopus and Google Scholar
• Research which is freely available for redistribution