Power Electronics Converters for an Electric Vehicle
Fast Charging Station with Energy Storage System and
Renewable Energy Sources
J. G. Pinto
1,*, Vitor Monteiro
1, Bruno Exposto
1, Luis A. M. Barros
1, Tiago J. C. Sousa
1,
L. F. C. Monteiro
2and João L. Afonso
11Centro ALGORITMI, University of Minho, Campus de Azurém, Guimarães, Portugal
2State University of Rio de Janeiro, Electronics Engineering Program, Campus F. Negrão de Lima 20559-900, Rio de Janeiro,
Brazil.
Abstract
Fast Charging Stations (FCS) are a key element for the wide spreading of Electric Vehicles (EVs), by reducing the charging time to a range between 20 to 40 minutes. However, the integration of FCS causes some adverse impacts on the Power Grid (PG), namely the huge increase in the peak demand during short periods of time. This paper addresses the design of power electronics converters for an EV DC FCS with local storage capability and easy interface of renewables. In the proposed architecture, the energy storage capability is used to smooth the peak power demand and contributes to stabilize the PG. When integrated in a smart grid, the proposed architecture may even return some of the stored energy back to the PG. The accomplishment of the aforementioned objectives requires a set of different power electronics converters, described and discussed along the paper. In order to demonstrate the potentialities of the proposed EV DC FCS architecture, four different case studies were analysed.
Keywords: DC Fast Charging, Electric Vehicles, Energy Storage System, Power Electronics, Renewable Sources.
Received on 16 April 2019, accepted on 19 November 2019, published on 21 November 2019
Copyright © 2019 J. G. Pintoet al., licensed to EAI. This is an open access article distributed under the terms of the Creative Commons Attribution licence (http://creativecommons.org/licenses/by/3.0/), which permits unlimited use, distribution and reproduction in any medium so long as the original work is properly cited.
doi: 10.4108/eai.13-7-2018.161749
1. Introduction
In recent years, major concern with climatic changes and energy efficiency has made the electrification of the transport sector a very important field of research. Although there are vehicles that are fed directly from the Power Grid (PG), as is the case of railway electric locomotives, a great number of Electric Vehicles (EVs) will be powered from batteries, motivating the research of battery charging systems for EVs [1], [2].
Worldwide, there are three organizations working in the standardization of electrical vehicle charging equipment, namely the Society of Automotive Engineering (SAE), the
*Corresponding author. Email:[email protected]
CHAdeMO association and the International Electrotechnical Commission (IEC). The IEC 61851 defines four different charging modes: Mode 1 refers to the slow charge in AC with a maximum current of 16 A per phase (3.7 kW - 11 kW) and the EV connection to the AC PG uses standard power connections; Mode 2 refers to the slow charge in AC with a maximum current of 32 A per phase (3.7 kW - 22 kW) and the EV connection to the AC PG requires a specific power connection with an intermediate electronic device with a pilot control function and protections; Mode 3 refers to the slow or semi-quick charge in AC with a maximum current of 63 A per phase (< 43 kW) and the EV connection to the AC PG requires a specific device; Mode 4 refers to a DC charging, with a maximum DC current of 400 A (< 240 kW), where an external charger is required [3]. However, the PGs were not
2
prepared to withstand this new type of loads or the peaks of demand that they can cause, therefore the impact caused by the proliferation of EVs cannot be neglected [4], [5]. The integration of EVs in the PGs will be an interesting challenge to the future smart grids [6], [7].
In order to reduce the negative effects from the PG point of view and to facilitate the integration of EVs, some authors have proposed the use of bidirectional on-board chargers, enabling the Vehicle-to-Grid (V2G) operation mode, which allows to return part of the stored energy back to the PG [7], [8], and the Vehicle-to-Home (V2H), where the charging power of the EV is continuously adjusted as a function of the home electric appliances [9]. With respect to DC fast chargers (off-board chargers) the main concern is related with the impacts to the PG in terms of harmonics and peak demand [10]. The time required for a fast EV battery charging depends on the battery capacity and on its State-of-Charge (SoC). However, usually, it does not exceed 20 to 40 minutes considering a charging power of 50 kW [11]. Despite the relatively short charging times, in a station with several charging posts, there will be situations where several EVs are charging simultaneously and, in other occasions, no one EV will be in charging, resulting in a highly intermittent power consumption from the PG. In this way, the simultaneous fast charging of a large number of EVs represents a significant oscillation in the power demand that can be problematic, especially in weak power systems, like islands or remote villages [12]. To mitigate these negative impacts, several studies have been conducted. A concept of low voltages DC-Buses, including power buffers based in battery Energy Storage Systems (ESS) is proposed in [13]. In [14], it is addressed the design of a DC Fast Charging Station (FCS) coupled with a local battery ESS. In [15] is proposed an optimal EV fast charging infrastructure, where the EVs are connected to a DC-Bus, employing an individual control for the charging process in order to optimize the power transfer from the AC PG to the DC-Bus. Other studies propose the integration of renewables connected to DC FCS [16], [17].
Due to the increasing number of EV charging and discharging cycles over time, the capacity of the EVs batteries reduces, and, consequently, the EV range decreases, thereby it is necessary to proceed with the replacement. However,
these batteries can be used in applications where the charge density is not significant. Considering that the batteries of the EVs have a charge density of about 70% of the initial value after 10 years of use [18], the replaced batteries can be reused in stationary ESS to smooth the peak demand of the EV FCS. In [19] is presented a study demonstrating that the integration of ESS and renewables in DC charging stations can be also economically advantageous.
This paper proposes a complete architecture for a FCS with local energy storage and interface of renewables (solar PV in this study), including the hardware topology and control algorithm for the four different power converters constituting the FCS. In addition to the technical constructive aspects of FCS, the paper presents an in-depth study of the impact of storage batteries and solar PVs on the energy performance of the system.
The rest of the paper is organized as follows: section 2 introduces the hardware topology of the power converters; section 3 describes the proposed control algorithms for the power converters; section 4 presents the simulation results of each one of the power converters; in section 5 a study on the FCS energy impacts considering 4 different scenarios is presented; finally the section 6 resumes the main conclusions of the work.
2. Power Converters for the Proposed
Charging Station
The proposed architecture for the EV DC FCS is presented in Figure 1, which consists in a set of power converters sharing the same DC-Bus, including a high capacity ESS. The first converter interfaces the DC-Bus with the PG. To prevent power quality problems in the PG, this converter may operate with sinusoidal currents and unitary power factor from the PG side. Several converter topologies can be used to accomplish this task. In order to increase flexibility and taking into account the convergence for smart grids, it can be useful to allow a two-way energy flow. Therefore, taking into account the application and the required nominal power, a three-phase two-level interleaved converter can be a good solution.
Figure 1. Block diagram of the proposed architecture for the EV DC FCS with ESS and renewable energy sources.
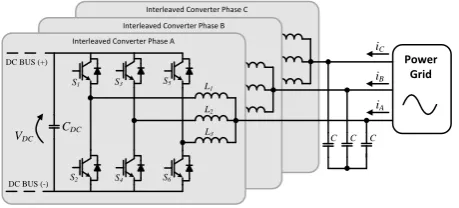
Figure 2 presents the power circuit of the bidirectional AC-DC converter used to interface the PG with the DC-Bus. It consists in a three similar three-phase IGBT bridges, sharing the same DC-Bus, and using a second order low-pass LC passive filter in the PG side. To charge the EVs batteries independently, it is necessary a DC-DC converter for each charging post. To accomplish with the usual battery charging recommendations, a possible solution for this task is a buck-type converter with constant current output [20].
Figure 2. Three-phase interleaved bidirectional AC-DC
power converter used to interface the PG with the DC-Bus of the FCS.
Taking into account the application and the nominal power of the converter (50 kW), instead of a buck-type converter, it can be used an interleaved topology which allows to decrease the switching frequency and the power rating of each semiconductor, while maintaining a low battery current ripple. Figure 3 presents the power circuit of the interleaved buck-type constant output current converter.
The batteries used to the load shift purposes must interface the DC-Bus with a bidirectional DC-DC converter. Due to the tolerances in the manufacturing process the individual battery cells are not exactly equal,
this is, the battery characteristics namely the capacity, the internal resistance, the nominal voltage, the self-discharge factor can be singly different from one to the others, and these differences tends to be more accentuated with the aging. Therefore, the parallel connection of batteries with different characteristics or different aging can cause the circulation of current between the batteries causing energy losses or even overheating of the batteries. [21], [22].
Figure 3. Interleaved buck-type DC-DC power converter
used to interface the DC-Bus of the FCS with the EV battery pack.
To prevent problems that may occur with parallel connection of individual battery cells, it is recommendable that each pack of individual battery cells connected in series has its own DC-DC converter. The adoption of individual DC-DC converters for each battery pack also endows the system with fault tolerance capability. To preserve the batteries state of health, the DC-DC power converter should operate with constant current from the batteries side. A good solution to accomplish with this task can be a buck-boost bidirectional converter. Taking into account the power rating of the converter, it can be used the interleaved bidirectional buck-boost DC-DC converter that is presented in Figure 4. This converter operates as a buck-type converter to transfer energy from the DC-Bus to the ESS and operates as a boost-type converter to transfer
DC-DC Unidirectional
Converter
AC-DC Bidirectional
Converter
Energy Storage System PV Solar Panels
Electric Vehicle Fast Charging Station
with Energy Storage System
Smart Grid
Unidirectional Power Flow
Bidirectional Power Flow
DC-DC Bidirectional
Converter Substation
Transformer
DC-DC Unidirectional
Converter
EV DC Fast Charging Post
DC-DC Unidirectional
Converter
EV DC Fast Charging Post
DC-DC Unidirectional
Converter
EV DC Fast Charging Post
DC-DC Unidirectional
Converter
EV DC Fast Charging Post
DC BUS
Power Grid
C C C
Interleaved Converter Phase B Interleaved Converter Phase C
CDC S1
S2
VDC
DC BUS (+)
DC BUS (-)
S3 S5
S4 S6
L1
L2
L3 Interleaved Converter Phase A
iA
iB
iC CDC
S1 S2 S3
D1 D2
VDC
L
L
L
C
DC BUS (+)
DC BUS (-)
Electric Vehicle Battery Pack
4
energy in the opposite way. With the proposed architecture for the EV DC FCS, the interface with renewables becomes simplified, because it is possible to use a simple DC-DC converter. For example, to interface an array of photovoltaic (PV) solar panels, it can be used a boost-type converter with controlled input current according to the extracted power from the renewable. In function of the maximum power from the PV solar panels, it can be adopted a simple boost-type or an interleaved converter with 2 or 3 legs, as represented in Figure 5. However, the power available in the PV solar installation is not constant over time, being necessary to implement a Maximum Power Point Tracker (MPPT) control algorithm in order to find the Maximum Power Point (MPP) and to force the power converter to operate at that point all the time.
Figure 4. Interleaved bidirectional buck-boost DC-DC
converter used to interface the DC-Bus of the FCS with the battery ESS.
Figure 5. Interleaved boost-type DC-DC converter used to
interface an array of PV solar panels with the DC-Bus of the FCS.
3. Power Converters Control
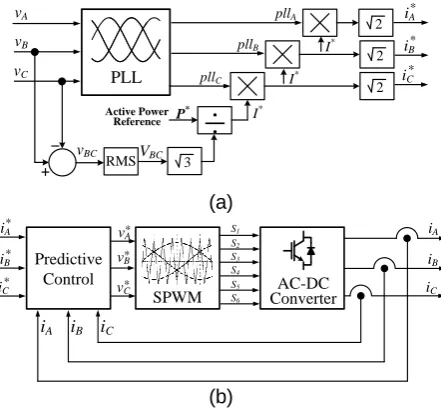
The three-phase bidirectional AC-DC power converter used to interface the PG with the DC-Bus of the EV FCS is presented in Figure 2. It should be controlled to absorb the required active power (P*), imposing sinusoidal currents and a unitary power factor, avoiding distortions in the PG voltages. To accomplish with this task, it is used a digital Phase-Locked Loop (PLL) control algorithm implemented in the α-β coordinates to synchronize the controller with the positive sequence of the PG fundamental voltages [23]. From the PLL algorithm it results three sinusoidal signals with unitary amplitude, representing the positive sequence of the PG voltages. These signals are then multiplied by the amplitude of the reference of current to obtain the AC reference currents. The reference currents are then applied to a predictive current control that produces the reference
voltages that the converter must produce [24]. The references of voltages are then compared with a triangular carrier to produce the gate signals to be applied to the IGBTs. To enhance the quality of the obtained currents, it is used a strategy to compensate the nonlinearities introduced by the dead-time [25]. The block diagram of the three-phase bidirectional AC-DC converter control system is presented in Figure 6.
According to the majority of battery supplier’s recommendations, the EV fast charging must be done with a constant current [26]. Therefore, the interleaved buck-type DC-DC power converter used to interface the DC-Bus with the EV battery pack is controlled to produce a constant output current (IBAT). Usually, the maximum charging current is determined by the EV Battery Management System (BMS) and its value is transmitted to the fast charger controller [26].
(a)
(b)
Figure 6. Block diagram of the three-phase bidirectional
AC-DC converter control system: (a) Generation of the reference currents; (b) Predictive current control.
To accomplish with the fast charging, it is used a Proportional Integral (PI) controller in the DC-DC converter to ensure that the output current correctly follows the set points defined by the BMS. The output of the PI controller is compared with three triangular carriers with the same amplitude and an 120º phase-shift between them to generate the IGBTs pulse pattern for an interleaved operation. As abovementioned, the use of an interleaved converter allows to reduce the size of the passive output filter and to maintain a low value for the IGBTs switching frequency. The block diagram of the buck-type DC-DC converter control system is presented in Figure 7.
The interleaved bidirectional DC-DC converter, used to interface the DC-Bus of the FCS with the ESS, is controlled using a PI controller to maintain the voltage of the DC-Bus (VDC) regulated. Since the converter is bidirectional, if the power absorbed from the PG is higher than the power used in the charging posts, the DC-Bus voltage tends to increase and the converter sends energy to the storage battery packs to maintain the DC-Bus voltage regulated.
CDC
S1 S3 S5
S2 S4 S6
VDC
L
L
L
C DC BUS (+)
DC BUS (-)
Storage Battery Pack
CDC VDC
L
L
L
C DC BUS (+)
DC BUS (-)
Photovoltaic Solar Panels
D1 D2 D3
S1 S2 S3
*
PLL vA
vB
vC
pllA
pllB
pllC
P*
Active Power Reference
VBC
÷
vBC
I*
2 2 2
3 RMS
I* I*
iC*
*
iB
iA
v*A
*
iC*
*
iB
iA
SPWM ConverterAC-DC
S1
S3
S5
iC
iB
iA
Predictive Control
vC*
vB*
S6
S4
S2
iC
iB
iA
Figure 7. Block diagram of the buck-type DC-DC converter control system used to control the charging
current of the battery.
During this mode, the bottom IGBTs of each converter leg are turned off, while the top IGBTs are switched at a fixed frequency. If the power absorbed from the PG is lower than the power used in the charging posts, the converter gets energy from the ESS to maintain the DC-Bus voltage regulated. During this mode, the top IGBTs are turned off and the bottom IGBTs are switched. To control the IGBTs of the proposed converter, three triangular carriers are used with the same amplitude and a phase-shift of 120º between them. Due to the 120º phase-shift between the triangular carriers, the ripple frequency in the batteries current is three times higher than the ripple frequency in each output inductor. Comparing with a traditional solution, this allows to reduce the size of the passive filters, while keeping a low value of switching frequency. The total charging current is also divided by the three legs, allowing a reduction in the IGBTs power rating. The block diagram of the bidirectional DC-DC converter control system is presented in Figure 8.
Figure 8. Block diagram of the bidirectional DC-DC
converter control system.
Currently, the vehicles filling stations always have some kind of protection for users against climatic phenomena, where it is usually to use a roof to cover the entire area of the gas station. In many cases, this roof is an excellent location to install PV solar panels. In this case, it can be interesting to interface the solar panels directly to the DC-Bus of the FCS, avoiding the utilization of an additional DC-AC converter. Depending on the PV solar panels peak power, it can be advantageous to choose an interleaved converter instead of the simple boost-type converter. The controller of the interleaved boost-type DC-DC converter used to interface an array of PV solar panels with the DC-Bus should maximize the power extraction from the PV solar panels. Therefore, it is important to use a MPPT algorithm to control this converter. The main general characteristics that distinguish the MPPT algorithms are: panel independence, convergence speed, tracking efficiency, implementation complexity and robustness [27]. The panel independency is an important characteristic, because avoids the determination of some parameters of the PV array
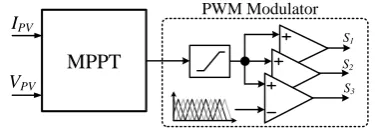
empirically, to different irradiance and temperature levels. Besides, if the parameters vary, the previous measurements can become outdated and, therefore, the MPPT will lose the convergence for the MPP. The convergence speed is important, because under sudden changes, if the MPPT is not able to a fast convergence, a considerable amount of energy can be lost in that transient. A good tracking performance ensures that the harvested energy is maximized. This is particularly important in situations when the solar radiation is minimal. Considering these premises, the incremental conductance control algorithm can be a good choice. The incremental conductance control algorithm works based on the fact that the slope of the PV solar panel power curve is zero at the MPP, positive on the left of the MPP, and negative on the right. Therefore, this method can determine that the MPP has been reached and interrupt the perturbing of the operating point. The advantages of the incremental conductance control algorithm are the calculation of the direction to perturb the operating point to reach the MPP and the actual determination of the MPP reaching. Also, incremental conductance can track sudden increases or decreases of solar irradiance conditions with higher accuracy than algorithms based on perturb and observe [24]. The output of the MPPT algorithm is then compared with the triangular carriers to obtain the IGBTs pulse patterns. In the case of a single boost-type converter adoption, it must be used a single triangular carrier. In the case of a two-leg interleaved converter, two triangular carriers with a phase shift of 180º must be used. A three-leg interleaved converter requires three triangular carriers with a phase shift of 120º between them. The block diagram of the boost DC-DC converter control system is presented in Figure 9.
Figure 9. Block diagram of the control system for the
boost DC-DC converter used to interface the renewable energy source (PV panels as considered in this paper).
4. Simulations of the EV DC FCS
In order to validate the hardware topologies and the control algorithms of the converters used in the fast DC FCS, it was developed a simulation model using PSIM. PSIM is a simulation software from Powersim Inc. specially designed for power electronics.
The most common EVs are equipped with battery packs, whose nominal voltage ranges between 300 V and 420 V [28]. Therefore, the DC-Bus voltage was defined to 450 V. Thus, the individual converter of each charging post always operates in buck mode. In order to optimize the power converters in terms of efficiency, it was selected an AC phase-to-phase voltage around 300 V. As the service
IBAT *
ki
kp
IBAT
PI Controller PWM Modulator
S1
S3
S2
VDC*
ki
kp
VDC
PI Controller PWM Modulator
S1 S2 S3 S4 S5 S6
Buck/Boost Selector PWM Modulator
S1
S3
S2
VPV IPV
6
station connects to the PG in medium voltage, it is possible to choose a transformer with the required secondary voltage. In the simulation, it is used a transformer with a secondary voltage of 300 V. However, the system can be easily dimensioned to operate with different voltage levels, if required.
In Figure 10 and Figure 11 are presented some simulation results of the three-phase interleaved bidirectional AC-DC power converter used to interface the PG with the DC-Bus. Figure 10 presents the instantaneous power, the voltages and the currents in the AC side of this converter. As it is possible to see, although the voltages are distorted, the currents produced by the converter are sinusoidal as required. In consequence of the PG voltage distortions, the instantaneous power oscillates around 170 kVA, which corresponds to the absorbed active power.
Figure 10. Simulation results of the three-phase
interleaved bidirectional AC-DC power converter used to interface the PG with the DC-Bus: (a) Instantaneous input
power, p; (b) PG voltages, vA, vB and vC;
(c) PG currents, iA, iB and iC.
Figure 11 shows in detail the interleaved characteristic in the produced currents. Figure 11 (a) shows the current in each of the output inductors in the phase A, and Figure 11 (b) shows the total current of the phase A, which corresponds to the sum of the currents in the three inductors. As it is possible to see, the total output current presents a ripple frequency three times higher than the ripple frequency in each of the inductors. In the simulation, the IGBTs switching frequency was fixed in 10 kHz, and each of the three inductors presents a value of 750 µH. In combination with the inductor are also used three 20 µF capacitors, allowing a further reduction of the current ripple.
In Figure 12 is presented a simulation result of the interleaved buck-type DC-DC power converter used to interface the DC-Bus of the FCS with an EV battery pack. Figure 12 (a) shows the current in each of the output
inductors of the converter, and Figure 12 (b) shows the total current, which corresponds to the sum of the currents in the three inductors. In the simulation, the switching frequency of the IGBTs was fixed in 15 kHz, and each of the three inductors presents a value of 500 µH. In combination with the inductors are also used three capacitors with a value of 100 µF to reduce the ripple in the battery current.
Figure 11. Simulation results of the three-phase
interleaved bidirectional AC-DC power converter used to interface the PG with the DC-Bus: (a) Current in the output
inductors of phase A, iL1, iL2 and iL3;
(b) Total Current of phase A,iA.
Figure 12. Simulation results of the interleaved buck-type
DC-DC power converter used to interface the DC-Bus of the DC FCS with the EV battery pack: (a) Current in the
output inductors, iL1, iL2 and iL3; (b) Total current,iT.
5. Evaluation of the EV DC FCS with ESS
and Renewables
In this section, some case studies and possible benefits resulting from the FCS combined with the ESS and solar PV panels are analyzed. Therefore, it was considered a FCS with 10 individual FCS posts. For simplicity of the analyses, it was assumed that all the EVs are using the FCS to charge their batteries at a constant power of 50 kW during 20 minutes, totalizing 16.7 kWh per EV. Possible variations in these values do not change significantly the results. In Figure 13 is presented the distribution of the
-300 -200 -100 0 100 200 300
-600 -400 -200 0 200 400 600
0.06 0.07 0.08 0.09 0.10
vA vB vC
iA
Time (s)
V
o
lt
ag
e
(V)
C
u
rr
e
n
t
(
A
)
iB iC
0 50 100 150 200
P
o
w
e
r
(kV
A
)
p
(a)
(b)
(c)
40 42 44 46
128 130 132 134
0.0245 0.0248 0.0250 0.0253 0.0255
iL1 iL2 iL3
iA
Time (s)
C
u
rr
e
n
t
(
A
)
C
u
rr
e
n
t
(
A
)
(a)
(b)
36 38 40 42 44 46
120 122 124 126 128 130
0.2000 0.2001 0.2002 0.2003 0.2004 0.2005
iL1iL2iL3
iT
Time (s)
C
u
rr
e
n
t
(
A
)
C
u
rr
e
n
t
(
A
)
(a)
(b)
number of EVs in charge along the day. This data was obtained assuming that most of the EVs are charged at home during the night and different drive profiles are combined with a random function. During the night, the traffic is less intense and, therefore, the number of EVs in charge is very low. During the morning, the road traffic increases, however, it is considered that most of the users charged the EV battery at home and, so, the number of EVs in charge continues low. As the day progresses, the number of EVs in charge increases, being verified the use of several stations simultaneously, with the maximum utilization rate being around 4 pm. After this time, the number of EVs starts to decrease, and from 8 pm the number of EVs in charge becomes again very small. In the considered scenario, the FCS served a total of 200 EVs during the day. Starting from this scenario of distribution of the number of EVs in charge, it is possible to calculate the power and energy absorbed by the FCS during the day. To make the scenario more realistic, in addition to the power necessary to charge the EVs, other small consumptions that normally exist in a service station were assumed, such as cafeteria, lighting, etc. However, these values are insignificant when compared to the EVs battery charging and do not exceed 100 kWh during the day in this scenario.
Figure 13. Distribution of the number of EVs in charge
along the day.
5.1. Case Study A
The case study A compares the power and energy absorbed by the FCS from the PG with and without the ESS. In this case study, the AC-DC bidirectional converter is programmed to work with constant power from the PG side. Figure 14 shows the power and the energy consumed by the FCS during the day, without the use of the ESS and considering the use of the ESS to absorb the energy from the PG at constant power rate. As it is possible to see from the figure, at the end of the day, the energy absorbed from the PG is the same, however, without the ESS, the power achieves a maximum value of 502 kW during the hours with more EVs in charge. By assuming an optimum control, it is possible to reduce the power taken from the PG to less than 142 kW. The reduction of the peak power from 502 kW to less than 142 kW can have a significant impact in the PG power quality and also an important reduction in the operation costs of the FCS, namely by a significant decrease on the contracted power. In the case of a new installation, considering the ESS from the beginning
of the project, the cost of the substation transformer and associated protections can be significantly reduced. However, to achieve these results it is necessary an energy storage capacity higher than 1700 kWh, which is a considerable value.
Figure 14. Simulated power and energy of the FCS, with
and without the ESS, in case study A.
5.2. Case Study B
Usually, the energy cost from the PG changes along the day, reaching very high rates during the PG on-peak times. In these situations, from an economic point of view, it may be advantageous to avoid the energy consumption from the PG during these periods of time. With the help of the ESS, it is possible to avoid the energy consumption during the on-peak time.
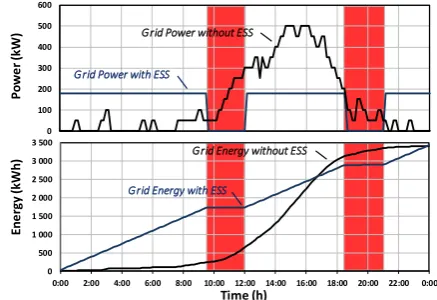
The case study B compares the power and energy absorbed by the FCS from the PG with and without the ESS, avoiding the on-peak time. In this case, the controller of the bidirectional AC-DC converter is programmed to absorb the energy from the PG at constant power rate, avoiding the on-peak time. Figure 15 present a comparison of the power and the energy consumed by the FCS with and without the ESS to the case study B.
Figure 15. Simulated power and energy of the FCS, with
and without the ESS, in case study B.
In Figure 15 the areas of the graph highlighted in red correspond to the PG on-peak times, in Portugal, during the winter period. The on-peak time has a total duration of 5
0 1 2 3 4 5 6 7 8 9 10 0: 0 0 1: 0 0 2: 0 0 3: 0 0 4: 0 0 5: 0 0 6: 0 0 7: 0 0 8: 0 0 9: 0 0 10 :0 0 11 :0 0 12 :0 0 13 :0 0 14 :0 0 15 :0 0 16 :0 0 17 :0 0 18 :0 0 19 :0 0 20 :0 0 21 :0 0 22 :0 0 23 :0 0 0: 0 0 N um be r o f El e ct ri c V e hi cl e s Time (h) 0 500 1 000 1 500 2 000 2 500 3 000 3 500
0:00 2:00 4:00 6:00 8:00 10:00 12:00 14:00 16:00 18:00 20:00 22:00 0:00 0 100 200 300 400 500 600 P o w e r (kW ) En e rg y (kW h )
Grid Power without ESS
Grid Power with ESS
Grid Energy without ESS
Grid Energy with ESS
Time (h) 0 100 200 300 400 500 600 0 500 1 000 1 500 2 000 2 500 3 000 3 500
0:00 2:00 4:00 6:00 8:00 10:00 12:00 14:00 16:00 18:00 20:00 22:00 0:00
P o w e r (kW ) En e rg y (kW h )
Grid Power without ESS
Grid Power with ESS
Grid Energy without ESS
Grid Energy with ESS
8
hours distributed by two periods, from the 9:30 to 12:00 hours AM and from the 6:30 to 9:00 hours PM.
As it is possible to see in the figure, with the ESS, the power taken from the PG goes to zero and the energy stops to grow during the on-peak times. Also, it is possible to see that, at the end of the day, the amount of energy absorbed from the PG, with or without the ESS, is the same. In order to enable this scenario, it is necessary a storage capacity of about 1942 kWh. However, to avoid energy consumption during the on-peak times, it is necessary to absorb a constant power of 179 kW during the off-peak times, as it is possible to see in the figure. Although this value is slightly higher than the previous one, which implies higher installation costs, the energy costs can be significantly lower, making it a long-term best option.
5.3. Case Study C
As mentioned before, one of the advantages of the proposed FCS architecture is the possibility to easily interface renewables. Nowadays, solar PV panels are becoming the most promising renewable electricity generation source, growing 30% a year and being expectable to achieve the mark of 1270 GWp in 2022 [29]. As a consequence of strong investments in the PV technologies, the costs are lowering consistently, making the investment in this technology an economically profitable option. In the case of the FCS, the PV panels can be used to build roofs, which also protect users and EVs from the weather.
In order to analyze the possible benefits from the installation of PV panels, the case study C considers the integration of 100 kWp PV panels with the FCS. The data for the PV production used in this simulation scenario was achieved from the Photovoltaic Geographical Information System (PVGIS) for the Portuguese city of Guimarães, considering a PV panel optimum orientation. Figure 16 presents the power and the energy produced by the PV panels, as well as the power and energy consumed by the FCS, with and without the ESS in the station. As it is possible to see, the PV power presents an evolution very similar to the power taken from the PG by the FCS without ESS. However, the maximum power is 5 times lower and with a misalignment of approximately one hour between the production and the most significant consumption. The total energy production of the PV installation during the day is almost 508 kWh and so, the total energy absorbed from the PG decreases in the same quantity. By controlling the bidirectional AC-DC converter to operate with constant power along the day, the maximum power taken from the PG with ESS and with PV panels is 120 kW and the minimum required storage capacity for the ESS is 1440 kWh. By comparing these values with the last ones, it is possible to reduce simultaneously the contracted power and the storage capacity, which is a very positive aspect. According to these results, the installation of a bigger PV installation can even allow a more significant reduction on the power and energy absorbed from the PG, as well as a
lower capacity of the ESS. However, it is necessary to guarantee available space for the PV panels, with proper orientation and avoiding shadows.
Figure 16. Simulated power and energy of the PV solar
panels equipping the FCS, with and without the ESS, in case study C.
5.4. Case Study D
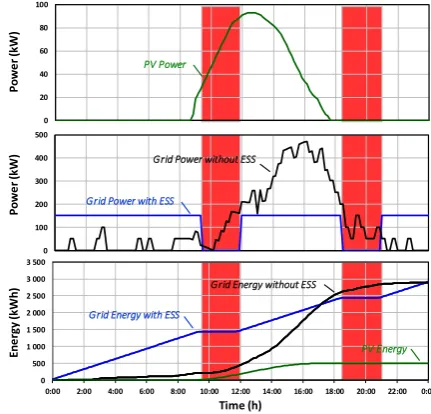
Finally, in the case study D, it was considered the integration of the 100 kWp PV solar panels and avoiding the energy consumption during the on-peak times. The results obtained in the simulation are presented in Figure 17.
Figure 17. Simulated power and energy of the PV
equipping the FCS, with and without the ESS, in case study D.
As it is possible to see in the figure, to avoid energy consumption during the on-peak times, it is necessary to absorb a constant power of 152 kW during the off-peak times and the storage capacity of the ESS increases to
0 500 1 000 1 500 2 000 2 500 3 000 3 500
0:00 2:00 4:00 6:00 8:00 10:00 12:00 14:00 16:00 18:00 20:00 22:00 0:00 0
100 200 300 400 500 600 0 20 40 60 80 100
Grid Power with ESS
Grid Energy without ESS
Grid Energy with ESS
Time (h)
PV Energy
Grid Power without ESS
PV Power
En
e
rg
y
(kW
h
)
P
o
w
e
r
(kW
)
P
o
w
e
r
(kW
)
0 20 40 60 80 100
0 100 200 300 400 500
0 500 1 000 1 500 2 000 2 500 3 000 3 500
0:00 2:00 4:00 6:00 8:00 10:00 12:00 14:00 16:00 18:00 20:00 22:00 0:00
Grid Power with ESS
Grid Energy without ESS
Grid Energy with ESS
Time (h)
PV Energy
Grid Power without ESS
PV Power
En
e
rg
y
(kW
h
)
P
o
w
e
r
(kW
)
P
o
w
e
r
(kW
)
1621 kWh. In order to counteract with the increase in costs with contracted power and with the storage capacity, this scenario allows a reduction of the energy costs, which can be advantageous in the long-term.
5.5. Final Remarks
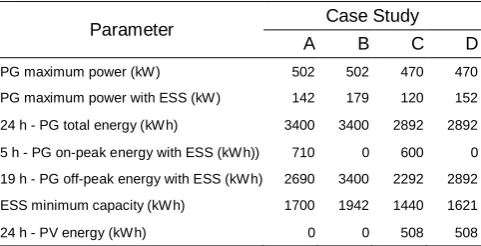
According to the simulation results obtained for the four previous case studies, the operation parameters greatly influence the requirements of the FCS. In order to facilitate the understanding of the benefits resulting from each scenario, in Table 1 is presented a summary of the FCS main operation parameters for each case study. The table presents: The maximum power taken from the PG with and without ESS during the 24 h operation; The total energy consumed from the PG during the 24 h operations as well as the energy consumed during the 5 h on-peak time and the 19 h off-peak time with the ESS; The minimum ESS capacity for each scenario and the energy produced by the PV panels during the 24 h.
Table 1. FCS operation parameters.
Parameter Case Study A B C D
PG maximum power (kW) 502 502 470 470
PG maximum power with ESS (kW) 142 179 120 152
24 h - PG total energy (kWh) 3400 3400 2892 2892
5 h - PG on-peak energy with ESS (kWh)) 710 0 600 0
19 h - PG off-peak energy with ESS (kWh) 2690 3400 2292 2892
ESS minimum capacity (kWh) 1700 1942 1440 1621
24 h - PV energy (kWh) 0 0 508 508
As it is possible to see by the values in Table 1, the introduction of the ESS allows a huge reduction on the contracted power with the possibility of eliminating energy consumption at on-peak times. However, these objectives can only be achieved by using a very high capacity ESS. On the other hand, the introduction of PV panels contributes, simultaneously, to the reduction of the consumed energy and contracted power. With the integration of PV panels, the minimum capacity needed for the ESS is significantly reduced. It can be verified that, for scheduling the charging of the EVs considered in this study, there is a good correlation between the consumption and the energy production by the PV panels. In this way, increasing the PV panels installed power would significantly reduce the power and energy absorbed from the PG, as well as reduce the necessities of the ESS.
6. Conclusions
In this paper, a new concept of a DC Fast Charging Station (FCS) for Electric Vehicles (EVs) is presented. The main advantages of the proposed EV DC FCS architecture
are the energy storage capability and the easy integration of renewables. The Energy Storage System (ESS) in the proposed architecture can be mainly composed by batteries, reused from EVs. The proposed EV DC FCS is composed by a set of power converters: (1) One bidirectional AC-DC converter used to interface the DC-Bus of the charging station with the Power Grid (PG); (2) One bidirectional DC-DC converter for each one of the storage battery packs to exchange energy with the FCS DC-Bus; (3) Buck-type DC-DC converters, one for each fast charging post to perform the charge of the EV batteries; and (4) a simple DC-DC converter to the renewables with the FCS DC-Bus.
The proposed EV DC FCS architecture was defined taking into account the required power for each one of the converters. The proposed topologies and control algorithms of these power converters were validated through computer simulations, developed with the software PSIM.
In order to study the potentialities of the proposed EV DC FCS architecture, four different case study scenarios were analysed, and conclusions were obtained. The proposed architecture with the suggested ESS allows a significant reduction in the maximum power absorbed from the PG. The integration of photovoltaic (PV) panels allows reducing not only the power and energy consumed from the PG, but also the capacity of the ESS. The correlation between the power of the PV panels and the number of EVs in charge makes possible, by increasing the installed power, to use the sun as the main energy source of the EV DC FCS.
Acknowledgements.
This work has been supported by FCT – Fundação para a Ciência e Tecnologia within the Project Scope: UID/CEC/00319/2019. This work is financed by the ERDF – COMPETE 2020
Programme, and FCT within project
SAICTPAC/0004/2015-POCI-01-0145-FEDER-016434 and FCT within project PTDC/EEI-EEE/28813/2017. Mr. Luis A. M. Barros is supported by the doctoral scholarship PD/BD/143006/2018 granted by the Portuguese FCT agency. Mr. Tiago Sousa is supported by the doctoral scholarship SFRH/BD/134353/2017 granted by the Portuguese FCT agency.
References
[1] Kaushik Rajashekara, “Present Status and Future Trends in Electric Vehicle Propulsion Technologies,” IEEE J. Emerg. Sel. Topics Power Electron., vol.1, no.1, pp.3-10, Mar. 2013.
[2] Ali Emadi, Young Joo Lee, Kaushik Rajashekara, “Power Electronics and Motor Drives in Electric, Hybrid Electric, and Plug-In Hybrid Electric Vehicles,” IEEE Trans. Ind. Electron., vol.55, pp.2237-2245, June 2008.
10
[4] Seshadri Srinivasa Raghavan, Alireza Khaligh, “Electrification Potential Factor: Energy-Based Value Proposition Analysis of Plug-In Hybrid Electric Vehicles,” IEEE Trans. Veh. Technol., vol.61, no.3, pp.1052-1059, Mar. 2012.
[5] Shengnan Shao, Manisa Pipattanasomporn, Saifur Rahman, “Grid Integration of Electric Vehicles and Demand Response with Customer Choice,” IEEE Trans. Smart Grid, vol.3, no.1, pp.543-550, Mar. 2012.
[6] João A. Peças Lopes, Filipe Soares, Pedro M. Rocha Almeida, “Integration of Electric Vehicles in the Electric Power Systems,” Proc. IEEE, vol.99, no.1, pp.168-183, Jan. 2011.
[7] Vehbi C. Güngör, Dilan Sahin, Taskin Kocak, Salih Ergüt, Concettina Buccella, Carlo Cecati, Gerhard P. Hancke, “Smart Grid Technologies: Communication Technologies and Standards,” IEEE Trans. Ind. Informat., vol.7, no.4, pp.529-539, Nov. 2011.
[8] Vítor Monteiro, J. G. Pinto, João L. Afonso, “Operation Modes for the Electric Vehicle in Smart Grids and Smart Homes: Present and Proposed Modes”, IEEE Transactions on Vehicular Technology, vol. 65, no. 3, pp. 1007-1020,
Mar. 2016. ISSN: 0018-9545, DOI:
10.1109/TVT.2015.2481005.
[9] J. G. Pinto, Vítor Monteiro, Henrique Gonçalves, João L. Afonso, “Onboard Reconfigurable Battery Charger for Electric Vehicles With Traction-to-Auxiliary Mode”, IEEE Transactions on Vehicular Technology, vol.63, no.3, pp.1104-1116, Mar. 2014. ISSN 0018-9545, DOI: 10.1109/TVT.2013.2283531.
[10] Sanzhong Bai, Srdjan M. Lukic, “Unified Active Filter and Energy Storage System for an MW Electric Vehicle Charging Station,” IEEE Trans. Power Electron., vol.28, no.12, pp.5793-5803, Dec. 2013.
[11] Efacec “QC 50 Quick Charger,” Efacec - Portfolio of Products, 2008.
[12] Vítor Monteiro, M. J. Sepúlveda, J. C. Aparício Fernandes, J. G. Pinto, João L. Afonso. “Evaluation of the Introduction of Electric Vehicles in the Power Grid – A Study for the Island of Maio in Cape Verde”, in CONTROLO 2016 Portuguese Conference on Automatic Control, 14-16 September, Guimarães, Portugal, pp.713-724, DOI: 10.1007/978-3-319-43671-5_60 ISBN: 978-3-319-43670-8 (Print) 978-3-319-43671-5 (Online).
[13] M. Vasiladiotis, A. Rufer and A. Béguin, "Modular converter architecture for medium voltage ultra fast EV charging stations: Global system considerations," 2012 IEEE International Electric Vehicle Conference, Greenville, SC, 2012, pp. 1-7. doi: 10.1109/IEVC.2012.6183228 [14] M. Gjelaj, C. Træholt, S. Hashemi and P. B. Andersen, "DC
Fast-charging stations for EVs controlled by a local battery storage in low voltage grids," 2017 IEEE Manchester PowerTech, Manchester, 2017, pp. 1-6. doi: 10.1109/PTC.2017.7980985
[15] Samir Shariff, Mohammad Saad Alam, Furkan Ahmad, Wajahat Khan, “Optimal Electric Vehicle Fast Charging Infrastructure, proceedings of The Intelligent Transportation Society of America 2018 annual meeting, Detroit, Michigan, June 4-7, 2018
[16] Vítor Monteiro, J. G. Pinto, João L. Afonso, “Experimental Validation of a Three-Port Integrated Topology to Interface Electric Vehicles and Renewables with the Electrical Grid”, IEEE Transactions on Industrial Informatics, vol.14, no.6, pp 2364-2374, June 2018. DOI: 10.1109/TII.2018.2818174. [17] Cheddadi Youssef, Errahimi Fatima, Es-sbai najia and Alaoui Chakib, “A technological review on electric vehicle
DC charging stations using photovoltaic sources, IOP Conference Series: Materials Science and Engineering, volume 353, 2018. doi:10.1088/1757-899X/353/1/012014 [18] ABB, “ABB and partners to evaluate the reuse of the Nissan
LEAF battery for commercial purposes,” Zurich, Switzerland, Jan. 2012.
[19] J. G. Pinto, Vítor Monteiro, Delfim Pedrosa, João L. Afonso “Economic Assessment of a Public DC Charging Station for Electric Vehicles with Load Shift Capability” in Proceedings of the 3rd International Conference on Energy and Environment: bringing together Economics and Engineering – ICEE 2017, 29-30 June 2017, Porto, Portugal, pp. 460-466, ISBN:978–972–95396–9–5, ISSN:2183-3982.
[20] A. B. Khan and W. Choi, "Optimal Charge Pattern for the High-Performance Multistage Constant Current Charge Method for the Li-Ion Batteries," in IEEE Transactions on Energy Conversion, vol. 33, no. 3, pp. 1132-1140, Sept. 2018. doi: 10.1109/TEC.2018.2801381
[21] Sebastian Paul, Christian Diegelmann, Herbert Kabza, Werner Tillmetz, Analysis of ageing inhomogeneities in lithium-ion battery systems, Journal of Power Sources, Volume 239, 2013, Pages 642-650, ISSN 0378-7753, doi:10.1016/j.jpowsour.2013.01.068
[22] F. Baronti, R. Di Rienzo, N. Papazafiropulos, R. Roncella and R. Saletti, "Investigation of series-parallel connections of multi-module batteries for electrified vehicles," 2014 IEEE International Electric Vehicle Conference (IEVC), Florence, 2014, pp. 1-7. doi:10.1109/IEVC.2014.7056173 [23] Luís Guilherme Barbosa Rolim, Diogo Rodrigues Costa,
Maurício Aredes, “Analysis and Software Implementation of a Robust Synchronizing PLL Circuit Based on the pq Theory,” IEEE Trans. Ind. Electron., vol.53, no.6, pp.1919-1926, Dec. 2006.
[24] S. Orts-Grau, F. J. Gimeno-Sales, A. Abellan-Garcia, S. Segui-Chilet, J. C. Alfonso-Gil, “Improved Shunt Active Power Compensator for IEEE Standard 1459 Compliance,” IEEE Trans. Power Del., vol.25, no.4, pp.2692-2701, Oct. 2010.
[25] Alfredo R. Munoz, Thomas A. Lipo, “On-Line Dead-Time Compensation Technique for Open-Loop PWM-VSI Drives,” IEEE Trans. Power Electron., vol.14, no.4, pp.683-689, July 1999.
[26] J. Qiang, L. Yang, G. Ao and H. Zhong, "Battery Management System for Electric Vehicle Application," 2006 IEEE International Conference on Vehicular Electronics and Safety, Shanghai, 2006, pp. 134-138. doi: 10.1109/ICVES.2006.371569
[27] Trishan Esram, Patrick L. Chapman, “Comparison of Photovoltaic Array Maximum Power Point Tracking Techniques,” IEEE Trans. Energy Convers., vol.22, no.2, pp.439-449, June 2007.
[28] Hans-Martin Fischer, Layla Dorn in Colaboration of ZVEI-Task Force Voltage Classes, ZVEI – “Voltage Classes for Electric Mobility”, ZVEI - German Electrical and Electronic Manufacturers’ Association, Centre of Excellence Electric Mobility, Lyoner Straße 9, 60528 Frankfurt am Main, German, December 2013.
[29] Rossi, R. and Schmela, M., “Global market outlook for solar power 2018-2022”, Solar Power Europe, 2018.