Pak. J. Anal. Environ. Chem. Vol. 15, No. 1 (2014) 66 – 73
Application of Polyhydroxybutyrate-b-polyethyleneglycol
(a block co-polymer) for Solid Phase Extraction of Lead and
Copper in Different Food Samples
Sham K. Wadhwa
1,2*, Tasneem Gul Kazi
1, Mustafa Tuzen
2, Hassan Imran Afridi
1,
Naeemullah
1,2and Kapil Dev Brahman
11
National Centre of Excellence in Analytical Chemistry, University of Sindh, Jamshoro 76080, Pakistan
2
Gaziosmanpasa University, Faculty of Science and Arts, Chemistry Department, 60250 Tokat, Turkey
Received 27 September 2013, Revised 26 June 2014, Accepted 30 June 2014
--- Abstract
In present work, a new adsorbent, polyhydroxybutyrate-b-polyethyleneglycol (block copolymer) was used for the preconcentration and separation of copper (Cu) and lead (Pb) ions without consuming expensive complexing reagent. The influence of various parameters like pH, adsorbent amount, and rates of flow of eluent, sample and sample volumes has been investigated. The polymer does not interact with alkaline-earth metals, transition metals, alkaline, and few anions. The enrichment factor 50 was achieved in this method. The detection limit of method was found to
be 0.36 µg L-1 and 1.93 µg L-1 for copper and lead, respectively. The recovery values of both analytes were found >96% and relative standard deviations (RSD) for all experiments were found less than 5%. The present method was validated by the analysis of Cu and Pb contents in various related certified reference materials (CRM) like; NIST SRM 1515 Apple leaves, IAEA-336 Lichen and GBW-07605 Tea. Found results and CRM values were precise and accurate. This developed method was then successfully applied for analysis of Cu and Pb in tap and bottled mineral water and real food samples.
Keywords: Polyhydroxybutyrate-b-Poly ethylene glycol; Solid phase extraction; Copper; Lead; Food; Water.
---
Introduction
Due to environmental fatal and heavy metals (HMs) toxic effects upon human health, heavy metal determination has attracted by many researchers [1-2]. Heavy metals are not metabolized by body and these are stable in environment because their density is five times higher than water [3-4]. The major pollution caused by HMs via water wastage, residue waste, and gases exhaust from different industries, traffic and other sources [5]. The heavy metals in excess amount passed up to the food chain which adversely affect the human health. When heavy metal is smeared into environment via water, air, food, or synthetic chemicals; the body can take the
toxicity through ingestion, absorption onto skin, and inhalation [6-8]. Excess level of copper is toxic while it is essential trace element. As industrial use increases, environmental pollution also increases. Long term exposure of the toxic elements causes adverse health effects on human specifically children and infants [9].
Each person has some Pb level in blood and in bones where as it is a non essential element [10]. Lead is an enzyme inhibitor and a general toxic element in metabolism which lead to brain damage and mental retardation particularly in children. Pb adversely bad affects the bone
formation on long term exposure [11]. When Pb in
blood is found less than 5µgdL−1, reduced
academic performance can be observed with Pb exposure [12-13]. The precision and accuracy for the measurements of trace and heavy metals are among most significant tasks in analyses [14].
The atomic absorption spectrometry (AAS) is a useful technique for determination of HMs. The analysis of trace metals especially by using flame atomic absorption spectroscopy (FAAS) is quite difficult [15-16]. Separation-enrichment procedures are widely used to rectify issues in FAAS, to solve this problem. Different preconcentration techniques like solid phase extraction, liquid-liquid extraction, cloud point extraction, electro-deposition, co-precipitation and membrane filtration are widely used [17-21]. Among all enrichment factors solid phase extraction (SPE) is a good choice because of simplicity, easiness, sensitivity and higher enrichment factors [22]. The SPE consists of the recovery of analyte on solid support by sorption in first step and desorption in second step. SPE prevents the use of aggressive reagents and concentrated acids [23]. Various adsorbents like solvent-impregnated resins, polyurethane foam, Amberlite resins, agar, modified clinoptilolite zeolite etc [24-27] are reported.
The central idea of present work is to pre-concentrate and separate the Pb(II) and Cu(II) onto Polyhydroxybutyrate-b-Polyethylene glycol (PHB-b-PEG) as a solid phase. This polymer is not used before for separation / preconcentration of elements according to our literature survey. In this work, the analytical performance of PHB-b-PEG as an adsorbent for the separation and preconcentration of Cu, Pb ions were investigated.
Experimental
Instrumentation
A Perkin Elmer A Analyst 700 (Norwalk, CT, USA) atomic absorption spectrometer with deuterium background corrector was utilized for the study. Perkin Elmer single element hollow cathode (HC) lamps were used for flame atomic absorption spectrometric determinations. All readings were taken using air/acetylene flame. Operating conditions were settled as per
manufacturer’s recommendations. A slot-burner with 10 cm long head, a HC lamps and an air-acetylene flame were used in all measurements.
A pH meter, made by Göttingen, Germany under brand name Sartorius pp-15 Model glass-electrode was used for accurate measurements of pH values in the aqueous media. The pH meter was calibrated after each 10 measurements by using pH 4.00 (PY-Y01), pH 7.00 (PY-Y02) and pH 10.00 (PY-Y04) buffer standards provided by Sartorius. For microwave digestion; Milestone Ethos D (Sorisole-Bg, Italy) closed vessel microwave system (maximum pressure 1450 psi, maximum temperature 300 oC) was used.
Reagents and solutions
All chemicals used were of Analytical reagent grade; throughout the experimentation deionised water (Milli-Q Millipore (Bedford, MA, USA) 18.2 MΩcm-1) was utilized for initial and successive dilutions. Glassware and plastic were first soaked in dilute HNO3 and then rinsed with
double distilled water before use. The required metal solutions for calibration were prepared from stock solution of 1000 µgmL-1 purchased from Sigma (St. Louis, MO, USA) and Aldrich (St. Louis, MO, USA). Buffers from pH 2-9 were prepared from different reagents (Sodium dihydrogen phosphate, ammonium acetate, acetic acid, HCl, ammonium chloride and NaBO2)
obtained from Merck. Three certified standard reference materials (NIST SRM 1515 Apple leaves, IAEA-336 Lichen and GBW-07605 Tea) were used.
Poly (3-hydroxy butyrate) (PHB), microbial polyester was supplied from BIOMER (Germany). Poly (ethylene glycol) bis (2-aminopropyl ether) with MW 2000 g/mol (PEG-2003) were a gift from Huntsman Corporation (Switzerland). Stannous 2-ethyl hexanoate and the other chemicals used were purchased from Aldrich.
Synthesis of PHB-PEG block copolymers
the presence of 0.1 g tin(II)-ethyl hexanoate. After evaporating the solvent, white solid polymer was dried under vacuum at room temperature for 24 hours. After washed with water in several time to remove unreacted PEG residue, It was dried in air and then under vacuum at room temperature for 24 hour [30].
Sampling
The ~1000 ml of tap water was firstly filtered using a 0.45-mm pore size membrane filter (Millipore Corporation, Bedford, MA, USA) then allowed to run for 10 min then collected in a beaker. All water samples were 40 different bottled mineral water (BMW) samples of different brands packed on different dates (ten samples from each label) were collected from market of Tokat Province of Turkey. On arrival to laboratory, the BMW were stored at +4 °C till further analysis.
Column preparation
The column was filled with
polyhydroxybutyrate–b-polyethylene glycol (PHB-b-PEG) a block copolymer.
Approximately 500 mg of PHB-b-PEG1 was loaded into a 10mm×100mm glass column containing porous disc. The polymer thickness was nearly 2 cm long. The column was each time conditioned with buffer solution before use. After every elution, the PHB-b-PEG in column was also washed with a 20 ml of water.
Procedure
A 50 mL of model solution was prepared
that contains lead (3 µgmL-1) and copper (1 µgmL-1) and pH was maintain between 2 to 9
with different buffers. Column firstly preconditioned by using buffer solution (10 mL) through polymer column and then model solution at a flow rate of 5 mL min-1 was passed. After adsorption of analytes, the column was rinsed with 10 mL of water. Adsorbed ions on PHB-b-PEG were then eluted with 5 mL of 1 mol L-1 HCI, after that eluent is subjected to the analyses of Pb and Cu levels by using FAAS. Finally this method was tested on real samples (tap water, bottled mineral
water, coffee, tea and baby foods) after achieving good recoveries with model solutions.
Application on Tap water and BMW samples
Millipore cellulose membrane filter paper (0.45 µm pore size) was employed to filter tap water samples and bottled mineral water. The pH of samples was maintained to 7.0 using proper buffer; then a procedure defined earlier was adapted to the final solutions. Blank samples were also analyzed in the same way. The metal ions levels in the samples were analyzed by using FAAS.
Preparation and application on certified reference materials (CRM) and food samples
Five replicate CRM’s and triplicate samples of each food type were subjected to microwave digestion prior to proposed method. 100 mg of each CRM including NIST SRM 1515 Apple leaves, IAEA-336 Lichen, GBW 07605 Tea and 1.0 g of each food sample including, milk (six different brands), baby fruits (four different flavors), tea bags (two) and coffee (two) brands were digested in 9.0 mL; mixture of HNO3 (65%)
and H2O2 (30%) in ratio 2:1 in microwave.
Digestion conditions were used as; 6 min for 250 W, 6 min for 400 W, 6 min for 550 W, 6 min for 250 W, ventilation: 8 min [31].
After digestion the final volume of each sample was made up to 50 mL with deionized water. The blanks were also prepared in same way without any standard and samples and prepared accordingly.
Results and Discussion
The effect of pH on sorption of Pb and Cu
The % recoveries for both metal analytes (Cu and Pb) are presented in (Fig. 1) using various pH values from 2 to 9. The optimum pH for quantitative recoveries of Cu(II) and Pb(II) were found in the pH range of 6-8. The succeeding experiments were done at pH 7 and pH was maintained using buffer solution.
Figure 1. Effect of pH on recoveries of Cu and Pb (N=5)
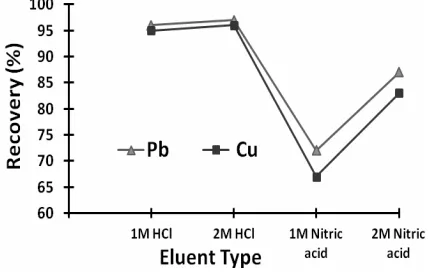
Eluent type and volume
For desorption of the retained metal analytes from column, different molarities (1M and 2M) of nitric acid (HNO3) and hydrochloric acid
(HCl) in volume range 2 mL to 10 mL were checked (Fig. 2).
Figure 2. Effect of eluent type on recoveries of Cu and Pb (N=5)
The recoveries above 95% were observed for the Cu and Pb with 5-9 mL of 1 mol L−1 hydrochloric acid and 2 mol L−1 hydrochloric acid. Eluent volume in solid phase extraction study is important to achieve high enrichment factor, so we selected the lowest quantitative volume and lower
molarity. The results are presented in (Fig. 3). Thus 5 mL of 1 mol L−1 hydrochloric acid was opted as an eluent in succeeding experiments.
Figure 3. Effect of eluent volume on recoveries of Cu and Pb
(N=5)
Effect of flow rates of sample and eluent solutions
The flow rates for both eluent and sample is important factor to be studied, because very slow or fast flow can cause less adsorption and retention of analytes onto the resin present in the column. The effect of the eluent and sample flow rates on the sorption and desorption of Cu and Pb ions on PHB-b-PEG1 polymeric column were also checked in the range from 2 mL min-1 to 10 mL min-1. The recoveries of Cu and Pb were found quantitative in the range of 3 mL min-1 to 8 mL min-1 for the flow of both sample and eluent. In subsequent experiments 5 mL min-1 was selected as flow rate for both.
Effect of sample volume
Figure 4. Effect of sample volume on recoveries of Cu and Pb
(N=5)
Interference studies by foreign ions
The possible coexisting ions in real samples which can directly or indirectly effect recoveries of Cu and Pb ions onto PHB-b-PEG resin was also investigated. The results are presented in (Table 1). The tolerance limit could be interpreted as the ions levels present in the solution causing a relative deviation less than ± 5 % related to the sorption and desorption of both analytes. It was observed in this study that availability of foreign ions (anions / cations) normally present in water and food samples do not affects the % recoveries of lead and copper by applying recommended conditions. Tolerable levels of foreign ions were optimized and given in Table 1 for the recoveries above 95% of both analyte ions in matrix of real samples.
Table 1. Influences of some foreign ions on the recoveries of Pb
and Cu (N=5).
Ion Added as Concentration (mg L-1) Cu Pb
Na+ NaCI 6000 96±2 97±3
K+ KCl 1000 96±2 99±3
Ca2+ CaCl2 1000 95±3 96±3
Mg2+ Mg(NO
3)2 500 96±2 96±2
Zn2+ ZnSO4 100 98±2 99±3
Fe3+ FeCl
3 50 97±2 96±2
I- KI 4000 99±3 98±3
NO3- Mg(NO3)2 2000 98±3 97±2
Cl- KCl 6000 96±2 96±2
SO42- Na2SO4 2000 98±3 95±2
PO43- Na3PO4 2000 97±3 98±3
Adsorption capacity
To examine adsorption capacities of PHB-b-PEG resin for two heavy metals, Cu and Pb a batch method was used. 0.1 g of PHB-b-PEG polymer was mixed with 50 mL of metal solution that contains 1.0 mg of metal ion having pH 7. Firstly solution was shaked for 1 h was carried out then filtration. After filtration 10 mL of upper part of solution was further diluted to a final volume of 100 mL and analysis was carried out by FAAS. The experiment was applied for both metal ions individually. Adsorption capacity onto PHB-b-PEG resin for was found Cu(II) 18.5 mg metal/g resin and for Pb(II) 19.4 mg metal/g resin, respectively.
Analytical performance
Linear range of the calibration curve, precision and limit of detection of studied analytes were investigated. Limits of detection of both metal ions (Pb and Cu) were studied under optimized experimental conditions using blank solutions. The limits of detection (LOD) for elements under investigation were based on 3 times standard deviations of blank (n = 12). LOD was found to be 0.36 µg L-1for Cu and 1.93 µg L -1
for Pb. The linear ranges were found to be 4-62 and 7-75 µg L-1 for Cu and Pb, respectively. The linear equations along with regression (R2) for calibration curves are: A=0.0384C+0.0006 (r2=0.989) and A=0.0065C+0.0032 (r2=0.987) for Cu and Pb, respectively; where A: absorbance and C: concentration. The calibration curves for both analytes were drawn after setting parameters of Flame AAS; such as: slit width, lamp current, wavelength, and flow rate of oxidant fuel at an optimum level (Table 2). Statistics used for triplicate measurements of standard solution containing Pb and Cu ions. The RSD for AAS measurements for Cu and Pb ions are between 2% and 7% in the model solutions.
Table 2. FAAS instrumental conditions for determination of the
analytes.
Flow rate of oxidant and fuel Element Wavelength
(nm)
Slit (nm)
Lamp current
(mA) Air (L/min)
Acetylene (L/min)
Pb 283.3 0.7 30 2.0 17.0
For validation and accuracy of PHB-b-PEG resin various amounts of Pb and Cu ions were spiked in natural water samples. Results are shown in (Table 3). Closeness was observed in added and measured result for both analytes. The recoveries were found in range of 97-98%. The quantitative recoveries of analyte can be strongly proved that presented method is applicable for SPE of Pb and Cu ions in real samples.
Table 3. The results for addition/recovery for Pb and Cu
determination in tap and BMW samples (Sample volume: 250 mL, final volume: 5 mL) (N=5).
Tap water Bottled mineral water Element Added
(µg L-1)
Found
(µg L-1)
Recovery (%)
Found
(µg L-1)
Recovery (%)
Cu - 5.3±0.4* - BDL -
10 15.2±0.9 99 9.6±0.4 96
20 24.9±1.1 98 19.4±0.9 97
Pb - BDL - BDL -
10 9.6±0.4 96 9.7±0.6 97
20 19.5±0.8 98 19.9±1.2 100
*
standard deviation
The precision and accuracy of method was also checked by digested CRM’s like: NIST SRM 1515 Apple leaves, IAEA-336 Lichen, GBW 07605 Tea. Obtained results are present in (Table 4), which shows that observed values of studied analytes are precise and accurate on comparison with certified values. This strongly indicates that presented polymer PHB-b-PEG is satisfactorily used for solid phase extraction method.
Table 4. The results for certified reference materials (CRM) for
Pb and Cu (N=5).
NIST SRM 1515 Apple leaves
(µg g-1)
IAEA-336 Lichen
(µg g-1)
GBW-07605 Tea
(µg g-1)
Elem ent
Certified value
Our value
Certified value
Our value
Certified value
Our value
Cu 5.64 5.52±
0.39* (97.9%)**
3.55 3.49± 0.19 (98.3%)
17.3 17.0± 0.95 (98.3%)
Pb 0.47 0.46± 0.05 (97.9%)
5 4.89±
0.18 (97.8%)
4.4 4.29± 0.36 (97.5%) *Mean expressed as 95 % tolerance limit
**(Percentage Recoveries)
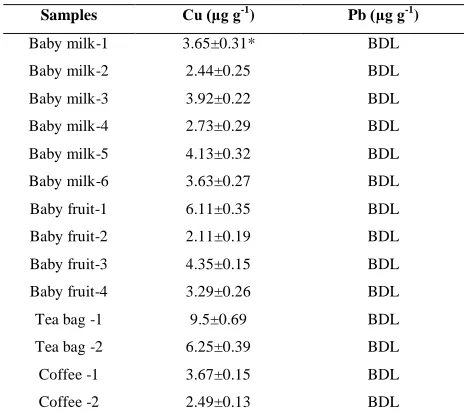
Analysis of real samples
The proposed SPE method was used for different real food samples including; baby milk (six), baby fruits (four), Tea bags (two) and coffee (two) brands after digestion. Results are presented in (Table 5). Lead was found below detection limits in all studied water and food samples whereas Cu was present in studied food samples.
Table 5. Concentration of Pb and Cu in food samples after
applying presented procedure (N=5).
Samples Cu (µg g-1) Pb (µg g-1)
Baby milk-1 3.65±0.31* BDL
Baby milk-2 2.44±0.25 BDL
Baby milk-3 3.92±0.22 BDL
Baby milk-4 2.73±0.29 BDL
Baby milk-5 4.13±0.32 BDL
Baby milk-6 3.63±0.27 BDL
Baby fruit-1 6.11±0.35 BDL
Baby fruit-2 2.11±0.19 BDL
Baby fruit-3 4.35±0.15 BDL
Baby fruit-4 3.29±0.26 BDL
Tea bag -1 9.5±0.69 BDL
Tea bag -2 6.25±0.39 BDL
Coffee -1 3.67±0.15 BDL
Coffee -2 2.49±0.13 BDL
*Mean expressed as 95 % tolerance limit, BDL: Below the detection limit
Conclusion
of detection of analyte ions were found lower than those of SPE techniques [33-35]. The developed procedure is rapid in comparison with other
reported methods for preconcentration of traces metal ions.
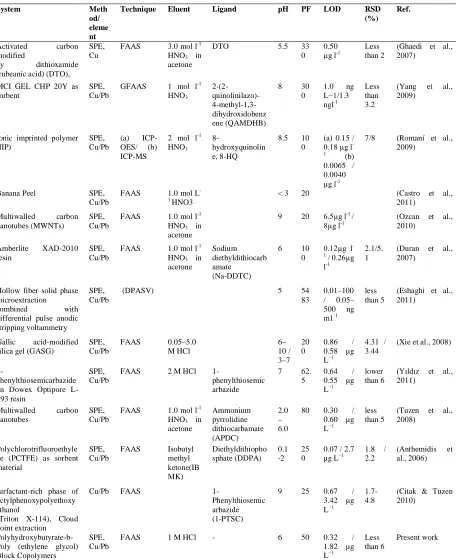
Table 6. Comparative data from some recent SPE studies on preconcentration of Pb and Cu.
System Meth
od/ eleme nt
Technique Eluent Ligand pH PF LOD RSD (%)
Ref.
Activated carbon modified
by dithioxamide (rubeanic acid) (DTO),
SPE, Cu
FAAS 3.0 mol l-1 HNO3 in acetone
DTO 5.5 33
0
0.50
µg l-1 Less than 2 (Ghaedi et al., 2007)
MCI GEL CHP 20Y as sorbent
SPE, Cu/Pb
GFAAS 1 mol l-1 HNO3 2-(2-quinolinilazo)- 4-methyl-1,3-dihydroxidobenz ene (QAMDHB)
8 30
0
1.0 ng L−1/1.3
ngl-1
Less than 3.2
(Yang et al., 2009)
Ionic imprinted polymer (IIP)
SPE, Cu/Pb
(a) ICP-OES/ (b) ICP-MS
2 mol l-1 HNO3
8-hydroxyquinolin e, 8-HQ
8.5 10 0
(a) 0.15/
0.18 µg l
-1 (b) 0.0065 / 0.0040
µg l-1
7/8 (Romaní et al., 2009)
Banana Peel SPE,
Cu/Pb
FAAS 1.0 mol L -1
HNO3
< 3 20 (Castro et al.,
2011)
Multiwalled carbon nanotubes (MWNTs)
SPE, Cu/Pb
FAAS 1.0 mol l-1 HNO3 in acetone
9 20 6.5µg l-1 /
8µg l-1
(Ozcan et al., 2010)
Amberlite XAD-2010 resin
SPE, Cu/Pb
FAAS 1.0 mol l-1 HNO3 in acetone
Sodium diethyldithiocarb amate
(Na-DDTC)
6 10
0
0.12µg l
-1 /0.26µg
l-1
2.1/5. 1
(Duran et al., 2007)
Hollow fiber solid phase microextraction
combined with
differential pulse anodic stripping voltammetry
SPE, Cu/Pb
(DPASV) 5 54
83
0.01–100 / 0.05– 500 ng m1-1
less than 5
(Eshaghi et al., 2011)
Gallic acid-modified silica gel (GASG)
SPE, Cu/Pb
FAAS 0.05–5.0
M HCl 6– 10 / 3–7 20 0
0.86 / 0.58 µg L−1
4.31 / 3.44
(Xie et al., 2008)
1-phenylthiosemicarbazide on Dowex Optipore L-493 resin
SPE, Cu/Pb
FAAS 2 M HCl
1-phenylthiosemic arbazide
7 62.
5
0.64 / 0.55 µg L−1
lower than 6
(Yıldız et al.,
2011)
Multiwalled carbon nanotubes
SPE, Cu/Pb
FAAS 1.0 mol l-1 HNO3 in acetone Ammonium pyrrolidine dithiocarbamate (APDC) 2.0 – 6.0
80 0.30 / 0.60 µg L−1
less than 5
(Tuzen et al., 2008)
Polychlorotrifluoroethyle ne (PCTFE) as sorbent material
SPE, Cu/Pb
FAAS Isobutyl methyl ketone(IB MK) Diethyldithiopho sphate (DDPA) 0.1 -2 25 0
0.07 / 2.7
µg L−1 1.8 / 2.2 (Anthemidis al., 2006) et
surfactant-rich phase of octylphenoxypolyethoxy ethanol
(Triton X-114), Cloud point extraction
Cu/Pb FAAS
1-Phenylthiosemic arbazide (1-PTSC)
9 25 0.67 /
3.42 µg L−1
1.7-4.8
(Citak & Tuzen 2010)
Polyhydroxybutyrate-b-Poly (ethylene glycol) Block Copolymers
SPE, Cu/Pb
FAAS 1 M HCl - 6 50 0.32 /
1.82 µg L−1
Less than 6
Present work
Acknowledgments
Sham Kumar is thankful to TUBITAK-BIDEB, Ankara, Turkey, for sponsorship of this research project under Research Fellowship Program for Foreign Citizens (2216).
References
1. M. Soylak, S. Saracoglu, M. Tuzen and D. Mendil, Food Chem., 92 (2005) 649.
2. X. Lin, X. Wu and Z. Xie, Talanta., 74 (2008) 836.
3. M. Tuzen, S. Silici, D.Mendil and M. Soylak, Food Chem., 103 (2007) 325. 4. M. Tuzen, E. Sesli and M. Soylak, Food
Control., 18 (2007) 806.
5. N. Chu, C. Ding, and S.Fan, Anal. Lett., 43 (2010) 335.
6. M. B. Arain, T. G. Kazi, M. K. Jamali, H. I. Afridi, N. Jalbani, and J. A. Baig, J. Hazard. Mater., 154 (2008) 998.
7. M. K. Jamali, T. G. Kazi, M. B. Arain, H. I. Afridi, N. Jalbani, A. R. Memon, J. Agron. Crop Sci., 193 (2007) 218.
8. M. Karve and R. V. Rajgor, J. Hazard. Mater., 141 (2007) 607.
9. R. K. Mahajan, T. P. S. Walia and K. Sumanjit, J. Health Allied Sci., 4, (2005) 1. 10. I. Ascione, Arch Pediatr Urug., 72 (2001)
133.
11. B. Volesky, in: B. Volesky (Ed.), Biosorption of Heavy Metals, CRC Press, Boca Raton, FL. (1990).
12. J. C. Merrill, J. J. P. Morton, S. D. Soileau, Principles and Methods of Toxicology, 5th ed., CRC Press. (2007).
13. L. J. Casarett, C. D. Klaassen, J. Doull, Casarett and Doull’s. Toxicology: The Basic Science of Poisons, 7th ed., McGraw-Hill. (2007).
14. F. Kabadayi and H. Cesur, Environ. Monit. Assess., 168 (2010) 241.
15. S. Saracoglu, M. Soylak and L. Elci, Anal. Lett., 35 (2002) 1519.
16. T. G. Kazi, S. Khan, J. A. Baig N. F. Kolachi, H. I. Afridi G. A. Kandhro, S. Kumar and A. Q. Shah, J. Hazard. Mater.,
172 (2009) 780.
17. Z. Karim, M. Mumtaz, A. Siddique, S. Anwer, U. Zafar and A. Karim, J. Saudi Chem. Soc., 12 (2008) 463.
18. X. Chang, H. Luo, Y. Cui, X. Zhu, H. Zhai, Z. Hu and Q. He, J. Mol. Struc., 89 (2008) 45.
19. C. Araneda, C. Fonseca, J. Sapag, C. Basualto, M. Yazdani-Pedram, K, Kondo, E. Kamio and F. Valenzuela, Sep. Purif. Technol., 63 (2008) 517.
20. E. L. Silva and P. S. Roldan, J. Hazard. Mater., 161 (2009) 142.
21. Z. Sun and P. Liang, Microchim. Acta., 162 (2008) 121.
22. M. Hosseini, N. Dalali, A. Karimi, Turk. J. Chem., 34 (2010) 805.
23. M. Ghaedi, F. Ahmadi and M. Soylak, J. Hazard. Mater., 147 (2007) 226.
24. N. Burham, S.M.A. Azeem and F. Shahat,
Int. J. Environ. An. Ch., 88 (2008) 775. 25. M. H. Sorouraddin and M. Saadati, B. Chem.
Soc. Jpn., 81 (2008) 1103.
26. N. Pourreza, K. Ghanemi, J. Hazard. Mater.,
161 (2009) 982.
27. D. Afzali and A. Mostafavi, Can. J. Anal. Sci. Spect., 53 (2008) 82.
28. E. Taskın, B. Hazer, N. Besirli and G.
Cavus, J. Macromol. Sci., Part A: Pure and Appl. Chem., 49 (2012) 164.
29. B. Hazer, B.M. Baysal, A.G. Köseoğlu, N.
Beşirli and E. Taşkın, J. Polym. Environ., 20
(2012) 477.
30. U. Yildiz, O.F. Kemik, B. Hazer, J. Hazard. Mater., 183 (2010) 521.
31. M. Tuzen, D. Citak, D. Mendil and M. Soylak, Talanta., 78 (2009) 52.
32. G. Y. Yang, Q. F. H, Z. J. Huang and H. Y. Yin, J. Braz. Chem. Soc., 16 (2005) 1154. 33. U. Divrikli, A. A. Kartal, M. Soylak, L. Elci,
J. Hazard. Mater., 145 (2007) 459.
34. M. R. Ganjali, L. H. Babaei, A. Badiei, K. Saberian, S. Behbahani, G. M. Ziarani and M. S. Niasari, Quim. Nova., 29 (2006) 440. 35. M. Soylak, M. Tuzen, Diaion, J. Hazard.