_____________________________________________________________________________________________________
Relating Financial Leverage to Corporate
Performance: A Case of Cement Manufacturing
Firms in Nigeria
Makwe Stella Ivo
1*and Mike Anyanwaokoro
11Department of Banking and Finance, Enugu State University of Science and Technology,
Enugu State, Nigeria.
Authors’ contributions
This work was carried out in collaboration between both authors. Author MSI designed the study, performed the statistical analysis, wrote the protocol and wrote the first draft of the manuscript. Author Author MA managed the analyses of the study and the literature searches. Both authors read and approved the final manuscript.
Article Information
DOI: 10.9734/SAJSSE/2019/v3i430114
Editor(s):
(1) Dr. John M. Polimeni, Associate Professor, Department of Economics, Albany College of Pharmacy and Health Sciences, Albany, New York.
Reviewers:
(1) Godwin Israel Ebirien, Ken Saro Wiwa Polytechnic, Nigeria. (2)Lynda Soltani, University of Sfax, Tunisia. Complete Peer review History:http://www.sdiarticle3.com/review-history/50420
Received 16 May 2019 Accepted 26 July 2019 Published 31 July 2019
ABSTRACT
The study evaluated the effect of leverage financing on performance of quoted cement manufacturing firms in Nigeria for the period 2006-2017. There are four (4) cement manufacturing firms in Nigeria studied out of eight (8) manufacturing cement firms. Purposive sampling technique were used in selecting the four (4) cement manufacturing firms in Nigeria out of the eight (8) cement manufacturing firms quoted in the Nigerian Stock Exchange (NSE). The main objective of the study is to investigate the effect of financial leverage on corporate performance of cement firms in Nigeria. The analytical tool adopted was ordinary least square (OLS) simple and multiple regressions. Findings of the study showed that Debt Ratio and Debt to Equity Ratio has negative insignificant effect on Return on Assets (ROA) of quoted cement manufacturing firms in Nigeria. On the other hand Interest Coverage Ratio (ICR) has positive and insignificant effect on return on assets of quoted cement firms in Nigeria. This implies that increase in Debt Ratio and Debt to Equity Ratio decreases ROA, while increase in ICR increases ROA of cement manufacturing firms
in Nigeria. The study therefore recommended that the corporate managers in Nigeria should be encouraged to use more long term debt in their financing than relying more on short term credits, since increase in ICR increases ROA of cement manufacturing firms in Nigeria.
Keywords: Leverage; debt ratio; debt equity ratio; return on asset; interest coverage ratio.
1. INTRODUCTION
Financial decision making is very relevant for the profitability of any firm. These include long-term financing and short-term financial decisions. The long-term decisions are mode of capital sourcing and dividend decisions while the short term financing decisions involve liquidity decisions. Thus, the financial manager is responsible for determining the optimal mix of debt and equity that will ensure maximization of shareholders’ wealth [1]. Firm’s performance and profitability is very important in any economy, among them are; first the profits to the firm mean income to the shareholders and hence spillover impact and multiplier impact for individual, households and the economy in general. Secondly the corporate taxes that the government will earn will enable the implementation of infrastructural projects and social welfare programs. Thirdly when firms are profitable it means they can attract more investors and hence raising large capital for bigger and high returns projects. Leverage refers to the use of debt in financing a firm. Leverage ratios measure the extent to which debt has been used to finance the activities of a firm. Lenders are interested in this category of ratios because a firm that has been making much use of borrowed funds in financing its activities would have outstanding debts to settle from its financial resources [2].
Hence, the optimal capital structure decision seems to be relevant to finance managers and board of directors; because, such decision on capital structure might lead to increase profitability and shareholders’ wealth maximization. Thus, most finance managers believe that the use of financial leverage is like a ‘double-edged sword’ because it can either magnify the firm’s potential gains or losses. It is a recognized theoretical fact that the primary motive of a firm in using financial leverage is to boost the shareholders’ return under favorable economic conditions. This is based on the assumption that fixed-commitment financing can be obtained at a cost lower than the firm’s rate of return on net assets [3]
Financial leverage is a measure of how much firm uses debt and equity to finance its assets.
As debt increases, financial leverage increases. Consequently, the firms with the higher leverage should be the most encouraged to improve their performance. However, on the other side, a higher leverage means higher agency costs because of the diverging interests between debt holders and shareholders (equity holders). This principled threat suggests that leverage can significantly affect the value of firms in a negative or in a positive way, since it magnifies returns and risk. However, cement firms would achieve good financial performance if their financial factors are strictly governed by either the companies or the government. It is only when the financial factors are well taken care of that the financial leverage will have positive effect on financial performance of cement firms in Nigeria can be completely realized. In the advanced countries such as United States and France among others, the “ease of doing business” captured by many other variables including the interest (lending) rate has remained impressive. The interest rate in those countries has remained within single-digit limit. With the interest rate remaining low, firms including cement firms can easily secure low-cost loans which will help them for better performance.
transportation of cement from factory to end-users vis-à-vis poor distribution network of some cement companies, sheer monopoly of production and importation of cement by a few players, rise in prices of other raw materials may lead to high cost of cement, unfavorable government policy on production and importation, high capital involved in setting up more cement factories may lead to the supply gap of cement and lastly high tax burden also impact on price of cement [4]. However, with the experience of high cost of production, high interest rate charge and mix others, financial managers of cement firms might take advantage of available credit and tax shield to enhance their firm’s assets (performance) and this might decrease the financial performance of cement firms in Nigeria when compare with foreign companies or firms performance. It is acknowledge that indicators of the financial leverage are; Debt which is used to measure a company's ability to handle its obligations, Debt to Equity measures the proportion of debt and equity in financing a company’s assets. Also Interest Coverage determines a firm's ability to pay interest on outstanding debt. While performance indicator is Return on Assets which measures efficient management is using its assets to generate earnings. The problem of the study is to investigate the impact of financial leverage on Returns on Assets of cement manufacturing firms in Nigeria.
1.1 Objectives of the Study
The broad objective of this study is to investigate the impact of financial leverage on corporate performance of cement manufacturing firms in Nigeria. The specific objectives of the study are:-
i. To evaluate the effect of Debt Ratio (DR) on Return on Assets (ROA) of the cement manufacturing firms in Nigeria.
ii. To ascertain the effect of Debt-Equity Ratio (DER) on Return on Assets (ROA) of the cement manufacturing firms in Nigeria. iii. To investigate the effect of Interest
Coverage Ratio (ICR) on Return on Assets (ROA) of the cement manufacturing firms in Nigeria.
1.2 Research Questions
i. To what extent does Debt-Ratio (DR) impact on Return on Assets (ROA) of the cement manufacturing firms in Nigeria?
ii. To what degree does Debt-Equity Ratio (DER) affect Return on Assets (ROA) of the cement manufacturing firms in Nigeria? iii. By how much does Interest Coverage Ratio (ICR) affect Return on Assets (ROA) of the cement manufacturing firms in Nigeria?
1.3 Statement of Hypotheses
The following hypotheses in null form guided the study:
1. Debt ratio (DR) has no positive effect on Return on Assets (ROA) of the cement manufacturing firms in Nigeria.
2. Debt-Equity Ratio (DER) has no positive effect on Return on Assets (ROA) of the cement manufacturing firms in Nigeria. 3. Interest Coverage Ratio (ICR) has no
positive effect on Return on Assets (ROA) of the cement manufacturing firms in Nigeria.
some empirical impetus to existing notions about the financing patterns and their impacts on Nigerian quoted firms. The study focused on the impact of financial leverage on corporate performance of four (4) cement manufacturing firms in Nigeria quoted in Nigerian Stock Exchange namely; Lafarge cement (WAPCO) plc, Dangote cement plc, Ashaka cement plc, Cement Company of Northern Nigeria plc. Data were drawn from their website, Nigerian Stock Exchange, Fact Book and their annual report for (12) years from 2006 to 2018. The variables for financial leverage are Debt Ratio (DR), Debt Equity Ratio (DER) and Interest Coverage Ratio (ICR), while Return on Asset (ROA) is a proxy for corporate performance. Aside the introduction section, the rest of the paper is divided into four sections. Section two presents a review of related literature, section three contains the methodology for the study, and section four has the analyses of data while section five concludes.
2. REVIEW OF RELATED LITERATURE
This section provides the theoretical framework of the study, the impact of Financial Leverage on firm, profitability, the Conceptual Framework, empirical review and the summary of the literature review.
2.1 Conceptual Framework
The greatest study information through the problem statement in perspective of a theoretical context or conceptual. An explanation of this context adds to a research information in at least two means as it identifies research study variables, and association among the study variables. This study tries to examine the impact of financial leverage on profitability of cement companies listed in the Nigeria stock exchange. The conceptual framework of this study spells out the relationship between profitability which will be measured by firm size, growth and productivity. Profitability = Return on Equity(ROE)=Net profit /Total Equity while the independent variables of the study will be financial leverage which will be measured as the ratio of total debt to total assets.
The term ‘Leverage’ may be defined as the percent of change in one variable by the percent of change in some other variable or variables. In the field, finance management, the term leverage is used to describe the firm’s ability to use fixed cost assets or funds; the former is popularly
known as ‘Operating Leverage’ and the latter is known as ‘Financial Leverage’.
The interest coverage ratio is used to determine a firm's ability to pay interest on outstanding debt. The greater the multiple, the less risk to the lender and typically, if the company has a multiple higher than one, it is considered to have enough capital to pay off its interest expenses. It is expected that a company should cover interest and fixed charges by at least a factor of two, or even more ideally, 3:1, if not, its ability to meet interest payments may be questionable.
Interest Coverage Ratio =
( )
( )
Debt Equity Ratio is the measure of a company's financial leverage calculated by dividing its total debts by stockholders' equity. It indicates what proportion of debt to equity the company is using to finance its assets. The extent to which a firm uses debt funding or financial leverage has implications for the firm. By raising funds through debt, shareholders are able to maintain control without having to increase investment. Enekwe et al. [5] submits that debt to equity ratio is a financial ratio indicating the relative proportion of equity and debt used to finance a company’s assets which is an indicator of the financial leverage. It is equal to total debt divided by shareholders’ equity.
Debt to Equity Ratio = Total Liabilities Total Equity
Debt Ratio on the other hand is a financial leverage ratio used in corporate finance to measure a company's ability to handle its obligations. It compares company’s total debt to its total assets, which is used to gain a general idea as to the amount of leverage being used by a company. It gives users a quick measure of the amount of debt that a firm has on its financial position compared to its assets. Debt includes all short term and long term obligations. The ratio is used to evaluate a firm's financial structure and its financing operators. Typically, the more debt compared to assets a company has amongst its peers, which is signaled by high debt ratio, the more leveraged it is and the riskier it is considered to be.
2.2 Concept of Financial Performance
A firm’s performance represents how effective managers operate a company and thereby enhance the value of the firm to their shareholders. The relationship between managers and shareholders has raised the issue of a conflict of interest when managers use discretionary power to act in their personal best interest [6].
Firm or corporate performance is measured in this context using the following proxy;
This is an indicator of how profitable a company is relative to its total assets. Return on Asset (ROA) is calculated by dividing a company’s annual earnings by its total assets.
ROA =
Emekekwue [7] defines Return on Assets (ROA) as a ratio which seeks to measure the amount of profit generated from the entire assets of the firm.
It is expressed as =
Enekwe et al. [5] opine that Return on Assets (ROA) is a dependent variable. It is the quotient of dividing profit after tax by total assets. Ekwe and Duru [8] opined that return on assets (ROA) was used as dependent variables, because it is an indicator of managerial efficacy. Falope and Ajilore [9] agree that the formula for Return on Assets (ROA) is expressed as Profit before Tax divided by Total Assets.
Return on Assets =
2.3 Theoretical Framework
This section covers the theories that support the impact of financial feverage on firms profitability. These theories include: Modigliani-Miller theorem, Pecking Order Theory and Trade-off Theory.
The theory of Trade-off was propounded by Modigliani and Miller (MM) in 1958 as asserted in Pratheepkanth [10]. The theory assumed that a business's value is distinct from its debt and equity mix of financing but ignoring issues that play a positive role in determining the best capital structure such as corporate taxes. Consequently, Modigliani and Miller reaffirmed that corporate taxes are significant characteristic of capital structure. The theory suggested that, there is an
optimal capital structure that maximizes the value of a firm in balancing the costs and benefits of an additional unit of debt. These are characterized by models of trade-off which allow the bankruptcy costs to exist. The bankruptcy costs of debt are the increased costs of financing with debts instead of equity. The trade-off theory of capital structure refers to the idea that a company chooses how much debt and equity finance to use by balancing the costs and benefits. Trade-off theory assumes that there are benefits to leverage within a capital structure up until the optimal capital structure is reached. Akinmulegun [11] with the assumption of Trade-off theory that there are benefits to leverage within a capital structure up until the optimal capital structure is reached as a result the research anchored her work on Trade-off theory.
Secondly, the Pecking Order theory This theory postulate that the cost of financing increases with asymmetric information and that financing comes from three sources namely, internal funds, debt and new equity, also companies prioritize their sources of funding, first internal that is, equity financing, secondly debt and raising new equity as its last resort. The theory in its view in asymmetric information that managers know more about their companies prospect, risks and value more than the outside investors, anchored in line with the theory that, most firms prefer the Pecking Order Theory for their investment. By virtue of the theory, the management prefers ready fund for investment first in their activity and if the fund is not available they use debt and finally benefit from external share [6].
The result of Pecking Order of financing is as follows: an internally generated fund first is followed by respectively low-risk debt financing and share financing. Outside investors rationally discount the firm's stock price when managers issue equity instead of riskless debt. To avoid this discount, managers avoid equity whenever possible. The Myers and Majluf model predicts that managers will follow a pecking order, using up internal funds first, then using up risky debt, and finally resorting to equity. In the absence of investment opportunities, firms retain profits and build up financial slack to avoid having to raise external finance in the future [6].
2.4 Empirical Review
listed firms. It consists of both local and global studies as follows:
Enekwe et al. [5] wrote on the effect of financial leverage on financial performance [6]. Their main objective of this study is to determine the effect of financial leverage on financial performance of the Nigeria pharmaceutical companies over a period of twelve (12) years (2001 – 2012) for the three (3) selected companies. Their work employed three (3) financial leverage for the independent variables such as: debt ratio (DR); debt-equity ratio (DER) and interest coverage ratio (ICR) in determining their effect on financial performance for Return on Assets (ROA) as dependent variable. They used secondary data obtained from the financial statement. Descriptive statistics, Pearson correlation and regressions were employed and used for this study. The results of the analysis showed that debt ratio (DR) and debt-equity ratio (DER) have negative relationship with Return on Assets (ROA) while interest coverage ratio (ICR) has a positive relationship with Return on Assets (ROA) in Nigeria pharmaceutical industry.
Rondk [12] investigated the impact of capital structure on firm performance: evidence from companies listed on Iraq Stock Exchange for the period 2009-2013. Multiple regression data analysis was used in his study to analyse the impact of the company's capital structure on its financial performance by employing 40 companies (18 manufacturing, 7 services, 10 tourism, 5 agriculture) listed in Iraq stock market. The research used three measures for financial performance namely, Return on equity (ROE), and Return on assets (ROA), as dependent variables and leverage (which is short term debt/total assets) as an independent variable. The results of the study demonstrate that short term debt ratio (DR) has a negative effect on return on assets (ROA) and short term debt ratio (DR) has a positive and significant effect on return on equity (ROE). Significant determinant of return on equity (ROE) is asset turnover because it has a positive and significant effect in the model. The results are different from both return on assets (ROA) and return on equity (ROE).
Ubesie et al. [3] in their study evaluated the effect of capital structure on financial performance of quoted cement companies in Nigeria for the period 2006-2015. The main objective of their study was to investigate the effect of financial leverage on corporate
performance of some cement firms in Nigeria which were Dangote cement, Lafarge Cement, Ashaka cement and Cement Company of Nigeria. The methodology adopted was the fixed effect econometric panel regression model. Overall, the findings of the study showed that debt ratio has no significant effect on return on asset of quoted cement companies in Nigeria. Debt equity ratio has negative significant effect on return of assets of quoted cement companies in Nigeria. Interest coverage ratio has positive and significant effect on return on assets of quoted cement companies in Nigeria. The study therefore recommended that the regulators and operators of the market for corporate finance, like the CBN, SEC, and NSE should collaborate to develop the capital market in Nigeria to enable quoted companies in Nigeria access long term debt.
Chinaemerem and Anthony [13] investigated the effect of capital structure portfolio on financial performance of Nigerian firms using 30 listed non-financial firms on the Nigerian Stock Exchange for a span of 7 years from 2004- 2010. Panel data for the chosen companies were examined using ordinary least squares method of approximation. The findings indicate that company’s capital structure represented by debt ratio has negatively significant association with the firm's financial performance surrogated by Return on Assets and Return on Equity.
Gweyi and Karanja [6] investigated the effect of financial leverage on financial performance of deposit taking Sacco in Kenya. The sample data was extracted from 40 Savings and Credit Co-operative Societies (Saccos) registered by Sacco Society Regulatory Authority extended from the period 2010 to 2012. The secondary data used for analysis was collected from the financial statements of the various deposit taking Saccos. Two basic approaches descriptive and analytical design were adopted. The results show perfect positive correlation between debt equity ratio (DER) with return on equity (ROE) and profit after tax at 99% confidence interval and a weak positive correlation between debt equity ratio with return on assets and income growth.
regression models were used. The results show that average collection period and operating cycle were positive whereas average age of inventory was negatively related to the return on equity (ROE). Firm size was positive whereas leverage is negatively related to the return on equity (ROE). Average payment period is negative whereas cash conversion cycle is positively and significantly related with return on equity. The results indicate that working capital management influences the firms’ profitability.
Nawaz et al. [15] investigated the impact of financial leverage and Profitability of cement sector operating in Pakistan. The sample size for 18 firms for six (6) years consists of 108 observations. They used Ordinary Least Square model on the data to establish a causal relation-ship between the variables. The researchers found that financial leverage has a statistically significant inverse impact on profitability at 99% confidence interval.
Soumadi and Hayajneh [16] investigated the relationship between capital structure and corporate performance of Jordanian shareholdings firms. The study used multiple regression models by Ordinary least squares (OLS) to establish the link between capital structure and corporate performance of firms over a period of 5 years. The results showed that capital structure was associated negatively and statistically with the performance of the firms in the sample. Another finding from the study was that there was no significant difference in the impact of financial leverage between high financial leverage firms and low financial leverage firms in their performance. The study also concluded that the relationship between capital structure and firm performance was negative for both high growth firms and low growth firms.
Suhaila [17] investigated the effect of liquidity and leverage on financial performance of commercial state corporations in the tourism industry in Kenya. The study adopted descriptive research design where data was retrieved from the Balance Sheets, Income Statements and Notes of ten (10) Commercial State Corporations in the tourism industry in Kenya during the study period 2008-2012. A regression model was used to assess the impact of liquidity and leverage on financial performance measured with profitability. A positive relationship was found to exist between tourism industry liquidity and profitability of Commercial State Corporations in the tourism sector in Kenya.
Tale [18] investigated the relationship between capital structure and financial performance of non-financial firms listed at the Nairobi securities exchange in Kenya. The study used a descriptive survey. The population of the study consisted of all the 40 nonfinancial firms listed and duly registered with capital market authority of Kenya. Secondary data used was obtained mainly from the annual audited and published books of accounts, financial statements and the NSE. Data analysis was done using regression analysis model. However, the results showed that there was a negative relationship between financial performance and the size and growth of the firm.
Al-Taani [19] investigated the relationship between capital structure and firm performance: Evidence from Jordan. The study showed that firm's working capital management policy, represented by financial leverage and firm size have significant relationship to firm’s performance in respect to net income however found no significant impact on Return on equity (ROE) and return on assets (ROA). The firm size had the potential to influence the firm's financial performance in form of the preference of capital structure mix.
Nwude et al. [20] investigated on the impact of debt structure on the performance of Nigerian quoted firms. They conducted it using 12-year annualized panel data spanning the period 2001-2012 for cross sectional analyses of 43 firms from different sectorial classifications. Their study employed three regression estimations (Pooled OLS, Fixed Effects and Random Effects) as a result of unobserved heterogeneity in the dataset. The outcome from their regression estimations showed that debt structure (Short term Debt Ratio, Long term Debt Ratio, Total Debt Ratio, Firm’s Size and Firm’s Age) has negative and significant impact on the performance (ROA) of Nigerian quoted firms within the period under review. The study concludes that debt structure contributes negatively to performance of Nigerian quoted firms; thereby agree with pecking order theory.
3. METHODOLOGY
in Nigeria as documented on Nigerian Stock Exchange (NSE) yearly Fact Book. The population of this research study comprises of eight (8) cement manufacturing firms in Nigeria, as at 31st December 2018. The emphasis on cement manufacturing firms quoted on the Nigerian Stock Exchange (NSE),is based on the premise that they are under obligation by law to file their annual reports periodically.
Only cement manufacturing firms with data needed for the variables of this study were chosen and as result, the researcher selected four (4) cement manufacturing firms quoted on the Nigerian Stock Exchange, which constitute the sample of this study. Purposive sampling technique was used to select: Lafarge Cement (WAPCO) plc, Dangote Cement plc, Ashaka Cement plc and Cement Company of Northern Nigeria plc. Purposive sampling method involved the analyst to judgmentally sample the population items and as to which items constitutes a representative sample while relying particularly on data availability.
3.1 Model Specification
To pursue the broad objective of this study which is to investigate the impact of financial leverage on corporate performance of cement manufacturing firms in Nigeria, we adopt the Panel Least Squares which follows either the Random Effects Model or the Fixed Effect Model.
Cross Sectional Random Effects
The random effect model will be of the form specified below:
Yit= α+ βxit + ѡit, ѡit = ɛit + μit,
where:
ɛitmeasures the random deviation from the global or common intercept term α, subscript “it”
represents the combination of individuality and time.
μit = the regular error term
In substituting our parameters into the random effect model it will appear thus:
ROAit = α +β1DRit+ β2DERSit + β3ICRit + (μi + ɛit)
Where y = Return on Assets (firms performance proxy for Dependent Variable)
x = Debt Ratio, Debt Equity Ratio, and Interest Cover Ratio
Fixed Effect Model
Yit=α + βxit + λi+ ѵit
λi is a time-varying intercept that captures all of the variables that affect Yit that vary over time but are constant cross sectionally [21]
In substituting our parameters into the fixed effect model the model appears thus:
ROAit = α +β1DRit+ β2DERSit + β3ICRit + λi + ѵit
Where:
Where y = Return on Assets (firms performance proxy for Dependent Variable)
x = Debt Ratio, Debt Equity Ratio, and Interest Cover Ratio
The Haussmann Test
The choice of either of the Models is a function of the Haussmann Test conducted on the panel regression results. This test as shown in Brooks [22] looks like this:
Hstat = (β FE
βRE)’[Var(βFE) –Var (βRE)]-1(βFE – βRE) ~Ӽ2(k)
The Haussmann test represents a distance measure with an Ho that the Random Effects (ECM) are better, efficient and consistent and an H1 that the Fixed Effects (LSDV) are better, more efficient and consistent.
4. RESULTS
4.1 Data Presentation
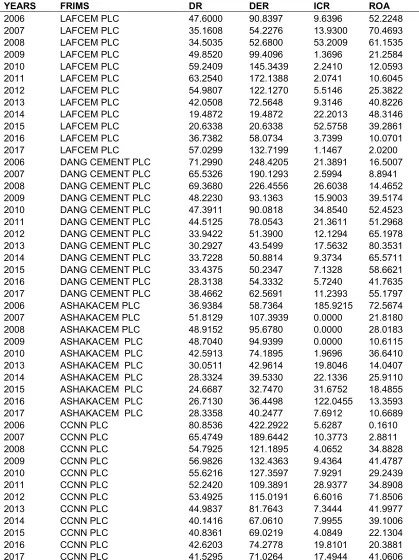
In this section of the work, the collected data were analyzed and interpreted in line with the aim of the study which is to determine the impact of leverage finance variables on the financial performance of cement firms in Nigeria. The study used the data of four cement firms audited annual reports of 2006 to 2017.
4.2 Basic Statistical Properties
Table 1. Presents values for leverage finance variables and return on assets of the four cement firms Nigeria
YEARS FRIMS DR DER ICR ROA
2006 LAFCEM PLC 47.6000 90.8397 9.6396 52.2248
2007 LAFCEM PLC 35.1608 54.2276 13.9300 70.4693
2008 LAFCEM PLC 34.5035 52.6800 53.2009 61.1535
2009 LAFCEM PLC 49.8520 99.4096 1.3696 21.2584
2010 LAFCEM PLC 59.2409 145.3439 2.2410 12.0593
2011 LAFCEM PLC 63.2540 172.1388 2.0741 10.6045
2012 LAFCEM PLC 54.9807 122.1270 5.5146 25.3822
2013 LAFCEM PLC 42.0508 72.5648 9.3146 40.8226
2014 LAFCEM PLC 19.4872 19.4872 22.2013 48.3146
2015 LAFCEM PLC 20.6338 20.6338 52.5758 39.2861
2016 LAFCEM PLC 36.7382 58.0734 3.7399 10.0701
2017 LAFCEM PLC 57.0299 132.7199 1.1467 2.0200
2006 DANG CEMENT PLC 71.2990 248.4205 21.3891 16.5007
2007 DANG CEMENT PLC 65.5326 190.1293 2.5994 8.8941
2008 DANG CEMENT PLC 69.3680 226.4556 26.6038 14.4652
2009 DANG CEMENT PLC 48.2230 93.1363 15.9003 39.5174
2010 DANG CEMENT PLC 47.3911 90.0818 34.8540 52.4523
2011 DANG CEMENT PLC 44.5125 78.0543 21.3611 51.2968
2012 DANG CEMENT PLC 33.9422 51.3900 12.1294 65.1978
2013 DANG CEMENT PLC 30.2927 43.5499 17.5632 80.3531
2014 DANG CEMENT PLC 33.7228 50.8814 9.3734 65.5711
2015 DANG CEMENT PLC 33.4375 50.2347 7.1328 58.6621
2016 DANG CEMENT PLC 28.3138 54.3332 5.7240 41.7635
2017 DANG CEMENT PLC 38.4662 62.5691 11.2393 55.1797
2006 ASHAKACEM PLC 36.9384 58.7364 185.9215 72.5674
2007 ASHAKACEM PLC 51.8129 107.3939 0.0000 21.8180
2008 ASHAKACEM PLC 48.9152 95.6780 0.0000 28.0183
2009 ASHAKACEM PLC 48.7040 94.9399 0.0000 10.6115
2010 ASHAKACEM PLC 42.5913 74.1895 1.9696 36.6410
2013 ASHAKACEM PLC 30.0511 42.9614 19.8046 14.0407
2014 ASHAKACEM PLC 28.3324 39.5330 22.1336 25.9110
2015 ASHAKACEM PLC 24.6687 32.7470 31.6752 18.4855
2016 ASHAKACEM PLC 26.7130 36.4498 122.0455 13.3593
2017 ASHAKACEM PLC 28.3358 40.2477 7.6912 10.6689
2006 CCNN PLC 80.8536 422.2922 5.6287 0.1610
2007 CCNN PLC 65.4749 189.6442 10.3773 2.8811
2008 CCNN PLC 54.7925 121.1895 4.0652 34.8828
2009 CCNN PLC 56.9826 132.4363 9.4364 41.4787
2010 CCNN PLC 55.6216 127.3597 7.9291 29.2439
2011 CCNN PLC 52.2420 109.3891 28.9377 34.8908
2012 CCNN PLC 53.4925 115.0191 6.6016 71.8506
2013 CCNN PLC 44.9837 81.7643 7.3444 41.9977
2014 CCNN PLC 40.1416 67.0610 7.9955 39.1006
2015 CCNN PLC 40.8361 69.0219 4.0849 22.1304
2016 CCNN PLC 42.6203 74.2778 19.8101 20.3881
2017 CCNN PLC 41.5295 71.0264 17.4944 41.0606
Table 2. Descriptive statistics
LOGROA LOGICR LOGDR LDER
Mean 3.193724 2.377688 3.752060 4.381774
Median 3.552109 2.265880 3.774050 4.332608
Maximum 4.386431 5.225325 4.392640 6.045697
Minimum -1.826351 0.136888 2.969758 2.969758
Std. Dev. 1.110193 1.106234 0.328346 0.624329
Skewness -2.362193 0.209353 -0.355827 0.146759
Kurtosis 10.61038 3.132694 2.634292 3.244709
Jarque-Bera 153.7891 0.345651 1.227036 0.279900
Probability 0.000000 0.841284 0.541443 0.869402
Sum 146.9113 102.2406 172.5948 201.5616
Sum Sq. Dev. 55.46378 51.39770 4.851510 17.54042
Observations 46 43 46 46
Source: Authors’ Computation
The descriptive statistics in Table 2 contains the mean, median and mode for the series. Kurtosis and skewness respectively shows the degree of peakedness and symmetry of the series. The dispersion in the series is also shown using standard deviation.
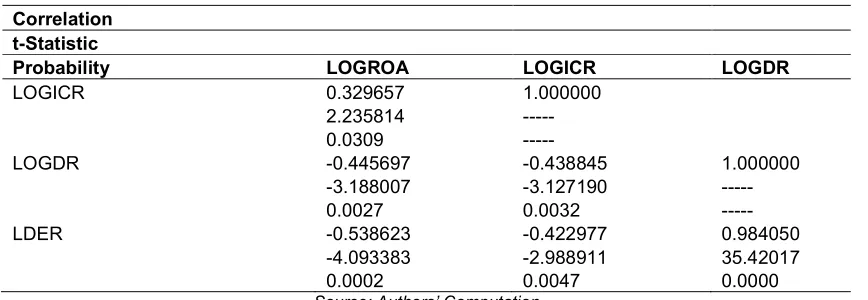
In an attempt to confirm the degree and significance of the linear association among the variables under study, Table 3 contains the correlation matrices of the proxies for return on assets and all the leverage indicators. As can be seen a number of the variables share positive and significant linear association while others share negative and significant linear association.
4.3 Test of Hypotheses
The panel least squares were used in the test of hypotheses of the four cements firms. One of the major benefits from using panel data as
compared to cross-section data on individuals is that it enables us to control for individual heterogeneity. Not controlling for these unobserved individual specific effects leads to bias in the resulting estimates.
In arriving at a decision, the following steps were taken; (i) the hypotheses were restated in null forms, (ii) the decision criterion or criteria were stated, (iii) the presentation of the Eviews result, and (iv) the selection of the more efficient model is done following the Haussmann Test results (v) the null hypothesis is rejected based on the decision criterion or criteria.
Panel Estimates: The results of the panel
regression following the fixed effect framework is presented in Table 4.
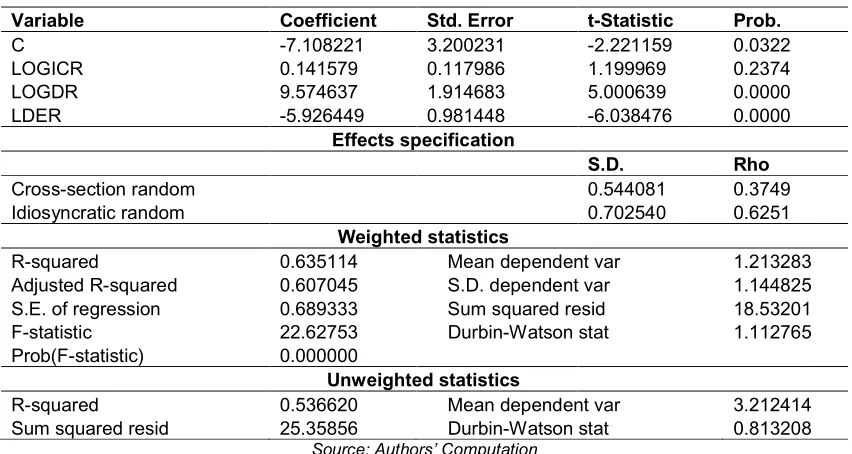
The results of the panel regression following the random effect framework is presented in Table 4.
Table 3. Correlational analyses
Correlation t-Statistic
Probability LOGROA LOGICR LOGDR
LOGICR 0.329657 1.000000
2.235814 ---
0.0309 ---
LOGDR -0.445697 -0.438845 1.000000
-3.188007 -3.127190 ---
0.0027 0.0032 ---
LDER -0.538623 -0.422977 0.984050
-4.093383 -2.988911 35.42017
0.0002 0.0047 0.0000
Table 4. Fixed effect estimates
Variable Coefficient Std. Error t-Statistic Prob.
C -6.452073 3.283471 -1.965016 0.0574
LOGICR 0.116091 0.126444 0.918129 0.3648
LOGDR 9.382828 1.944610 4.825045 0.0000
LDER -5.888687 0.990551 -5.944857 0.0000
Effects specification
Cross-section fixed (dummy variables)
R-squared 68%
Adjusted R-squared 62%
F-statistic 10.83970 Durbin-Watson stat 1.66321
Prob(F-statistic) 0.000000
Source: Authors’ Computation
Table 5. Random effect estimates
Variable Coefficient Std. Error t-Statistic Prob.
C -7.108221 3.200231 -2.221159 0.0322
LOGICR 0.141579 0.117986 1.199969 0.2374
LOGDR 9.574637 1.914683 5.000639 0.0000
LDER -5.926449 0.981448 -6.038476 0.0000
Effects specification
S.D. Rho
Cross-section random 0.544081 0.3749
Idiosyncratic random 0.702540 0.6251
Weighted statistics
R-squared 0.635114 Mean dependent var 1.213283
Adjusted R-squared 0.607045 S.D. dependent var 1.144825 S.E. of regression 0.689333 Sum squared resid 18.53201
F-statistic 22.62753 Durbin-Watson stat 1.112765
Prob(F-statistic) 0.000000
Unweighted statistics
R-squared 0.536620 Mean dependent var 3.212414
Sum squared resid 25.35856 Durbin-Watson stat 0.813208
Source: Authors’ Computation
Table 6. Haussmann test results
Test summary Chi-Sq. statistic Chi-Sq. d.f. Prob.
Cross-section random 1.547426 3 0.6714
Cross-section random effects test comparisons:
Variable Fixed Random Var(Diff.) Prob.
LOGICR 0.116091 0.141579 0.002067 0.5751
LOGDR 9.382828 9.574637 0.115497 0.5725
LDER -5.888687 -5.926449 0.017953 0.7781
Source: Authors’ Computation
The determination of the appropriate model between the fixed and random effect follows the Haussmann test results presented in Table 6.
Given that the Pvalue of the Haussmann Chi-square Statistic (67%) is greater than 5% and the
4.3.1 Test of hypothesis one
Step One: Restatement of Hypothesis in Null
and Alternate Form
H0: Debt ratio (DR) has no significant effect on
Return on Assets (ROA) of the cement manufacturing firms in Nigeria.
H1: Debt ratio (DR) has significant effect on
Return on Assets (ROA) of the cement manufacturing firms in Nigeria.
Step two: Decision Rule/criteria
Reject H0 if the statistics > 2, probability of t-statistics < 0.05; otherwise refuse to reject H0.
Step Three: Presentation of Panel Regression
Result
Step Four: Decision
Table 5 shows that the coefficient of LOGDR 9.57 and the t-statistics of 5.006 > 2 and the probability value of 0.0000< 0.05 and significant at 5% critical value. Thus, the study rejects the null hypothesis which state that Debt ratio (DR) has no significant effect on Return on Assets (ROA) of the cement manufacturing firms in Nigeria.
4.3.2 Test of hypothesis two
Step One: Restatement of Hypothesis in Null and Alternate Form
H0: Debt-Equity Ratio (DER) has no significant
effect on Return on Assets (ROA) of the cement manufacturing firms in Nigeria.
H1: Debt-Equity Ratio (DER) has significant
effect on Return on Assets (ROA) of the cement manufacturing firms in Nigeria.
Step two: Decision Rule/criteria
Reject H0 if the statistics > 2, probability of t-statistics < 0.05; otherwise refuse to reject H0.
Step Three: Presentation of Panel Regression
Result
Step Four: Decision
Table 5 shows that the coefficient of LOGDER -5.92 and the t-statistics of 6.03 > 2 and the probability value of 0.0000< 0.05 and significant at 5% critical value. Thus, the study rejects the null hypothesis which state that Debt Equity ratio (DER) has no significant effect on Return on
Assets (ROA) of the cement manufacturing firms in Nigeria.
4.3.3 Test of hypothesis three
Step One: Restatement of Hypothesis in Null
and Alternate Form
H0: Interest Coverage Ratio (ICR) has no
significant effect on Return on Assets (ROA) of the cement manufacturing firms in Nigeria.
H1: Interest Coverage Ratio (ICR) has significant
effect on Return on Assets (ROA) of the cement manufacturing firms in Nigeria.
Step two: Decision Rule/criteria
Reject H0 if the statistics > 2, probability of t-statistics < 0.05; otherwise refuse to reject H0.
Step Three: Presentation of Panel Regression Result
Step Four: Decision
Table 5 shows that the coefficient of LOGICR 0.14 and the t-statistics of 1.199 < 2 and the probability value of 0.2374 > 0.05 and non-significant at 5% critical value. Thus, the study refuses to reject the null hypothesis which state that Interest Coverage Ratio has no significant effect on Return on Assets (ROA) of the cement manufacturing firms in Nigeria.
5. DISCUSSION OF RESULTS
6. CONCLUSION
The study evaluated the effect of leverage financing on performance of quoted cement companies in Nigeria for the period 2006-2017. The research findings from this findings of the study showed that Debt ratio (DR) has an significant effect on the Return on assets (ROA) of cement manufacturing firms in Nigeria; Debt Equity Ratio (DER) has significant effect on the Return on assets (ROA) of cement manufacturing firms in Nigeria and that Interest coverage ratio (ICR) has an insignificant effect on the Return on assets (ROA) of cement manufacturing firms in Nigeria.
Overall the study has shown that quoted cement manufacturing firms in Nigeria are highly levered and employ more of long-term liabilities. As such in the case of higher debt, financial performance will rise correspondingly. The reason behind this may be due to the high interest of shorter term sources of fund. The study has also shown that leverage financing has a statistical significant effect on the corporate performance of cement manufacturing firms in Nigeria. The study on the other hand, concludes that financial leverage may constitute a major determinant of financial performance (across all the measures of performance) of quoted cement manufacturing firms in Nigeria. To address the above findings of the study, the following actions are recommendations are made, which will enable the quoted cement firms to improve corporate performance through effective use of financial leverage in their firms. It is expected that Cement firms in Nigeria should endeavor to guard their Debt cost because it impacts their firms’ ROA if it
is high, then the financial managers of cement firms should depend on their internal sources of financing in order to increase
their financial performance. Also, the results on Debt Equity ratio has confirmed that Debt Equity ratio impacts the financial performance of
the firms, hence Financial managers of cement firms should take advantage of available
credit and tax shield advantage to enhance the firm’s financial performance (ROA). It is
expected that the financial managers of cement firms should monitor the interest charged
on debt financing to avoid liquidation of the cement firms.
It is our belief that this study adds to knowledge by suggesting that Government should support sectors by giving out policy that will guard against cost levied on debt.
Lastly, it has been brought out that financial leverage can enhance firms assets in Nigeria by monitoring the interest charged on debt financing; this finding can play a role in reengineering how firms manage their leverage properties locally and internationally.
COMPETING INTERESTS
Authors have declared that no competing interests exist.
REFERENCES
1. Maina L, Kondongo O. Capital structure and financial performance in Kenya: Evidence from firms listed at the Nairobi securities exchange. Paper Presented at the Jomo Kenyatta University of Science & Technology Research Conference. Kenya; 2013.
2. Mike Anyanwaokro. Methods & processes of Bank Management, Revised and Enlarged. 2008;422.
3. Ubesie MC, Maduka FI, Udaya LK. Determinants of capital structure on corporate performance of selected cement firms in Nigeria. Department of Accountancy. International Digital Organization for Scientific Research Journal of Applied Sciences. 2016;1(1):54-67.
4. Pan African Capital Research; 2011. Available:www.panafricancapitalplc.com 5. Enekwe C, Agu C, Eziedo K. The effect of
financial leverage on financial performance: Evidence of quoted pharmaceutical companies in Nigeria. IOSR Journal of Economics and Finance (IOSR-JEF). 2014;5(3):17-25.
6. Gweyi MO, Karanja J. Effect of financial leverage on financial performance of deposit taking savings and credit co-operative in Kenya. International Journal of Academic Research in Accounting, Finance and Management Sciences. 2014;4(2):176–184.
7. Emekekwue PE. Corporate financial management. 5th Revised ed; Kinshasha: African Bureau of Educational Sciences; 2008.
8. Ekwe MC, Duru AN. Liquidity management and corporate profitability in Nigeria. ESUT Journal of Accountancy. 2012;3(1):22–28. 9. Falope O, Ajilore OT. Working capital
selected quoted firms. Nigeria Research Journal of Business Management. 2009;3(3):73–84.
10. Pratheepkanth P. Capital structure and financial performance: Evidence from business companies in Colombo stock exchange, Sri-Lanka. Researchers World Journal of Arts Science and Commerce. 2011;II(2):171-180.
11. Akinmulegun SO. The effect of financial leverage on corporate performance of some selected companies in Nigeria. Canadian Social Science. 2012;8(1):85– 91.
12. Rondk S. The impact of capital structure on firm performance: Evidence from Iraq. Bahcesehir University, Thesis. 2015;44. 13. Chinaemerem OC, Anthony O. Impact of
capital structure on the financial performance of Nigerian firms. Arabian Journal of Business and Management Review (OMAN Chapter). 2012;1(12):43- 61.
14. Naveed A, Malik MS, Muhammad N, Naqvi H. Impact of working capital on corporate performance in cement, chemical and engineering Sectors of Pakistan. Arabian Journal of Business and Management Review (OMAN Chapter). 2014;3(7). 15. Nawaz A, Atif S, Aamir FS. Impact of
financial leverage on firms’ profitability: An investigation from cement sector of Pakistan. Research Journal of Finance and Accounting. 2015;6(7):75.
Available:www.iiste.org
16. Soumadi M, Hayajneh S. Capital structure and corporate performance: Empirical study on the public Jordanian shareholdings firms listed in the Amman stock market. European Scientific Journal. 2012;8(26):173-189.
17. Suhaila AM. The effect of liquidity and leverage on financial performance of commercial state corporation sin the tourism industry in Kenya. Unpublished MBA Project, School of Business, University of Nairobi; 2014.
18. Tale W. Relationship between capital structure and performance of nonfinancial firms listed at the Nairobi securities exchange, Unpublished MBA Project, University of Nairobi; 2014.
19. Al-Taani K. The relationship between capital structure and firm performance: Evidence from Jordan. Journal of Finance and Accounting. 2013;1(3):41-45.
20. Nwude EC, ItiriI O, Agbadua BO, Udeh SN. The impact of debt structure on firm performance: Empirical evidence from Nigerian quoted firms. Asian Economic and Financial Review. 2016;6(11):647-660. 21. Asteriou D, Hall SG. Applied Econometrics
(New York), Palgrave MacMillan; 2007. 22. Brooks C. Introductory econometrics for
finance(New York) Cambridge University Press 3rd Edition; 2014.
23. Kaumbuthu AJ. The relationship between capital structure and financial performance: A study of firms listed under industrial and allied sector at the NSE, (MBA Dissertation, University of Nairobi, 2011); 2011.
Available:http://erepository.uonbi.ac.ke 24. Al-Shamaileh M, Khanfar S. The effect of
the financial leverage on the profitability in the tourism companies (Analytical Study- Tourism Sector- Jordan). Business and Economic Research. 2014;4(2):251–264. 25. Fengju X, Fard R, Maher L, Akhteghan N.
The relationship between financial leverage and profitability with an emphasis on income smoothing in Iran‟s capital market. European Online Journal of Natural and Social Sciences. 2013;23(s): 156-164.
26. Banchuenvijit W. Determinants of Capital Structure of Listed Companies in Thailand. University of the Thai Chamber of Commerce; 2011.
27. Srivastava N. Determinants of leverage of Indian companies: An empirical analysis (A study of Cement Industry in India). Merit Research Journal of Art, Social Science and Humanities. 2014;2(2):021-024.
© 2019 Ivo and Anyanwaokoro; This is an Open Access article distributed under the terms of the Creative Commons Attribution License (http://creativecommons.org/licenses/by/4.0), which permits unrestricted use, distribution, and reproduction in any medium, provided the original work is properly cited.
Peer-review history: