http://www.sciencepublishinggroup.com/j/ijmi doi: 10.11648/j.ijmi.20190703.12
ISSN: 2330-8303 (Print); ISSN: 2330-832X (Online)
The Utility of Diffusion Weighted Imaging and Dynamic
Contrast Enhanced MRI Techniques in Differentiation
Between Benign and Malignant Uterine Masses
Al
-
Shimaa Magdy Ammar
1, Mohammed Mahmoud Dawoud
1, Mohamed Mohamed Hefeda
1,
Manal Ezzat Badawy
1, Essmat Hamdy Abozaid
21Radiology Department, Tanta University, Tanta, Egypt
2Department of Obstetric and Gynecology, Faculty of Medicine, Tanta University, Tanta, Egypt
Email address:
To cite this article:
Al-Shimaa Magdy Ammar, Mohammed Mahmoud Dawoud, Mohamed Mohamed Hefeda, Manal Ezzat Badawy, Essmat Hamdy Abozaid. The Utility of Diffusion Weighted Imaging and Dynamic Contrast Enhanced MRI Techniques in Differentiation Between Benign and Malignant Uterine Masses. International Journal of Medical Imaging. Vol. 7, No. 3, 2019, pp. 66-80. doi: 10.11648/j.ijmi.20190703.12 Received: July 12, 2019; Accepted: August 15, 2019; Published: September 30, 2019
Abstract:
The aim of the present study was to evaluate the role of diffusion weighted imaging (DWI) and dynamic contrast enhanced magnetic resonance imaging (DCE-MRI) in the differentiation between benign and malignant endometrial, uterine and cervical masses. The study included 78 patients. All patients had uterine or cervical masses on ultrasound examination. All patients had conventional MRI, DWI, and DCE-MRI. The patients were classified into three groups: patients with endometrial masses, myometrial lesions and cervical masses. The mean ADC value of benign endometrial and myometrial lesions was higher significantly from malignant lesions (P value <0.001 and <0.001). The cut off value of ≤1.1×10⁻³mm2/sec as a predictor of malignant lesions yielded a sensitivity, specificity, PPV, NPV and accuracy of 89.65%, 91.54%, 88.67%, 92.41% and 95.21% respectively. The semi-quanitative parameters of DCE-MRI including the enhancement amplitude (EA), maximum slope (MS) and time of half rising (THR), all showed significant difference between the benign and malignant lesion in endometrial, myometrial and cervical lesions. In clinically and sonographically indeterminate endometrial, myometrial or cervical masses, DWI and DCE-MRI proved to be more accurate than conventional MRI in differentiation between benign and malignant masses, with the DWI and ADC value had more sensitivity and specificity especially in endometrial masses and should be included in the routine pelvic MRI. DCE-MRI should be reserved for still questionable cases after DWI and to study the vascularity of the lesions.Keywords:
Uterine Masses, Endometrial Masses, DWI, Dynamic Contrast MRI, Functional MRI1. Introduction
Globally, Cancer uterine body and cervix ranked as the 5th and 3rd most common malignancies in females respectively [1, 2]. In Egypt, uterine cancer is ranked as the 10th most common cancer with increasing incidence in recent years [3, 4]. Most uterine cancers arise from the endometrium (90%) and only 8% arise from the myometrium [4].
Ultrasound, which used to be the initial screening investigation for imaging of uterine lesions, has considerable limitations including restricted field of view and overlap in
Diffusion weighted imaging (DWI) is a functional MRI technique, depends on Brownian motion of water molecules, with the signal intensity influenced by factors like number of cells, viscosity of intracellular and extracellular spaces, and tortuosity of the extracellular spaces,. The proton motion decreases in neoplastic and inflammatory processes [9, 10]. Apparent diffusion coefficient (ADC) is the quantitative derivative of the DWI and known to influenced by cellular density and nucluear to cytoplasmic ratio in solid tissues [11-14]. Low ADC values in malignant tissues compared to benign lesions has been described in different organs [15-18]. The accuracy of DWI in uterine and cervical masses have been previously reported [19, 20], Also, some authors have attempted ADC value measurement in the uterine myomas [21, 22].
Dynamic contrast enhanced MRI (DCE-MRI) depends on the rapid acquisition of T1WI in different phases to assess vasculaity and permeability of tissues [23]. The enhancement pattern in DCE MRI reflects the intratumoral vascularity, which provides physiological and anatomical details useful for treatment planning [24]. Dynamic contrast enhanced- MRI depends on the availability of fast MRI sequences obtained before, during and after rapid intravenous injection of gadolinium based contrast media. Interpretation of DCE-MRI data can be quantitative or semi-quantitative [25, 26].
The aim of this study is to evaluate the diagnostic accuracy of diffusion weighted imaging and dynamic contrast enhanced MRI in differentiation between benign and malignant uterine and cervical masses.
2. Patients and Methods
2.1. Study Population
This cross sectional prospective study included seventy – eight patients with uterine masses. Institutional research ethics committee approved the study and signed informed consent was obtained from all patients. The study was conducted from October 2016 to March 2019. The final diagnosis of all patients and the mean age in each group is summarized in table 1. All diagnosis was histopathologically proves after myomectomy (13 patients), hysterectomy (42 cases), hystrectmy with bilateral salpingeo-oophrectomy (15 cases) or radical hysterectomy (8 cases). Fifty one (65.4%) were pre-menopausal and 27 (34.6%) were post-menopausal.
The exclusion criteria of this study included patients with myomas<2cm, patients with no histopathological confirmation and patients with contraindication to MRI examination or contrast.
2.2. MRI Protocol
In the current study we used wither Toshiba vantage titan 1.5 Tesla & GE signa explorer 1.5 Tesla (General Electric Healthcare, Milwaukee, USA) MRI units with the same protocol parameters. The sequences and parameters are
summarized in table 2. Patients were asked to fast for 4 hours, all patients received intravenous antispasomid drug (10 mg tiemonium methylsulfate; Visceralgine) to inhibit intestinal movement. All sequences was obtained with phased array surface coil.
2.3. Diffusion Weighted MRI
Diffusion weighted imaging was acquired in all patientsin the axial or the sagittal plane prior to administration of contrast medium by using a single shot echo-planar imaging sequence with multipleb values. The b values was 0, 500,800,1000s/mm2) in axial protocol and only two values in sagittal focused protocol (500&1000 s/mm2).
2.4. Dynamic Contrast Enhanced MRI Study
post contrast T1 fat sat LAVA Flex images (on GE signa explorer 1.5 Tesla) O post contrast T1 fat sat THRIVE (High Resolution Isotropic Volume Examination) on TOSHIBA vantage titan 1.5 Tesla were obtained immediately after rapid intravenous injection of 0.1mmol/kg of Magnivist (Dadopentate dimeglumine, Schering, Berlin, Germany) which was followed by injection of 20 mL of normal saline flushing the tube. Images were obtained sequentially at 0,30,60,90 and120 seconds, The parameters was as follows: Field of view 40mm, slice thickness 4mm, 3D thickness 4, slice gap0mm, number of slices 84, TR 4.4ms, TE 2.1ms, flip angle 12 degrees, slice spacing 0 mm. Also, delayed axial T1 WI with the following parameters (TR/TE:450-650 msec/10-16msec, slice thickness 7mm, slice spacing 1.5mm), delayed sagittal post contrast T1WIwith the following parameters (TR/TE: 450-650/10-16ms; slice spacing 1mm, slice thickness 5mm, number of slices 25) and post contrast delayed coronal T1WI (TR/TE: 450-650/10-16ms; slice spacing 1mm, slice thickness 5mm, number of slices 25).
2.5. Interpretation of MRI
The MRI images were reviewed for the following: size and location of the lesion, contour of the lesion (regular or irregular), signal intensity on different sequences, presence of hemorrhage, cystic changes or fat. Thickness of the endometrium, myometrial infiltration, cervical stromal infiltration. Presence of infiltrated pelvic or para aortic lymph nodes. Involvement of other pelvic organs.
The T2 Signal intensity was interpreted in relation to gluteal muscle, a low T2 SI means that the SI of the lesion was similar to the gluteal muscle and an intermediate T2 SI when the signal intensity is higher than gluteal muscle. The signal intensity of the lesion was said to have high T2 SI when it is higher than the outer myometrium.
2.6. Interpretation of DWI
intensity on diffusion images with low signal in the corresponding ADC maps (restricted). On DWI, the signal intensity was classified as high when it its equal or higher than the signal intensity of the endometrium.
Quantitative analysis: Regarding the quantitative analysis of DWI, we generated the ADC map on commercially available work station, and then we selected the region of interest manually (the ROI was set as large as possible within the confines of the tumor) which was then automatically calculated on the work station to get the ADC values. For each lesion, the ADC values were calculated three times and the average of the measures was calculated and recorded. ROI were placed away from areas of necrosis and cystic changes.
2.7. Interpretation of DCE-MRI
Analysis of Dynamic Contrast-enhanced MR Images Dynamic data analyze in consensus at a workstation. The entire mass is included in all phases of dynamic run acquisition at 120 second after gadolinium injection. A region of interest (ROI) is manually drawn over the most avidly enhancing mass of the lesion that can be helped by color map. Signal intensity (SI)-time curve was generatd.
There were three types of time intensity curve Type I (gradual rising curve), Type II (plateau curve) and type III (rapid rising curve and rapid wash out).
Semi-Quantitative Dynamic Contrast-enhanced MR Imaging.
Multiple values calculated automatically on the work station after ROI Drawn at the most enlaced region of the mass, through which detected EA (enhancement amplitude), Ms (maximum slope of the curve) and THR (time of half rising).
The mean of the values was calculated for benign, border line and malignant masses.
2.8. Statistical Analysis
Mean values and standard deviation were calculated for the parameters studied. The sensitivity, specificity, PPV, NPV, and overall diagnostic accuracy for the DWI and DCE-MRI were calculated. Chi square test and Fisher exact test were used to compare two by two tables in small samples. The Mann-Whitney U test was used for the comparison between variables and p value acquisition The receiver operating characteristic curve (ROC) was generated for different parameters and the areas under the ROC were calculated (Figure 1). The extended McNemar x2 testwas used to compare the statistal significance between the sensiticity and specificity of different techniques. Associations between assessment of uterine masses and possible pitfalls previously mentioned on T2W images were examined by implementing Fisher exact test. P value < 0.05 was considered statistically significant. All analyses were performed using SPSS Version 14 and Stat-Exact 4.
Figure 1. ROC curve for ADC to predict malignant cases in uterine masses.
AUC: Area Under a Curve P value: Probability value CI: Confidence Intervals
3. Results
The mean age of patients with malignant masses was significantly higher than patients with benign masses (50.4+4.2years VS 39.3+3.5years, P value<0.001).
3.1. MRI Lesion Characteristics (Table 3)
Table 3. Conventional MRI findings in the 78 patients.
Endometrial Myometrial Cervical
P value benign Malignant Benign Malignant Benign Malignant
Size (mm) 14.2+4.6 35.7j±5.4 104.3+4.3 12.5+3.4 21.3+3.4 45.3+5.4 0.54
Outline:
Regular 20 (90.9%) 1 (10%) 19 (82.6%) 2 (33.3%) 11 (84.6%) <0.01
Irregular 2 (9.1%) 9 (90%) 4 (17.4%) 4 (66.7%) 2 (15.4%) 4 (100%)
Cystic changes
Yes 3 (13.6%) 3 (30%) 6 (20.1%) 3 (50%) 5 (38.5%) 2 (50%) 0.42
No 19 (86.4% 7 (70%) 17 (79.9%) 3 (50%) 8 (61.5%) 2 (50%)
T2 Signal
Low 7 (31.8%) 14 (60.9%) 5 (38.5%)
Intermediate 8 (36.4%) 2 (30%) 5 (21.7%) 1 (16.7%) <0.05
High 6 (22.3%) 5 (50%) 2 (8.7%) 4 (66.7%) 5 (38.5%) 1 (25%)
Hetrogenous 2 (9.1%) 3 (30%) 2 (8.7%) 1 (16.7) 3 (23.0%) 4 (75%)
Intralesional haemorrhage
Yes 2 (9.1%) 8 (80%) 4 (17.4%) 2 (33.3%) 2 (15.4%) 3 (75%) 0.01
No 20 (90.9%) 2 (20%) 19 (82.6%) 4 (66.7%) 11 (84.6%) 1 (25%)
Pelvic fluid
Yes 3 (13.6%) 2 (30%) 13 (56.5%) 5 (33.3%) 5 (38.5%) 2 (50%) 0.34
No 19 (86.4%) 8 (80%) 10 (43.5%) 1 (66.7%) 8 (61.5%) 2 (50%)
Regional lymph nodes
Yes 2 (9.1%) 6 (60%) 4 (17.4%) 4 (66.7%) 3 (75%) <0.05
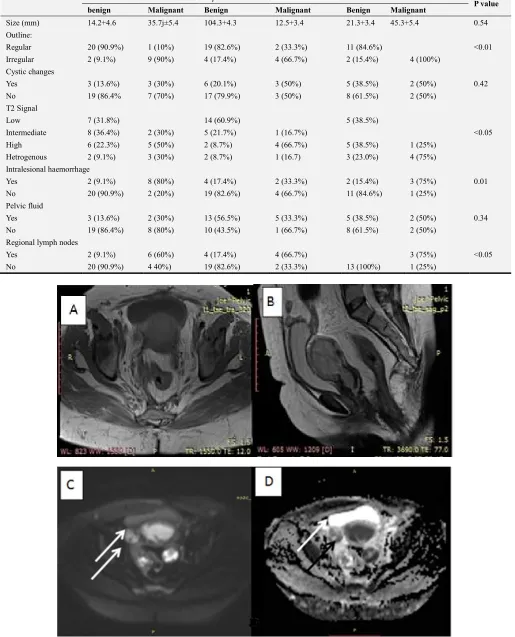
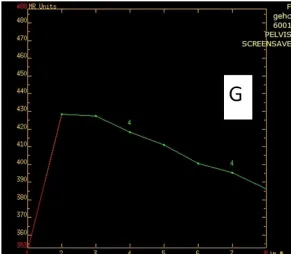
Figure 3. Female aged 34 years presented with excessive vaginal bleeding with high blood BHCG. A&B) Axial T1WI & sagittal Axial T2WI showed isointense signal intensity of anterior uterine wall mass with central high signal intensity denoting subacute hemorrhage, The mass shows high signal encroaching upon the endometrial cavity. C & D: Sagittal DWI (b value =800) showed heterogeneously restricted diffusion of the anterior uterine wall mass lesion. The ADC map showed low signal of the lesion with ADC values (0.72 x 10⁻³ mm2/sec). E. F & G: Dynamic study through axial T1 fat sat post contrast showed rapid and early enhancement of the anterior uterine wall mass, Post processing color map and post processing time intensity curve showed type III curve (rapid enhancement of the mass with rapid wash out) with EA 300, MS 11, and THR 27 mm/sec.. Pathology: Anterior uterine wall choriocarcinoma.
3.2. Diffusion Weighted Imaging (Tables 4, 5 &6)
Most malignant endometrial lesions showed restricted diffusion (71.4% of endometrial carcinoma and 66.6% of choriocarcinoma), with only 1 false positive result (Figure 4). On the other hand, all benign lesions (except one) showed non restricted diffusion, with either hypointense signal or isointense signal, with statistically significant difference (P= <0.05).
In the current study, we had six pathologically proven sarcoma, of which 5 showed high signal on DWI (restricted
diffusion). Three myomas (21.4%) showed restricted diffusion. Most benign myomas showed hypointense signal (Figure 5) on DWI (8/14, 57.1%). The study included 4 cervical carcinoma, three of which showed restricted diffusion (75%). All cervical myomas in the current study showed non restricted diffusion.
PPV, NPV and accuracy of89.65%, 91.54%, 88.67%, 92.41% and 95.21% respectivelt in the diagnosis of malignant endometrial lesions. For myometrial masses, the same cut off value yielded sensitivity, specificity, PPV, NPV and accuracy of81.42%, 87.21%, 76.67%, 91.31% and 88.87% respectively in
the prediction of malignant myometrial lesions (Figure 1). We used the same cut off value of <1.1 ×10⁻³mm2/sec as a predictor of malignant cervical masses, with sensitivity, specificity, PPV, NPV and accuracy of80.21%, 93.31%, 81.56%, 93.21% and 90.32% respectively.
Table 4. Signal intensity of different uterine lesions on DWI.
Signal intensity on DWI
P value Hyperintense Isointense Hypointense
Endometrial lesions
Endometrial hyperplasia 0/13 (0.00%) 7/13 (53.8%) 5/13 (38.4%)
Endometrial polyp 1/9 (11.1%) 3/9 (33.3%) 5/9 (55.5%) <0.05
Endometrial carcinoma 5/7 (71.4%) 1/7 (14.2%) 1/7 (14.2%)
Choriocarcinoma 2/3 (66.6%) 1/3 (33.3%) 0/3 (0.00%)
Myometrial
Myoma 3/14 (21.4%) 3/14 (21.4%) 8/14 (57.1%)
Adenomyoma 0/9 (0.00%) 1/9 (11.1%) 8/9 (88.9%) <0.05
Sarcoma 5/6 (83.3%) 1/6 (16.7%) 0/6 (0.00%)
Cervical
Myoma 0/5 (0%) 1/5 (20%) 4/5 (80%) <0.01
Polyp 1/8 (12.5%) 2/8 (25%) 5/8 (62.5%)
Carcinoma 3/4 (75%) 1/4 (25%) 0/4 (0%)
Table 5. ADC value in the different lesions.
ADC values of the uterine mass ×10-3mm2/sec. P
Min.–Max. Mean±SD. Median
Endometrial lesions
Endometrial hyperplasia 0.93-1.52 1.21 ± 0.21 1.24
Endometrial polyp 0.82-1.65 1.31 ± 0.32 1.27 <0.001
Endometrial carcinoma 0.65-1.02 0.82 ± 0.39 0.85
Choriocarcinoma 0.71-0.94 0.79 ± 0.46 0.82
Myometrial
Myoma 0.83-2.82 1.61 ± 1.11 1.74
Adenomyoma 1.02-1.95 1.41 ± 0.62 1.49 <0.001
Sarcoma 0.85-1.22 0.87 ± 0.42 0.88
Cervical
Myoma 0.98-1.82 1.41 ± 0.57 1.45
Polyp 0.78-1.35 1.29 ± 0.81 1.31 <0.001
Carcinoma 0.69-0.98 0.78 ± 0.34 0.80
p: p value for comparing between the studied groups *: Statistically significant at p ≤ 0.05
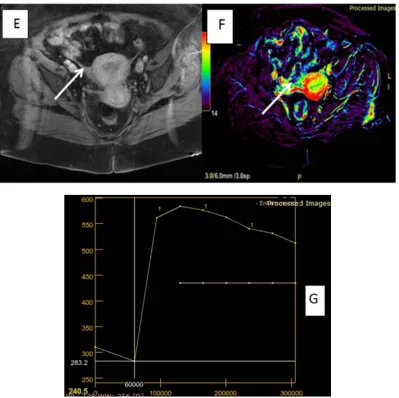
Table 6. Diagnostic accuracy of DWI & ADC in differentiation between benign and malignant masses in the current study.
sensitivity Specificity PPV NPP c2 FEp Accuracy
Endometrial masses
DWI (Qualitative) 85.71% 96.55% 85.71% 96.55% 0.0002 0.0001 94.44%
ADC (Quanitative) 89.65% 91.54% 88.67% 92.41% 0.0002 0.0001 95.21%
Myometrial masses
DWI (Qualitative) 83.33% 86.96% 62.50% 95.24% 0.003 0.001 86.21%
ADC (Quanitative) 81.42% 87.21% 76.67% 91.31% 0.002 0.001 88.87%
Cervical masses
DWI (Qualitative) 75.00% 92.31% 75.00% 92.31% 0.002 0.001 88.42%
ADC (Quanitative) 80.21% 93.31% 81.56% 93.21% 0.002 0.001 90.32%
χ2: Chi square testFE: Fischer exact t
3.3. Dynamic Contrast Enhanced MRI
Qualitative DCE MRI:
Most benign endometrial lesions had Type I curve (17/22, 77.2%), with only one lesion showed type III curve (4.5%). Ninety percent of malignant lesion had type III curve. The difference was statistically different (P<0.001).
Four benign myomas had type III curve, but 17myomas showed type I curve. All malignant sarcomas had Type III
curve (Table 7).
Of the 4 cervical carcinoma encountered in the study, 3 (75%) had type III curve, an one had Type II curve. Most of the benign cervical lesions had type I curve (9/13, 69.2%), and only one lesion had type III curve (7.7%). The difference between the benign and malignant lesions was statistically significant (0.001) (Figure 6).
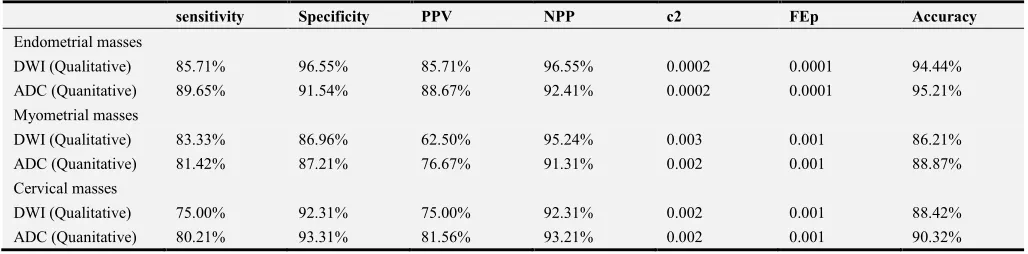
Table 7. Types of curves in different lesions in dynamic contrast enhanced MRI.
Types of curves FEp χ2
Type I Type II Type III
Endometrial lesions
0.001 10.801
Benign lesions 17/22 (77.2%) 4/22 (18.1%) 1/22 (4.5%)
Malignant lesions 0/10 (0.00%) 1/10 (10.0%) 9/10 (90.0%)
Myometrial
0.003* 10.811*
Benign lesions 16/23 (69.6%) 3/23 (13.04%) 4/23 (17.4%)
Malignant lesions 0/6 (0.00%) 0/6 (16.7%) 6/6 (100%)
Cervical
0.001 10.755
Benign lesions 9/13 (69.2%) 3/13 (23.1%) 1/13 (7.7%)
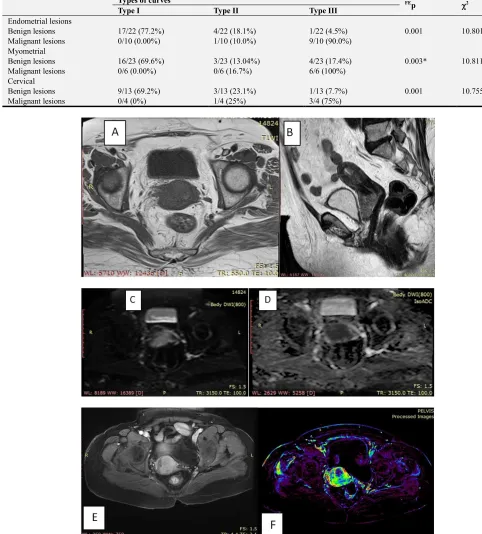
Figure 6. Patient aged 65 years with vaginal bleeding (A&B) Axial T1WI & sagittal T2WI showed isointense signal endocervical mass in T1WI and high signal in sagittal T2WI. C&D Axial DWI (b value =800) showed restricted DWI of endocervical mass D): ADC map showed low signal of the lesion with ADC values (0.90×10⁻³ mm2/sec). E, F&G) Dynamic contrast study through axial T1 fat sat showed rapid and early enhancement of the cervical mass and rapid wash out, post processing color map and post processing time intensity curve showed type III curve (rapid enhancement of the mass with rapid wash out) with EA 270, MS 12, and THR 30 mm/sec. Final pathological diagnosis: Cervical carcinoma.
Quantitative DCE MRI:
In the current study the enhancement amplitude (EA), maximum slope (MS) and time of half rising (THR), all showed significant difference between the benign and malignant lesion in endometrial, myometrial and cervical lesions (Table 8). The enhancement amplitude for benign endometrial lesions was 226.20 which is significantly
different from the malignant lesions 270.25 (P=<0.01). The maximum slope in benign endometrial lesions was 6.83, and in malignant endometrial lesions 11.42 (P<0.001).
In general the accuracy of the DCE MRI in the differentiation between benign and malignant masses was 90.23% in endometrial masses, 88% in myometrial masses and 92.43% in cervical masses (table 9).
Table 8. Comparison of semiquantative values of dynamic contrast enhanced between the benign and malignant masses.
Parameters (mean + SD)
EA MS THR
Endometrial lesions
Benign lesions 226.20 ± 20.83 6.83 ± 3.44 57.43 ± 11.02
Malignant lesions 270.25 ± 42.70 11.42 ± 0.24 34.75 ± 10.28
P value <0.01 <0.001 <0.011
Myometrial
Benign lesions 238.26 ± 31.72 5.93 ± 4.14 51.51 ± 9.19
Malignant lesions 281.12 ± 52.54 12.32 ± 0.84 32.55 ± 9.18
P value <0.001 <0.001 <0.001
Cervical
Benign lesions 224.11 ± 18.73 7.23 ± 2.56 53.28 ± 12.02
Malignant lesions 273.12 ± 35.68 10.42 ± 0.16 32.34 ± 11.21
Pa value <0.001 <0.001 <0.001
EA: enhancement amplitude. MS maximum slope, THR: time of half rising
Table 9. Doagnostic accuracy of Dynamic contrast enhanced MRI in differentiation between benign and malignant lesions.
sensitivity Specificity PPV NPP χ2 FEp Accuracy
Endometrial masse 91.60% 88.67 94.86 94.86 10.811* 0.003* 90.23
Myometrial masses 100% 82.72 92.23 92.23 10.711* 0.001* 87
4. Discussion
Our results emphasized the important role of DWI and DCE-MRI in the pre-operative diagnosis of endometrial, myometrial and cervical lesions.
Endometrial lesions represent a diagnostic challenge because of the overlap in the sonographic and MRI appearance between benign and malignant lesions [27, 28]. In the current study, most malignant lesions had irregular outline (90%), high or intermediate signal on T2 WI (80%), while benign endometrial lesions had regular outline (90.9%), and either low or intermediate signal (68.2%). Our results are close to those of Kierans et al [27] who reported the irregular myometrial-endometrial interface as the most differentiating sign between benign and malignant endometrial lesions. Most endometrial malignancies (70%) showed hyperintense signal on DWI, with mean ADC value, with the mean ADC value for endometrial carcinoma was0.82 ± 0.39×10⁻³mm2/s which is lower than the mean value of endometrial hyperplasia and endometrial polyp (1.21+0.21 ×10⁻³mm2/s, and 1.31+0.32 ×10⁻³mm2/s respectively). The accuracy of quantitative and qualitative DWI in the current was higher other modalities and higher than the DWI accuracy in myometrial or cervical lesions. Our results are in agreement with those of Fuji et al (28), who reported sensitivity, specificity and accuracy of 84.6%, 100% and 92% respectively in a study included 25 patients. Also, Elsammak et al (29), in a study included 42 patients reported a significantly low ADC value in malignant lesions than benign lesions (0.82+1.09×10⁻³mm2/s Vs 1.44+0.15×10⁻³mm2/s respectively).
Also, our results showed that the DWI is more accurate than DCE-MRI in the diagnosis of endometrial carcinoma (95.21% Versus 90.23%). Beddy et al [30] compared the performance of DWI and DCE-MRI in staging of endometrial carcinoma. They reported that DWI is more accurate in staging and detection of myometrial invasion than DCE-MRI. They explained their results by the presence of associated leimomyoam or adenomosis, loss of tumor to myometrium contrast, poor definition of junctional zone, and extension of the tumor to the cornua, and they stated this factors may affect DCE-MRI than DWI.
In the current study, 5 sarcomas (83.3%) showed hyperintense signal on DWI, with the mean ADC value 0.87±0.42×10⁻³mm2/sec, which significantly lower than that of myomas 1.61±1.11 ×10⁻³mm2/sec. However, 21.3% of myomas shows hyperintense signal on DWI. The accuracy of DWI in differentiation between myomas and sarcomas was 86.21%. The restricted diffusion in malignant tissues is caused by hypercellularity, irregular nuclear outline and large nuclei which result in limitation of water molecules movements [31-33]. Tamai et al [34] reported that some cellular myomas may not be differentiated from sarcomas based on DWI and ADC values. In the current study most of myomas (58.1%) showed hypointense signal. The low signal on DWI of the myomas is explained by the T2 blackout
effect which indicates hypointense signal on DWI due to hypointense signal on T2 WI [35, 36]. The ADC value of myomas may show wide range reflecting the variability in cellularity and presence of hyalainized tissue within the myomas [37]. Also, the presence of non parallel collagen fibers may be a cause of the restricted diffusion observed in some myomas [38].
In the current study, we used semi-quantitative parameters which are less accurate than quantitative parameters but they are easily evaluated, more applicable in daily practice, and do not need complicated post processing [39].
In the current study all sarcomas had type III time intensity curve (malignant type with rapid washout), on the other hand most myomas (69.6%) had type I curve, with statistically significant difference (P=0.003). Our results are not similar to those of Thomassin-Naggara et al [40], who reported type III curve in 4/18 (22.2%) in malignant group, the cause of difference between our results and their results is that the malignant group in their study contained malignant and border line lesions. Shimada et al [22] in a study included 30 patients with uterine myomas found the degree of hyalinization inversely proportionate to the degree of enhanacement and intra-tumoral vessel density. Our results are approximate to those of Tamburrini et al [41], who reported type III curve in all 8 malignant uterine sarcomas included in their study and reported four cases (of thirty four myomas) with benign myomas.
The uterine cervix malignancy is more common than uterine sarcoma, and is still a significant health problem in developing countries [42] The mean ADC value in malignant cervical masses (0.78±0.34×10⁻³mm2/sec) was significantly lower than cervical myoma (1.41±0.57×10⁻³mm2/sec), which is similar to the results of Kilickesmez et al [43] who reporeda mean ADC value of benign and malignant masses to be (1.55±0.33×10⁻³mm2/sec and 0.88±0.11 ×10⁻³mm2/sec respectively). Also they used a cut off value 1.05×10⁻³mm2/sec, close to the cut off value 1.1×10 -3
mm2/sec used in the current study and they reported asensitivity, specificity, and accuracy of 95.83%, 94.55%, and 94.94%.
In general, both DCE-MRI and DWI sequences provide functional informations abut changes in angiogenesis, perfusion, oxygenation, and tumour microstructure and can yield quantitative or semi-quantitative parameters which are a potential biomarker of tumour [44, 45].
There are some limitations in our study. First, the small sample size of the uterine sarcoma. Second, the study population was partially selected and consisted of non-consecutive patients. Third, menstrual phase and the menstrual state (whether pre-menpausal or postmenopausal) of the patients was not recorded and correlated with the results.
5. Conclusion
the DWI and ADC value had more sensitivity and specificity especially in endometrial masses and should be included in the routine pelvic MRI. DCE-MRI should be reserved for
still questionable cases after DWI and to study the vascularity of the lesions.
Appendix
Table A1. Different lesions encountered in the study.
No Age mean±SD
Endometrial lesions
Endometrial hyperplasia 13 38.4±6.7 years
Endometrial polyp 9 42.3±5.4 years
Endometrial carcinoma 7 51.7±5.4 years
Choriocarcinoma 3 25.5±2.7 years
Myometrial
Myoma 14 33.5±7.8 years
Adenomyoma 9 39.6±5.4 years
Sarcoma 6 50.3±6.2 years
Cervical
Myoma 5 31.3±5.4 years
Polyp 8 29.7±3.3 years
Carcinoma 4 56.3±3.2 years
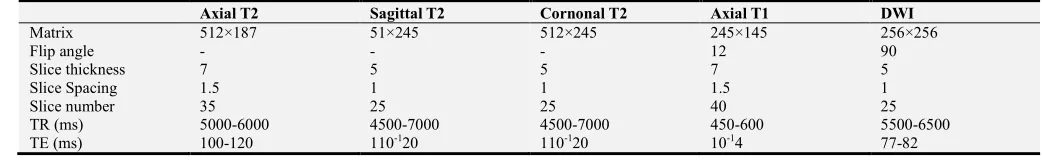
Table A2. Parameters of MRI sequences in the current study.
Axial T2 Sagittal T2 Cornonal T2 Axial T1 DWI
Matrix 512×187 51×245 512×245 245×145 256×256
Flip angle - - - 12 90
Slice thickness 7 5 5 7 5
Slice Spacing 1.5 1 1 1.5 1
Slice number 35 25 25 40 25
TR (ms) 5000-6000 4500-7000 4500-7000 450-600 5500-6500
TE (ms) 100-120 110-120 110-120 10-14 77-82
References
[1] Jemal A, Bray F, Center MM, Ferlay J, Ward E, and Forman D, “Global cancer statistics,” CA: A Cancer Journal for Clinicians, vol. 61, no. 2, pp. 69-90, 2011.
[2] Forman D, Bray F, Brewster D et al., Cancer Incidence in Five Continents, Vol. X. Cancer Incidence in Five Continents, IARC, Lyon, France, 2013.
[3] Freedman LS, Edwards B, Ries L, and Young J, Cancer Incidence in Four Member Countries (Cyprus, Egypt, Israel, and Jordan) of the Middle East Cancer Consortium (MECC) Compared with US SEER. Cancer Incidence in Four Member Countries (Cyprus, Egypt, Israel, and Jordan) of the Middle East Cancer Consortium (MECC) Compared with US SEER, 2006.
[4] Alshahrani S, Soliman AS, Hablas A, et al. Changes in Uterine Cancer Incidence Rates in Egypt. Obstetrics and Gynecology International. Volume 2018, Article ID 3632067, 10 pages.
[5] Bonneau C. Value of ultrasonography and magnetic resonance imaging for the characterization of uterine mesenchymal tumors. Acta Obstetricia et GynecologicaScandinavica. 2014; 93 (3): 261-268.
[6] Dueholm M, Lundorf E, Hansen ES, et al. Accuracy of magnetic resonance imaging and transvaginal ultrasonography in the diagnosis, mapping, and measurement ofuterine myomas. Am J Obstet Gynecol. 2002; 186 (3): 409-15. PMid: 11904599 http://dx.doi.org/10.1067/mob.2002.121725
[7] Amant F, Coosemans A, Debiec-Rychter M, et al. Clinical management of uterine sarcomas. Lancet Oncol. 2009; 10: 1188. http://dx.doi.org/10.1016/S1470-2045 (09) 70226-8. [8] Sahdev A, Sohaib SA, Jacobs I et al (2001) MR imaging of
uterine sarcomas. AJR Am J Roentgenol 177: 1307-1311. [9] Ueda H, Togashi K, Konishi I et al (1999) Unusual
appearances ofuterine leiomyomas: MR imaging findings and their histopathologic backgrounds. Radiographics 19 Spec No: S131-S145.
[10] Qayyum A. Diffusion-weighted imaging in the abdomen and pelvis: concepts and applications. Radiogr Rev Publ Radiol Soc N Am Inc. 2009; 29: 1797-810.
[11] Nakamura K, Kajitani S, Joja I, Haruma T, Fukushima C, Kusumoto T, et al. The post treatment mean apparent diffusion coefficient of primary tumour is superior to pretreatment ADC mean of primary tumour as a predictor of prognosis with cervical cancer. Cancer Med. 2013; 2: 519-25. [12] Lyng H, Haraldseth O, Rofstad EK (2000) Measurement of cell density and necrotic fraction in human melanoma xenografts by diffusion weighted magnetic resonance imaging. Magn Reson Med 43: 828-836.
[13] Sumi M, Ichikawa Y, Nakamura T (2007) Diagnostic ability of apparent diffusion coefficients for lymphomas and carcinomas in the pharynx. Eur Radiol 17: 2631-263.
[15] Matsuki M, Inada Y, Nakai G, Tatsugami F, Tanikake M, Narabayashi I, Masuda D, Arisaka Y, Takaori K, Tanigawa N (2007) Diffusion-weighed MR imaging of pancreatic carcinoma. Abdom Imaging 32 (4): 481-48.
[16] Jacobs MA, Herskovits EH, Kim HS (2005) Uterine fibroids: diffusion weighted MR imaging for monitoring therapy with focused ultrasound surgery-preliminary study. Radiology 236: 196-203.
[17] Matsuki M, Inada Y, Tatsugami F, Tanikake M, Narabayashi I, Katsuoka Y (2007) Diffusion-weighted MR imaging for urinary bladder carcinoma: initial results. Eur Radiol 17: 201-204.
[18] Tasu K, Kuroki Y, Nawano S, Kuroki S, Tsukamoto T, Yamamoto S, Motoori K, Ueda T (2006) Hepatic metastases: diffusion-weighted sensitivity-encoding versus SPIO-enhanced MR imaging. Radiology 239: 122-130.
[19] Naganawa S, Sato C, Kumada H, Ishigaki T, Miura S, Takizawa O (2005) Apparent diffusion coefficient in cervical cancer of the uterus: comparison with the normal uterine cervix. Eur Radiol 15: 71-78.
[20] Tamai K, Koyama T, Saga T, Umeoka S, Mikami Y, Fujii S, Togashi K (2007) Diffusion-weighted MR imaging of uterine endometrial cancer. J Magn Reson Imaging 26: 682-687. [21] Liapi E, Kamel IR, Bluemke DA, Jacobs MA, Kim HS (2005)
ssessment of response of uterine fibroids and myometrium to embolization using diffusion-weighted echoplanar MR imaging. J Comput Assist Tomogr 29: 83-86.
[22] Shimada K, Ohashi I, Kasahara I, Watanabe H, Ohta S, Miyasaka N, Itoh E, Shibuya H (2004) Differentiation between completely hyalinized uterine leiomyomas and ordinary leiomyomas: three-phase dynamic magnetic resonance imaging (MRI) vs diffusion weighted MRI with very small b-factors. J Magn Reson Imaging 20: 97-104. [23] Gaustad JV, Brurberg KG, Simonsen TG, Mollatt CS, Rofstad
EK. Tumor vascularity assessed by magnetic resonance imaging and intravital microscopy imaging. Neoplasia. 2008; 10 (4): 354-62. doi: 10.1593/neo. 08162.
[24] Kim YE, Lim JS, Choi J, Kim D, Myoung S, Kim MJ, et al. Perfusion parameters of dynamic contrast-enhanced magnetic resonance imaging in patients with rectal cancer: correlation with microvascular density and vascular endothelial growth factor expression. Korean J Radiol. 2013; 14 (6): 878-85. doi: 10.3348/kjr.2013.14.6.878.[PubMed: 24265562].
[25] Tofts PS, Brix G, Buckley DL, Evelhoch JL, Henderson E, Knopp MV. Estimating kinetic parameters from dynamic contrast-enhanced T 1-weighted MRI of a diffusable tracer: standardized quantities and symbols. J Magn Reson Imaging. 1999; 10 (3): 223-32.
[26] Choyke PL, Dwyer AJ, Knopp MV. Functional tumor imaging with dynamic contrast-enhanced magnetic resonance imaging. J Magn Reson Imaging. 2003; 17: 509-520. [PubMed: 12720260] 3. NCI. CIP guidelines.
[27] Kierans AS, G. L. Bennett, M. HaghighiUtility of conventional and diffusion-weighted MRI features in distinguishing benign from malignant endometrial lesions Eur J Radiol, 83 (4) (2013), pp. 726-732.
[28] Fujii S, E. Matsusue, J. Kigawa, et al. Diagnostic accuracy of the apparent diffusion coefficient in differentiating benign
from malignant uterine endometrial cavity lesions initial results Eur Radiol, 18 (2) (2008), pp. 384-389.
[29] Elsammak A, Shehata SM, Abulezz M, Gouhar G: Efficiency of diffusion weighted magnetic resonance in differentiation between benign and malignant endometrial lesions. The Egyptian Journal of Radiology and Nuclear Medicine 48 (2017) 751-759.
[30] Beddy P, Moyle P, Kataoka M, Yamamoto AK, Joubert I, Lomas D, Crawford R, Sala E. evaluation of depth of myometrial invasion and overall staging in endometrial cancer: comparison of diffusion-weighted and dynamic contrast-enhanced MR imaging. Radiology. 2012 Feb; 262 (2): 530-7. doi: 10.1148/radiol.11110984. Epub 2011 Nov 23.
[31] Szafer A, Zhong J, Gore JC (1995) Theoretical model for water diffusion in tissues. Magn Reson Med 33: 697-712. [32] Liu KF, Li F, Tatlisumak T, Garcia JH, Sotak CH, Fisher M,
Fenstermacher JD (2001) Regional variations in the apparent diffusion coefficient and the intracellular distribution of water in rat brain during acute focal ischemia. Stroke 32: 1897-1905.
[33] Knight RA, Ordidge R, Helpern J, Chopp M, Rodolosi L, Peck D (1991) Temporal evolution of ischemic damage in rat brain measured by proton nuclear magnetic resonance imaging. Stroke 22: 802-808.
[34] Tamai K, Koyama T, Saga T, Morisawa N, Fujimoto K, Mikami Y, Togashi K (2008) The utility of diffusion-weighted MR imaging for differentiating uterine sarcomas from benign leiomyomas. Eur Radiol 18: 723-730.
[35] Maldjian JA, Listerud J, Moonis G, Siddiqi F (2001) Computing diffusion rates in T2-dark hematomas and areas of low T2 signal. AJNR Am J Neuroradiol 22: 112-118.
[36] Hiwatashi A, Kinoshita T, Moritani T, Wang HZ, Shrier DA, Numaguchi Y, Ekholm SE, Westesson PL (2003) Hypointensity on diffusion-weighted MRI of the brain related to T2 shortening and susceptibility effects. AJR Am J Roentgenol 181: 1705-1709.
[37] Shimada K, Ohashi I, Kasahara I, Watanabe H, Ohta S, Miyasaka N, Itoh E, Shibuya H (2004) Differentiation between completely hyalinized uterine leiomyomas and ordinary leiomyomas: three-phase dynamic magnetic resonance imaging (MRI) vs. diffusionweighted MRI with very small b-factors. J Magn Reson Imaging 20: 97-104. [38] Leppert PC, Baginski T, Prupas C, Catherino WH, Pletcher S,
Segars JH. Comparative ultrastructure of collagen fibrils in uterine leiomyomas and normal myometrium. Fertil Steril 2004; 82 Suppl 3: 1182-1187 [PMID: 15474093].
[39] Kim YS, Kim BG, Rhim H, Bae DS, Lee JW, Kim TJ, Choi CH, Lee YY, Lim HK.. Uterine fibroids: semiquantitative perfusion MR imaging parameters associated with the intraprocedural and immediate postprocedural treatment efficiencies of MR imaging-guided high-intensity focused ultrasound ablation. Radiology. 2014 Nov; 273 (2): 462-71. doi: 0.1148/radiol.14132719. Epub 2014 Jul 1.
[41] Oscar Tamburrini, Claudia Smiraglio, Nicoletta Caputo, Nadia Mastroianni, Giuseppe Guarascio, Di Cello Annalisa, Michele Morelli, Fulvio ZulloI. The contribution of Magnetic Resonance Imaging in the differential diagnosis between leiomyoma typical, atypical and uterine sarcomas: Personal experience. International Journal of Diagnostic Imaging, 2016, Vol. 3, No. 2.
[42] Solomon D, Breen N, McNeel T. Cervical cancer screening rates in the United States and the potential impact of implementation of screening guidelines. CA Cancer J Clin 2007; 57: 105-111.
[43] Kilickesmez O, Bayramoglu S, Inci E, Cimilli T, Kayhan A. Quantitative diffusion-weighted magnetic resonance imaging of normal and diseased uterine zones. Acta Radiol 2009; 50:
340-347 [PMID: 19235579 DOI:
10.1080/02841850902735858].
[44] Harry VN, Semple SI, Parkin DE, Gilbert FJ. Use of new imaging techniques to predict tumour response to therapy. Lancet Oncol. 2010; 11 (1): 92-102.