DENOISING & FEATURE
EXTRACTION OF EEG SIGNAL USING
WAVELET TRANSFORM
Sachin Garg 1, Rakesh Narvey 2
Deptt. .Of Electrical Engineering
Madhav Institute of Technology & Science, Gwalior (Madhya Pradesh) India [email protected], [email protected]
ABSTRACT: - Brain is one of the most complex organ of the humans, it controls the coordination of human muscles & nerves. EEG keeps its importance for identifying the physiological, and the psychological situations of the human and the functional activity of the brain. Being a non stationary signal, suitable analysis is essential for EEG to differentiate the normal EEG and epileptic seizures. Epilepsy is one of the most common neurological disorders. Epilepsy is a recurrent seizure disorder caused by abnormal electrical discharges from the brain cells, often in the cerebral cortex. Feature extraction of EEG signals is core issues on EEG based brain mapping analysis. This paper proposes classification system for epilepsy based on neural networks and wavelet based feature extraction technique has been adopted to extract features Min, Max, Mean and Median. These features have been applied to Neural Networks for classification. The results gave a classification accuracy of 97%.
Keywords – Electroencephalogram (EEG), Epilepsy, Feature Extraction, and Wavelet Transform, Artificial Neural Network (ANN).
1. INTRODUCTION
APPROXIMATELY 1% of the world’s population suffers from epilepsy. Epilepsy is one of the world’s most common neurological diseases. Although antiepileptic drugs have helped treat millions of patients, roughly a one third of all patients are unresponsive to pharmacological intervention. Analysis of brain signals that provides direct communication between the brain and a body can help patients who suffer from ill health and several psychic problems. [10]
The EEG signal is one of the most widely used signals in the bioinformatics area because of its rich information about human activity. The Electroencephalogram (EEG) has been an important clinical tool to assess human brain activity. [4] EEG monitoring has an important milestone provide valuable information of those candidates who suffer from epilepsy. [3]The EEG recording of patient suffering from epilepsy show two categories of abnormal activity: inter-ictal, abnormal signal recorded between epileptic seizures; and ictal the activity recorded during an epileptic seizure. In our study, EEG data sets are collected by a system. From the EEG datasets obtained Delta, Theta, and Alpha & Beta waves are extracted by using wavelet transform. After all, according to these waves an ANN trained, and developed to diagnose the epileptic and normal case.[4] [12]
2. MATERIALS & METHODS 2.1 EEG Signal
However, although some devices such as magnetic resonance (MR), brain tomography (BT) are used to diagnose the structural disorders of brain, for observing some special illnesses especially such as epilepsy. The electrical activity of active nerve cells in the brain produces currents spreading through the head. [4] These currents also reach the scalp surface, and resulting voltage differences on the scalp can be recorded as the electroencephalogram (EEG) by electrodes on or inside the brain with 10-20 electrode placement system. This 10 - 20 lead system provides information of how the brain functions over time. [6]Most commonly it is used to show the type and location of the activity in the brain during a seizure. It also is used to evaluate people who are having problems associated with brain function. These problems might include confusion, coma, and tumors, with long-term difficulties with thinking or memory, or weakening of specific parts of the body. EEG is a recording of the brain’s electrical activity, made from the scalp. There are five major brain waves distinguished by their different frequency ranges. These frequency bands are: delta (δ) (3Hz and below), theta(θ) (3.5Hz-7.5Hz), alpha(α) (7.5-13Hz), beta(β) (14Hz and greater) and Gamma (γ) (31 – 100 Hz) waveforms.[12]
2.2 10 – 20 System
and O stand for frontal, temporal, central, parietal and occipital respectivelyand number , odd no. lie in the left & even no. lie in the right side of the hemisphere.
Fig.1 10 – 20 Electrode Placement System
2.3 FREQUENCY BAND OF EEG SIGNAL
The brain waves recorded from the scalp have small amplitude of approximately 100μV. The frequencies of these brain waves range from 0.5 to 100 Hz, and their characteristics are highly dependent on the degree of activity of the cerebral cortex. Generally, in normal persons, the brain waves may be classified as belonging to one of four wave group.
1. Delta (δ) -The Delta waves which include all the waves in the EEG below 3.5 Hz. They occur in deep sleep, in childhood, and in serious organic brain disease.
2. Theta(θ) -The Theta waves have frequencies between 4 and 7 Hz. These occur mainly during the childhood, but they also occur during emotional stress in some adults.
3. Alpha (α) -The Alpha waves are rhythmic waves occurring at a frequency range between 8 and 13 Hz, which are found in all normal persons when they are awake in a quiet, resting state of cerebration. 4. Beta(β) - The Beta waves are very low amplitude, and high frequency range between 13 and 30 Hz.
They are affected by mental activity.[6]
Fig.2 Frequency Bands of EEG signal
2.4 EPILEPSY
Epilepsy is one of the common neurological disorders characterized by recurrent seizures. These seizures are seen as a sudden abnormal function of the body, often with loss of consciousness, an increase in muscular activity or an abnormal sensation. Epilepsy is characterized by recurrent seizure in which abnormal electrical activity in the brain causes altered perception or behavior. Patients experience varied symptoms during seizures depending on the location and extent of the affected brain area. [8]On the basis of the extent of the involved brain areas during the seizure, epilepsy can be divided into two main types. Generalized seizures involve almost the entire brain, while partial seizures originate from a circumscribed area of the brain and remain restricted to this area. Epileptic seizures may cause negative physical, psychological and social consequences, including loss of consciousness, injuries and sudden death. Until now, the specific cause of epilepsy in individuals is unknown and the mechanisms behind the seizure are little understood. Thus, efforts towards its diagnosis and treatment are of great importance. [4][7]
2.5 EXPERIMENTAL DATA
EEG signals were recorded with the same 128- channel amplifier system, After 12 bit analog-to-digital conversion, the data were written continuously onto the disk of a data acquisition computer system at a sampling rate of 173.61 Hz. Band-pass filter settings were 0.53–40 Hz ~12 dB/oct. . Exemplary EEGs are depicted in Fig. 3.[13]
Fig.3 Normal and Epileptic EEG Signal
2.6 WAVELET TRANSFORM
If a signal does not change much over time, we would call it as a stationary signal. Fourier transform could be applied to the stationary signals easily and good result can be taken. However, like EEG, a plenty of signals contain non stationary or transitory characteristics, and Fourier Transform is not suited properly to detect the non-stationary signals. [11] The basic idea underlying wavelet analysis consists of expressing a signal as a linear combination of a particular set of functions (wavelet transform, WT), obtained by shifting and dilating one single function called a mother wavelet.[1] The decomposition of the signal leads to a set of coefficients called wavelet coefficients. Therefore the signal can be reconstructed as a linear combination of the wavelet functions weighted by the wavelet coefficients. In this paper 6 level decomposition is done with daubechies6 wavelet function. Outcome of decomposition is various frequency bands i.e. alpha (9-13 Hz), delta (1-3 Hz), theta (4-8 Hz), beta (14-30 Hz) using DWT. Thus, the EEG signals were decomposed into details D1–D6 and one final Approximation, A6. [4]
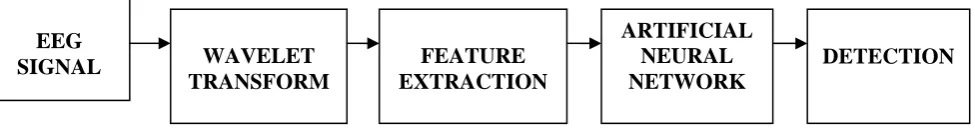
2.7 METHODOLOGY
Fig. 4 Block Diagram of Methodology
In this study, first EEG waveforms have been used in Ref.13 . One of the EEG waveform as shown above. Then, the wavelet transforms of the EEG waveforms are taken by using daubechies wavelets. The decomposition of the signal leads to a set of coefficients called wavelet coefficients. Therefore the signal can be reconstructed as a linear combination of the wavelet functions weighted by the wavelet coefficients. In this paper 6 level decomposition is done. Therefore, (1-3 Hz), (4-8 Hz), (9-13 Hz), and (14-30 Hz) wavelets of the original EEG waveform are obtained. The , , , and waves are viewed in the Fig.4. Since the EEG signals do not have any useful frequency components above 30 Hz, Thus, the EEG signals were decomposed into details D1–D6 and one final Approximation, A6. An approximate coefficient of 6th level decomposition is a signal with frequency range 1 to 3 Hz. Approximation coefficients of 6th level are reconstructed and a signal is obtained. Since the epilepsy can also be found within the frequency range of 1-3Hz, delta wave alone is extracted. Then features are extracted as mean, max, min and entropy for the delta signal. Back propagation network is a multi-layer feed forward networks. It is an artificial neural network between the input and an output layer, of which more than one layer is used. An artificial neural network for classification provides distinguishable result of the EEG data set. [1][11]
2.8 FEATURE EXTRACTION
Transforming the input data into the set of features is called feature extraction. If the features extracted are carefully chosen it is expected that the features set will extract the relevant information from the input data in order to perform the desired task. [2]Mean, Max, Min and Median are extracted as features for the filtered delta signal. These are extracted to help in distinguishing between normal and epileptic signal. [4]
DETECTION WAVELET
TRANSFORM
ARTIFICIAL NEURAL NETWORK FEATURE
EXTRACTION EEG
3. RESULT
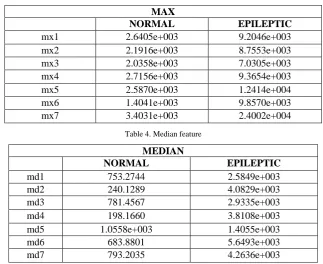
The reconstructed EEG signal with 6 level decomposition in Fig. 4. . Delta, Theta, Alpha & Beta are frequency band of EEG. Features Mean, Min, Max & Median of normal and epileptic signal with comparison is tabulated Table1, Table 2, Table 3, and Table 4 respectively. These features have been applied to ANN for classification & accuracy of 97%.
Fig. 4 Reconstructed Signal of EEG
Table1. Mean feature
MEAN
NORMAL EPILEPTIC
Mn1 602.1942 3.4569e+003
Mn2 560.1703 3.9712e+003
Mn3 451.6351 1.8903e+003
Mn4 213.1952 3.2027e+003
Mn5 976.8099 2.2585e003
Mn6 58.3252 3.2759e+003
Mn7 806.6357 4.4190e+003
Table 2. Min feature
MIN
NORMAL EPILEPTIC
min1 -1.7497e+003 -1.4790e+003
min2 -493.9424 -1.1512e+003
min3 -1.7281e+003 -6.8042e+003
min4 -1.9671e+003 -7.8333e+003
min5 -1.0224e+003 -6.9271e+003
min6 -3.4342e+003 -8.8738e+003
Table 3. Max feature
MAX
NORMAL EPILEPTIC
mx1 2.6405e+003 9.2046e+003
mx2 2.1916e+003 8.7553e+003
mx3 2.0358e+003 7.0305e+003
mx4 2.7156e+003 9.3654e+003
mx5 2.5870e+003 1.2414e+004
mx6 1.4041e+003 9.8570e+003
mx7 3.4031e+003 2.4002e+004
Table 4. Median feature
MEDIAN
NORMAL EPILEPTIC
md1 753.2744 2.5849e+003
md2 240.1289 4.0829e+003
md3 781.4567 2.9335e+003
md4 198.1660 3.8108e+003
md5 1.0558e+003 1.4055e+003
md6 683.8801 5.6493e+003
md7 793.2035 4.2636e+003
4. CONCLUSION
This paper proposes a technique of detecting epilepsy disorder using discrete wavelet transform using MATLAB. The contribution presents the use of wavelet transform for a given signal. EEG data were used as input to the wavelet transform offers a perfect success in the rejecting undesired frequencies and permits the DWT levels to discriminate the EEG waves only. Once the delta wave is identified and measured, the features like Mean, Max, Min and median was calculated and then ANN is used for the classification. This method offers more efficiency, which it can be easily distinguished between normal and epileptic.
5. REFERENCES
[1] Shaik.Jakeer Husain 1 and K.Srinivasa.Rao 2 (2012)-- Epileptic Seizures Classification from EEG Signals using Neural Networks International Conference on Information and Network Technology, IPCSIT vol. 37 Singapore
[2] Nandish.M, Stafford Michahial, Hemanth Kumar P, Faizan Ahmed—2008, Feature Extraction and Classification of EEG Signal Using Neural Network Based Techniques, International Journal of Engineering and Innovative Technology (IJEIT) Volume 2, Issue 4 [3] Alexandros T. Tzallas, 2007-- The Use of Time-Frequency Distributions for Epileptic SeizureDetection in EEG Recordings, IEEE
EMBS Lyon, France
[4] Suhanya.S 1, Manimegalai.P2 -- (March-2012), DETECTION OF EPILEPSY DISORDER IN EEG SIGNAL, International Journal of Emerging trends in Engineering and Development Issue 2, Vol.2
[5] Aleˇs Proch´azka, Martina Mudrov´a, Oldˇrich Vyˇsata, Robert H´ava, and Carmen Paz Su´arez Araujo, Multi-Channel EEG Signal Segmentationand Feature Extraction
[6] Maan M. Shaker, 2005 EEG Waves Classifier using Wavelet Transform and Fourier Transform, International Journal of Biological and Life Sciences 1:2
[7] K.P. Indiradevi, Elizabeth Elias, P.S . Sathidevi—2007, Automatic detection of epileptic spikes in the long term electroencephalogram using wavelet transform, International Conference on Computational Intelligence and Multimedia Applications
[8] Thasneem Fathima, Yusuf U Khan, M. Bedeeuzzaman, Omar Farooq 2011-- Discriminant Analysis for Epileptic Seizure Detection IEEE
[9] Aleˇs Proch´azka and Jarom´ır Kukal, Oldˇrich Vyˇsata-- Wavelet Transform Use for Feature Extraction and EEG Signal Segments Classification
[10] Alexandros T. Tzallas -- SEPTEMBER 2009 Epileptic Seizure Detection in EEGs Using Time–Frequency Analysis IEEE TRANSACTIONS ON INFORMATION TECHNOLOGY IN BIOMEDICINE, VOL. 13, NO. 5,
[11] M.Akin1, M.A.Arserim1, M.K.Kiymik2, I.Turkoglu3, Oct.25-28, 2001,-- A NEW APPROACH FOR DIAGNOSING EPILEPSY BY USING WAVELET TRANSFORM AND NEURAL NETWORKS 23rd Annual Conference – IEEE/EMBS
[12] Alexandros T. Tzallas, Markos G. Tsipouras, Dimitrios G. Tsalikakis, Evaggelos C. Karvounis, Loukas Astrakas, Spiros Konitsiotis and Margaret Tzaphlidou-- Automated Epileptic Seizure DetectionMethods: A Review Study