e-ISSN: 2278-7461, p-ISSN: 2319-6491
Volume 7, Issue 5 [May 2018] PP: 31-45
BIND Battery: Novel Hybrid Battery That Utilizes Mutual
Autonomous Control between Lithium-Ion Battery and
Lead-Acid Battery
Tomohiko Matoba, Naoyoshi Kachi, Kazunari Kobayashi, And Hisashi
Tsukamoto
CONNEXX SYSTEMS Corporation,
Keihanna Open Innovation Center (KICK), 7-5-1, Seikadai, Seika-cho, Soraku-gun, Kyoto 619-0294, Japan Corresponding Author: Tomohiko Matoba
Abstract:
BIND Battery is a novel hybrid battery technology where lithium-ion battery (LiB) and lead-acid battery (PbB) are connected in parallel without DC/DC converter. Most of battery performance during normal use are provided by LiB whereas PbB compensates the intrinsic shortcomings of LiB. During the discharge of BIND Battery, the current distribution between LiB and PbB sub-modules are automatically balanced. In BIND Battery, most of discharge capacity during normal use is provided by LiB and PbB reserves more than half of its capacity as extra energy, resulting in the extension of PbB cycle life. When BIND Battery discharges with relatively high C-rate, LiB takes the majority of total discharge current and reduces the C-rate of PbB. This results in the increase of discharge capacity of PbB. If BIND Battery is overcharged, PbB consumes overcharge energy through its gas recombination reaction and LiB can leave from the overcharge voltage. At extremely low temperature, LiB voltage tend to nose-dive at the beginning of discharge. However, in BIND Battery, PbB supports voltage for a while until LiB voltage recovers by warming up by self-generated heat. PbB also suppresses the degradation of LiB during high-temperature exposure by expelling excess energy and reducing state of charge of LiB. Thus, BIND Battery can withstand harsh environment and provide advanced safety compared to conventional LiB only energy storage system.Keywords:
hybrid battery; lead-acid battery; lithium-ion battery; reliability; safety--- --- Date of Submission: 12-05-2018 Date of acceptance: 28-05-2018 --- ---
I INTRODUCTION
In recent years, the introduction of renewable energy such as solar and wind power has been promoted [1-3]. Since renewable energy is a fluctuating power source which is easily influenced by the amount of solar radiation and wind volume, there is a concern that the frequency and voltage of grid becomes unstable [4]. As a countermeasure, the introduction of batteries has been studied to adjust supply and demand of electric power [5, 6]. CONNEXX SYSTEMS Corporation has developed BIND Battery. It is a unique, safe and highly reliable battery. It is a hybrid battery technology where lithium-ion batteries (LiB) and lead-acid batteries (PbB) are connected in parallel to form a virtual cell (a module). In this battery, LiB provides long cycle life and high rate performance, while PbB contributes to compensate the intrinsic shortcomings of LiB such as overcharge tolerance, low-temperature capability and degradation during the high temperature storage.
During the discharge of BIND Battery, the current distribution between LiB and PbB sub-modules are automatically balanced. In BIND Battery, most of discharge capacity during normal use is provided by LiB and PbB reserves more than half of its capacity as extra energy, resulting in the extension of PbB cycle life.
When BIND Battery discharges with relatively high C-rate such as 1C, LiB takes the majority of total discharge current and reduces the C-rate of PbB. This results in the increase of discharge capacity of PbB. The rate performance of BIND Battery is close to that of single LiB instead of the middle of the rate performance between single LiB and PbB. This can improve the cruising distance of conventional PbB only micro electric vehicle (EV) by replacing part of PbB with LiB and forming BIND Battery.
BIND Battery shows a unique discharge mechanism at extremely low temperatures where LiB and PbB combine their individual discharge performances for an improved overall battery performance [8]. At the beginning of discharge, the discharge current from PbB is dominant. However, during middle and late periods of discharge, current from LiB gradually increases. This is because the discharge of LiB is an exothermal reaction, which results in the temperature increase of LiB during discharge. As a result, the discharge capability of BIND Battery at low temperature such as -25ºC is better than that of single LiB and PbB.
When BIND Battery is exposed to high temperatures such as 80ºC, the state of charge (SOC) of LiB in BIND Battery becomes lower in a short period of time by the previously mentioned energy transfer from LiB to PbB. This suppresses the degradation of LiB during high temperature storage [9].
Thus, BIND Battery can be used safely and reliably even in much harsher environments compared to conventional LiB only energy storage systems (ESS). BIND Battery can be considered as a suitable battery for outdoor-type ESS applications such as renewable energy storage [10, 11].
In this study, we report experimental data on the representative characteristics of BIND Battery: (1) charge and discharge cycle performance, (2) discharge rate performance, (3) overcharge tolerance, (4) low-temperature discharge capability, and (5) high-low-temperature storage performance.
II EXPERIMENTS
2-1. Charge and Discharge Cycle Test
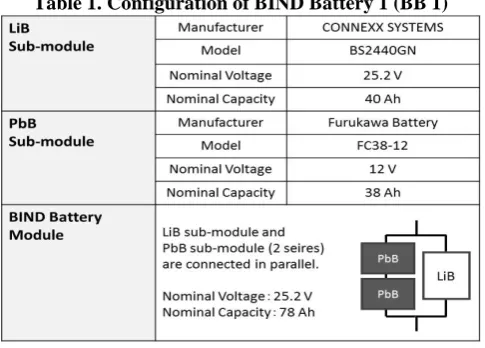
As shown in Table 1, BIND Battery Module 1 (BB 1) comprises of one LiB sub-module (CONNEXX SYSTEMS, BS2440GN, nominal voltage: 25.2 V, nominal capacity: 40 Ah) and 2 series of PbB sub-modules (Furukawa Battery FC38-12, nominal voltage: 12 V, nominal capacity: 38 Ah) connected in parallel. For this study, battery management system (BMS) of LiB was removed to eliminate the effect of electricity consumption by the BMS.
Table 1. Configuration of BIND Battery 1 (BB 1)
The cycle test has been conducted at room temperature (the cycle test is still running at the time of the manuscript submission). The test condition is as follows; (1) BB 1 is charged to SOC 100% with constant-current and constant-voltage (CC-CV) mode (28.8 V and 0.2C, cutoff constant-current: 0.01C), (2) Rest period for 10 minutes, (3) BB 1 is then discharged to the cutoff voltage of 24.0 V with 0.2C constant-current (CC) discharge mode, (4) Rest period for 10 minutes. Then, these four steps are repeated. In this study, the C-rate is based on the nominal capacity of BB 1 (78 Ah). During the cycle test, the electric current of both LiB and PbB is measured with a shunt resistance (Hioki HS-1-50) and the current distribution between these batteries is investigated.
2-2. Discharge Rate Test
The discharge rate test of BB 1 was conducted at room temperature. BB 1 was charged to SOC 100% with CC-CV mode (28.8 V and 0.2C, cutoff current: 0.01C). BB 1 was then discharged to the cutoff voltage of 21.0 V with 0.2, 0.5 and 1C CC discharge mode, respectively. For comparison, the same discharge rate test was conducted for single LiB and PbB.
Battery 12m24B, nominal voltage: 12 V, nominal capacity: 24 Ah) connected in parallel. Therefore, the total nominal capacity of BB 2 was 64 Ah.
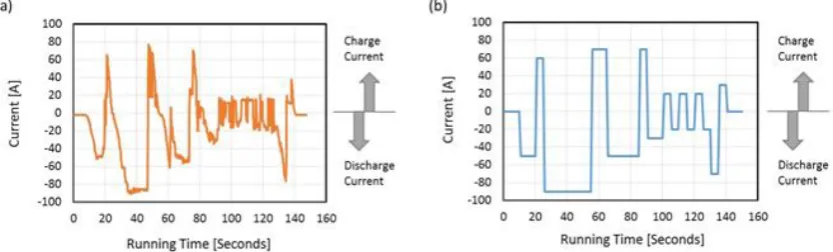
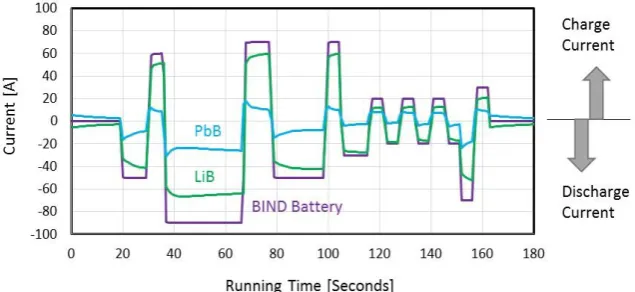
The cycle test had been conducted in a thermostatic chamber (Espec LU-114) with temperature setting of 25ºC. BB 2 was charged with 4 steps of CC mode; (1) CC 9.0 A to 28.5 V, (2) CC 6.0 A to 28.5 V, (3) CC 3.0 A to 28.65 V, and then (4) CC 1.5 A to 28.88 V. BB 2 was placed for 1 hour after the charging was completed. The cycle test (the current profile is shown in Figure 1), which was based on the actual load pattern of the micro EV (Toyota Auto Body, COMS) when the authors drove it in their facility, was repeated until the voltage of BB 2 reached to 22.4 V. The charge current shown in Figure 1 indicates the regenerative electricity when the micro EV deaccelerates. BB 2 was placed for 1 hour after the cycle test was finished. Then, BB 2 was charged with the above-mentioned charging steps and the cycle test was repeated.
Figure 1. (a) Current profile of the micro EV when the authors drove it in their facility, (b) current profile of the cycle test of the micro EV running pattern which is based on the actual load pattern shown in Figure 1 (a). The
charge current indicates the regenerative electricity when the micro EV deaccelerates.
One running pattern shown in Figure 1 corresponds to the cruise distance of 800 meters. From the completion number of the running cycle, the cruise distance per charge and the total cruise distance during the lifetime of BB 2 were calculated.
For comparison, the same cycle test was conducted with single 12 V PbB (Panasonic EC-FV1260, nominal voltage: 12 V, nominal capacity: 60 Ah).
2-3. Overcharge Tolerance Test
The overcharge and heating test was conducted at room temperature with both BB 1 (the same battery configuration as described in Table 1) and a single LiB sub-module. The BMS of the LiBs used in this study was also removed to intentionally place LiB in an overcharged state. The batteries at SOC 50% were charged with 0.2C CC charge mode until the battery voltage reached to 33.0 V (SOC 130% overcharge for LiB). After the completion of overcharging, the batteries were placed in a rest period of 17 hours and their OCV variation was measured. Then, the batteries were heated for 9 hours by blowing hot air (100ºC) at them. The battery OCV and the electric current between LiB and PbB sub-modules of BB 1 were measured during the heating.
2-4. Low-Temperature Discharge Test
Discharge test at low temperatures was conducted with BB 1 (the same battery configuration as described in Table 1), a single LiB and PbB sub-modules.
BB 1 was placed in a thermostatic chamber (Espec LU-114) with temperature setting of 25ºC. Following this, BB 1 was charged to SOC 100% with CC-CV mode (28.8 V and 0.2C, cutoff current: 0.01C). BB 1 was then discharged to the cutoff voltage of 21.0 V with 0.5C CC discharge mode and the discharge capacity was measured. Test was repeated at different temperatures (i.e. -30, -25, -10, 0, 10, and 25ºC, respectively). Each time, the charging was carried out at 25ºC. After the full charge, battery was placed in the thermostatic chamber with testing temperature setting with a rest period of 12 hours before initiating discharge.
2-5. High-Temperature Storage Test
LiB sub-module used in this test was BS2440GN without BMS. As PbB sub-module, FB9000 70B24L manufactured by Furukawa Battery (nominal voltage: 12 V, nominal capacity: 44 Ah) was used instead of FC38-12. BIND Battery composed of these sub-modules is hereinafter described as BIND Battery Module 3 (BB 3).
the storage, the OCV and internal resistance (IR) of both LiB and PbB sub-modules of BB 3 were measured with AC 1 kHz four-terminal method (Hioki BT3562 battery hitester). In this test, the test end conditions were determined as (1) when the IR of LiB increased from the initial value of 22 mΩ to more than 30 mΩ, or (2) when the OCV of PbB reached to less than 10.5 V. For comparison, the same test was conducted with single LiB and PbB sub-modules.
After BB 3 reached to the test end condition, its LiB sub-module was disassembled to cells and the presence or absence of the current interrupt device (CID) operation of each cell was investigated. One of the cells in which the CID was operated was disassembled and the amount of the gas inside the cell, which was generated during storage, was measured. For comparison, the gas from an unused cell that had not been subjected to high-temperature storage was also measured. For the cell with CID not operated, the discharge capacity was measured at 25ºC according to the following procedure; (1) CC-CV charge (4.2 V and 0.5C, cutoff current: 0.05C) and (2) CC discharge (0.5C, cutoff voltage: 2.75 V). Same discharge capacity measurement was carried out with an unused cell and degradation rate of discharge capacity accompanying the high-temperature storage was quantitatively evaluated. The same evaluation was carried out with the single LiB sub-module that had been subject to high-temperature storage test.
As for the PbB sub-module of BB 3, the discharge capacity measurement was carried out at 25ºC with the following procedure; (1) CC-CV charge (14.4 V and 0.2C, cutoff current: 0.02C) and (2) CC discharge (0.2C, cutoff voltage: 10.5 V). The same discharge capacity measurement was also carried out with an unused PbB, and the degradation rate of the discharge capacity was evaluated. The same evaluation was carried out with the single PbB sub-module that had been subject to high-temperature storage test.
III RESULTS AND DISCUSSION 3-1. Charge and Discharge Cycle Test
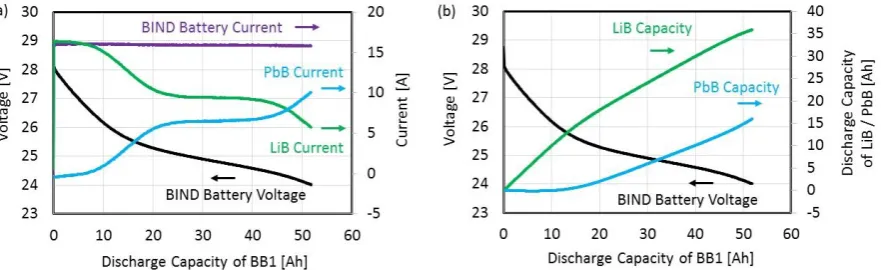
Figure 2 (a) shows the discharge curve of BB 1 and the current distribution between LiB and PbB at the 1st cycle.
Figure 2. (a) Discharge curve of BIND Battery 1 (BB 1) and the current distribution between LiB and PbB sub-modules of BB 1 at the 1st cycle, (b) Discharge curve of BB 1 and the accumulated discharge capacity of LiB
and PbB sub-modules of BB 1 at the 1st cycle
At the initial stage of discharge of BB 1, the LiB sub-module discharges almost 100% of the current of BB 1. The discharge current ratio of PbB gradually increases as the value of discharge capacity of BB 1 becomes larger. Note that the current distribution between LiB and PbB is automatically balanced between these two batteries depending on the discharge voltage and internal resistance of them. This discharge mechanism is deferent from conventional hybrid batteries in which the current from different batteries are controlled by electric circuits such as DC/DC converters [12, 13].
Figure 3 shows the discharge capacity variation of BB 1 and LiB and PbB sub-module of BB 1. The discharge capacity of BB 1 at the 2711th cycle is 32.1 Ah. The discharge capacity retention of BB 1 at the 2711th cycle compared to the 1st cycle is 62.0%.
Figure 3. Discharge capacity variation of BB 1 and LiB and PbB sub-module of BB 1
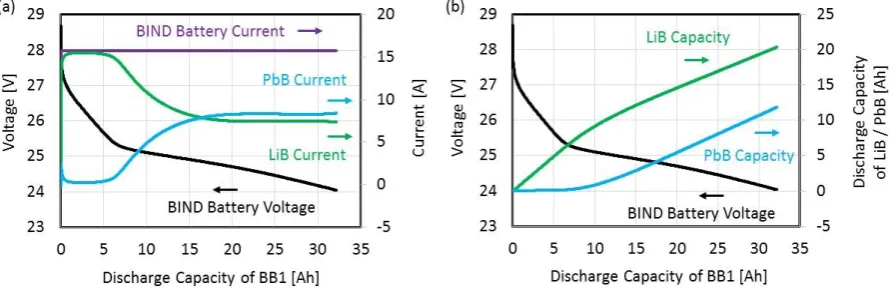
Figure 4 is the discharge curve of BB 1 and the current distribution between LiB and PbB sub-modules of BB 1 at the 2711th cycle. Even after BB 1 is degraded by the cycle use, the current distribution maintains the same tendency as the 1st cycle. This means that the autonomous control of the sub-modules can be maintained throughout the cycle life of BIND Battery.
Figure 4. (a) Discharge curve of BIND Battery 1 (BB 1) and the current distribution between LiB and PbB sub-modules of BB 1 at the 2711th cycle, (b) Discharge curve of BB 1 and the accumulated discharge capacity of
LiB and PbB sub-modules of BB 1 at the 2711th cycle
3-2. Discharge Rate Test
The results of the discharge rate performance of BB 1 and single LiB and PbB are summarized in Figure 5. The vertical axis of Figure 5 is the ratio to the discharge capacity at 0.2C discharge. At 1C discharge, the discharge capacity ratio of BB 1, single LiB and PbB are 90.1, 97.2 and 72.8%. Even though about half of the nominal capacity of BB 1 consists of PbB, the 1C rate performance of BB 1 is close to that of single LiB instead of the average of single LiB and PbB.
Figure 6 shows the discharge current distribution between LiB and PbB sub-modules of BB 1 at 1C discharge. From the initial to middle of the discharge stages, the discharge current from PbB gradually increases from 8 (0.21C) to 34 A (0.89C). The PbB discharge current maintains about 34 A during the rest period of the discharge. Therefore, the C-rate of PbB sub-module is less than 1C during the 1C discharge of BB 1, and this results in the increase of discharge capacity of PbB sub-module. Thus, the rate performance of BIND Battery is close to that of single LiB instead of the middle of the rate performance between single LiB and PbB.
Figure 6. Discharge current distribution between LiB and PbB sub-modules of BIND Battery 1 at 1C discharge
From this study, the rate performance of PbB only battery system can be improved by simply replacing part of PbB with LiB and forming BIND Battery. This benefit, for example, can extend the cruising distance of PbB only micro EV. In order to demonstrate this benefit, the charge and discharge cycle test based on the micro EV load pattern was conducted with BB 2 and single PbB.
Figure 7 shows the voltage profile of BB 2 and single PbB during the cycle test of micro EV running pattern. The running time per charge of BB 2 is 2.03 hours until the voltage reaches to the test end condition of 22.4 V. This is 1.27 times longer than the running time of single PbB (1.6 hours) although the nominal capacity of BB 2 (64 Ah) is 1.06 times larger than that of single PbB (60 Ah). Therefore, BIND Battery can extend the cruising time of micro EV.
Figure 7. Voltage profile of BIND Battery 2 and single PbB during the cycle test of micro EV running pattern
The extension of the cruising time by BIND Battery is due to the rate performance of LiB, which can reduce the C-rate of PbB as shown in Figure 6. The difference of the average discharge voltage between BB 2 and single PbB, which is shown in Figure 7, is also one of the reasons why the cruising time of BB 2 before reaching to the test end condition is longer than that of single PbB.
the other hand, at the same discharge condition of 90 A, single PbB (the nominal capacity: 60 Ah) discharges with 1.5C. Thus, in BIND Battery, LiB can reduce the C-rate of PbB. This results in the extension of the micro EV cruising time compared to conventional PbB only micro EV.
Figure 8. Part of the current profile of BIND Battery 2 during the cycle test of micro EV running pattern
Figure 9 shows the variation of the accumulated cruising distance and the cruising distance per charge for BB 2 and single PbB. The distance were calculated based on the completion number of the micro EV running cycle.
Figure 9. Variation of the accumulated cruising distance and the cruising distance per charge for BB 2 and single PbB
The initial cruising distance per charge of single PbB is 26.5 km. If the test end condition is considered that the cruising distance decreases to 70% of the initial cruising distance per charge of single PbB (26.5 km x 70% = 18.55 km), the accumulated cruising distance of BB 2 and single PbB during the lifetime of the battery are 4,400 and 2,200 km, respectively. Therefore, due to the high rate performance of LiB, BIND Battery can extend not only the cruising distance per charge but also the total cruising distance compared to PbB only micro EV.
3-3. Overcharge Tolerance Test
Figure 10. (a) OCV variation of BIND Battery 1 (BB 1) and single LiB during the rest period of 17 hours after overcharging, (b) electric current between LiB and PbB sub-modules of BB 1 along with the OCV variation of
BB 1 during the rest period
The appearance of BB 1 and single LiB after heating with hot air is shown in Figure 11. The appearance of BB 1 does not change after the heating test whereas single LiB is engulfed in flames 4 hours and 40 minutes after hot air blow is started.
Figure 11. Appearance of BIND Battery 1 and single LiB after heating with hot air
The detailed steps when single LiB starts burning are shown in Figure 12. Smoke is generated from single LiB 4 hours and 40 minutes after the start of hot air blow [Figure 12 (b)] and single LiB fires up immediately after smoke generation [Figure 12 (c)]. Single LiB continues to burn for about 6 minutes [Figure 12 (d)]. From the above results, it is experimentally confirmed that BB 1 possesses excellent safety against overcharge compared to single LiB.
Figure 12. Detailed steps when single LiB starts burning
(b) smoke is generated from single LiB 4 hours and 40 minutes after the start of hot air blow, (c) single LiB fires up immediately after smoke generation,
(d) single LiB continues to burn for about 6 minutes
Figure 13 shows the variation of OCV of BB 1, temperature of PbB sub-module and current between LiB and PbB sub-modules during the heating. As previously mentioned, in BB 1, overcharged energy of LiB is transferred to PbB during the rest period of 17 hours. This energy transfer is reinforced by hot air blow because the gas recombination reaction of PbB is more activated as its temperature increases. As shown in Figure 13, current from LiB to PbB increases as PbB temperature increases, and it reaches to a maximum of 1.5 A after 4 hours from the start of heating. The OCV of BB 1 reaches to 29.4 V (4.2 V per LiB cell) after 3 hours from the start of hot air blow. This means that LiB of BB 1 leaves from the overcharged state because the maximum charging voltage of LiB sub-module used in this study is 4.2 V per cell.
Figure 13. Variation of OCV of BIND Battery 1, temperature of PbB sub-module and current between LiB and PbB sub-modules during the heating. The positive and negative value of the current indicate charge and
discharge, respectively.
In order to quantitatively clarify the temperature dependence of the current between LiB and PbB sub-modules, another BB 1 (different battery from the one used in this overcharge and heating test) is charged to SOC 100% and the current from LiB to PbB is measured while BB 1 is stored at various temperatures. The result is summarized in Figure 14. It is confirmed that the electric current from LiB to PbB exponentially increases with an increase of PbB temperature. Thus, the safety of BIND Battery in the overcharged state is maintained even at high temperatures due to the gas recombination reaction of PbB sub-module.
While BB 1 exhibits excellent safety throughout the overcharge and heating test, single LiB burns during the hot air blow. For single LiB sub-module, the overcharged energy cannot be released or passed on. It is considered that some exothermic side reactions related to overcharge such as decomposition of the electrolyte [17] and metallic lithium precipitation at the negative electrode [18] occur within the LiB cells. Since the reaction rate of these side reactions rises exponentially as battery temperature rises, the side reactions inside the overcharged LiB are more activated during the hot air heating and results in more rise of the battery temperature. Then, the side reactions are further activated and such positive feedback eventually results in thermal runaway state of LiB as shown in Figure 12 [19, 20].
On the other hand, smoking and fire does not occur in LiB of BIND Battery, and there is no remarkable change in appearance. Because the overcharged LiB of BIND Battery can release its excess energy to PbB, the side reactions related to overcharge are suppressed. Thus, it can be concluded that BIND Battery possesses an intrinsic safety against overcharge compared to single LiB. In general, BMS protects LiB from being in abnormal status including overcharge [21]. However, LiB will fall in overcharged status if BMS fails to operate correctly. On the other hand, BIND Battery possesses intrinsic overcharge tolerance and LiB can automatically leave from the overcharged status even in the case that BMS fails to protect the battery.
3-4. Low-Temperature Discharge Test
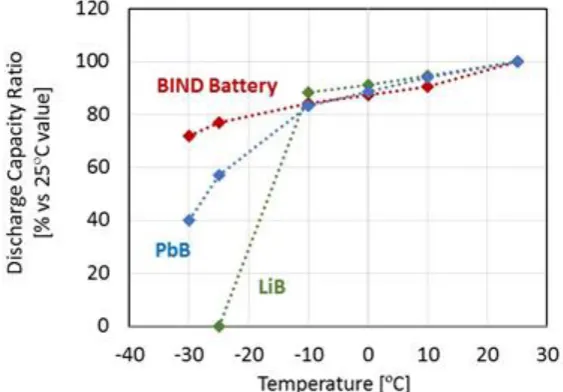
The temperature dependence of 0.5C discharge capacity of BB 1, single LiB and PbB sub-modules is summarized in Figure 15. The vertical axis of Figure 15 is the ratio to the discharge capacity at 25ºC.
Figure 15. Temperature dependence of 0.5C discharge capacity of BIND Battery 1, single LiB and PbB sub-modules
In the test temperature range of -10 to 25ºC, there is no significant difference in the discharge capacity ratio among three types of batteries. Below -10ºC, however, BB 1 shows low-temperature discharge capability not only better than single LiB sub-module but also better than single PbB sub-module.
Single LiB is not able to discharge at -25ºC because the voltage falls below the cutoff voltage (21.0 V) immediately after the discharge starts. Although single PbB is able to discharge up to -30ºC, the discharge capacity ratio drops to less than 60% at -25ºC or lower. Compared to these single sub-modules, the discharge capacity ratio of BB 1 maintains 77% at -25ºC and 72% at -30ºC, respectively.
Figure 16. 0.5C discharge curves of BIND Battery 1 at the test temperature of (a) 25 and (b) -25ºC.
At the initial stage of discharge of BB 1 at 25ºC, the LiB sub-module discharges almost 100% of the current of BB 1. The discharge current ratio of PbB gradually increases as the DOD of BB 1 becomes deeper. On the other hand, in the discharge of BB 1 at -25ºC, the current ratio of the sub-modules at the initial stage of discharge is reversed and PbB dominantly discharges. The discharge current ratio of LiB at the initial stage is about 30% and gradually increases as the DOD of BB 1 becomes deeper. The discharge voltage of BB 1 also recovers along with the increase of the current ratio of LiB. Since the discharge of LiB is an exothermic process [22], LiB temperature of BB 1 increases by the heat generation accompanying the discharge. This heat generation also increases the LiB current ratio which results in the further temperature increase of LiB. During the discharge at -25ºC, the LiB temperature continues to increase and reaches to about 5ºC at the end of the discharge (not shown).
In the low-temperature discharge of BIND Battery, PbB dominantly bears the discharge current at the initial stage of discharge when LiB is unable to discharge at a relatively high C-rate. However, in the middle or later stage of discharge, LiB shares the main part of the discharge current as its temperature sufficiently increases by the heat generation of the discharge. Thus, it can be concluded that BIND Battery possesses a unique discharge mechanism where two different types of batteries complement each other and exhibit an excellent low-temperature capability compared to single LiB and PbB. When ESS is used in a low temperature below -20ºC, LiB with low-temperature capability or heating system is required [23]. In BIND Battery, even conventional LiB, which does not possesses low-temperature capability, can discharge the current of relatively high C-rate without external heating system. Therefore, BIND Battery can extend the discharge temperature range of conventional LiB by simply connecting it with PbB in parallel.
3-5. High-Temperature Storage Test
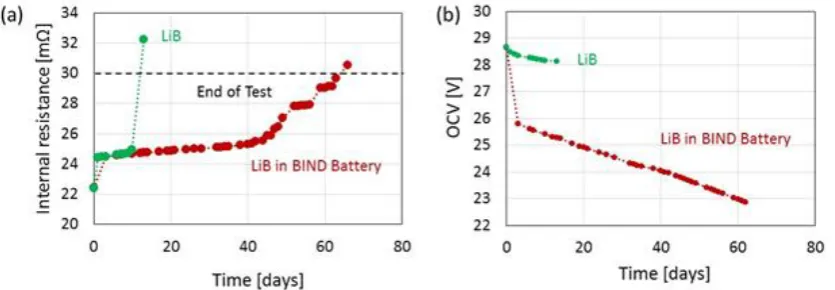
Figure 17 shows the variation of IR and OCV of single LiB and LiB of BB 3 during the 80ºC storage.
Figure 17. Variation of (a) IR and (b) OCV of single LiB and LiB of BIND Battery 3 during the 80ºC storage
end condition on the 66th day. Therefore, it is revealed that LiB of BB 3 lasts about 5 times longer than that of single LiB before reaching to the same test end condition. With respect to the OCV variation during the storage period, single LiB remains at the OCV of 28.0 V or more, whereas the OCV of LiB of BB 3 rapidly decreases. Both single LiB and LiB of BB 3 after the storage were disassembled up to cells and the presence or absence of CID operation of each cell was investigated. The CID was operated in 23.2% of the cells of single LiB. On the other hand, in LiB of BB 3, the proportion of the cells in which the CID operated was 16.9%. Therefore, it can be inferred that the IR increase of these two LiB during the storage is due to the CID operation. One of the cells from LiB of BB 3 in which the CID was operated was disassembled and the amount of gas generated inside the cell was measured. For comparison, the amount of gas from an unused cell was also measured. The generated gas volume from the former and the latter were about 2 ml and 1 ml, respectively. Therefore, it is confirmed that the CID operation during the storage is caused by the increase of internal pressure due to gas generation. This gas generation is due to a side reaction such as decomposition of electrolyte [17].
One of the cells in which CID was not operated was selected from each LiB sub-module and their discharge capacity was measured at 25ºC. The discharge capacity measurement was also carried out with an unused cell. The discharge capacity of three cells were compared and the degradation of the discharge capacity caused by the high-temperature storage was evaluated. It is found that the discharge capacity degradation of the cell from single LiB was 3.5%, whereas that of the cell from LiB of BB 3 was almost 0%. Therefore, in terms of both the CID operation rate and the discharge capacity degradation, the degradation of LiB of BB 3 was suppressed compared to single LiB even though the former had been subjected to more than 5 times longer storage at 80ºC than the latter.
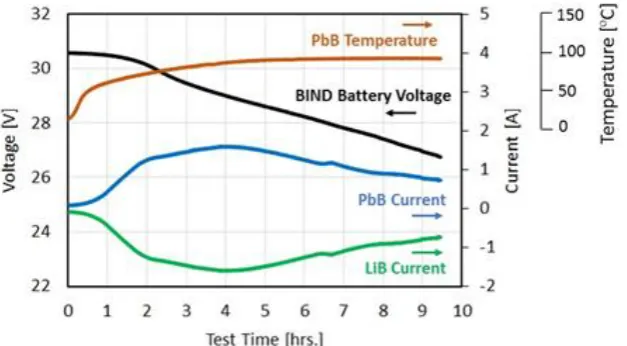
The advantage of BIND Battery in terms of high-temperature storage compared to single LiB is considered as follows. As shown in Figure 17 (b), single LiB remains at the OCV of 28.0 V or more, whereas the OCV of LiB of BB 3 rapidly decreases. Figure 18 shows the OCV variation of BB 3 and the current value of LiB and PbB at the beginning of the 80ºC storage.
Figure 18. OCV variation of BIND Battery 3 and the current value of LiB and PbB at the beginning of the 80ºC storage. The positive and negative current value indicate charging and discharging current,
respectively.
Figure 19. SOC dependence of the IR increase rate of LiB during 80ºC storage
The IR increase rate of LiB during 80ºC storage shows a strong dependence on the SOC. The lower the SOC of LiB is, the higher the IR increase suppression becomes.
From the above results, it can be inferred that when BIND Battery is exposed to high temperature, high temperature storage degradation of LiB can be suppressed by lowering the SOC of LiB due to energy transfer from LiB to PbB.
Figure 20 shows the variation of the OCV of single PbB and two PbB of BB 3.
Figure 20. Variation of (a) IR and (b) OCV of single PbB and two PbB of BIND Battery 3 during the 80ºC storage
For single PbB, OCV reaches to the test end condition (OCV: lower than 10.5 V) on the 43rd day from the start of storage. In addition, the IR of single PbB also rapidly increases on the same day. This OCV decrease is due to the accelerated self-discharge of PbB at high temperature [25]. The discharge end voltage of PbB at a low C-rate (such as 0.2C discharge) is generally defined as 10.5 V [26]. If the OCV becomes lower than 10.5 V, it means that PbB falls into an over discharge state. Therefore, single PbB in this experiment falls in over discharge state on the 43rd day.
The discharge capacity of single PbB and PbB of BB 3 after the storage was measured at 25ºC. The same discharge capacity measurement was also performed on unused PbB, and the discharge capacity degradation due to the high-temperature storage was investigated. It was seen that discharge capacity degradation rate of single PbB was 44.1%, whereas that of two PbB composing BB 3 were 41.0 and 39.8% respectively. Therefore, in BIND Battery, the discharge capacity degradation of PbB is suppressed compared to single PbB despite the former has been stored for a longer period than the latter. As shown in Figure 18, since the current flows from LiB to PbB in BIND Battery during the high temperature storage, the OCV decrease of PbB due to the self-discharge is supplemented by LiB. This suppression of OCV decrease suppresses the progress of sulfation [27] which results in the suppression of the discharge capacity degradation of PbB.
In conclusion, when BIND Battery is stored at high temperatures, the current flow from LiB to PbB is activated. This current flow can suppress the degradation of LiB by transferring the excess energy from LiB and lowering its SOC. On the other hand, the current flow can also suppress the degradation of PbB. The energy transfer from LiB to PbB can supplement the OCV decrease of PbB and suppress the progression of sulfation.
IV CONCLUSION
BIND Battery is a novel hybrid battery technology where LiB and PbB are directly connected in parallel and PbB compensates the intrinsic shortcomings of LiB. BIND Battery possesses the unique features described below and can be used safely and reliably even in more harsh environments as compared to conventional LiB only ESS.
1. During the discharge of BIND Battery, the current distribution between LiB and PbB sub-modules are automatically balanced. In BIND Battery, most of discharge capacity during normal use is provided by LiB and PbB reserves more than half of its capacity as extra energy that will be required in such as emergency situation. Even after BIND Battery is degraded by the cycle use, the current distribution maintains the same tendency as the initial discharge. Therefore, the autonomous control of the sub-modules can be maintained throughout the cycle life of BIND Battery.
2. When BIND Battery discharges with relatively high C-rate such as 1C, LiB takes the majority of total discharge current and reduces the C-rate of PbB. This results in the increase of discharge capacity of PbB. The rate performance of BIND Battery is close to that of single LiB instead of the middle of the rate performance between single LiB and PbB. In terms of micro EV application, BIND Battery can improve the cruising distance compared to the conventional PbB only micro EV.
3. BIND Battery possesses an intrinsic safety against overcharge. When BIND Battery is overcharged, the overcharged energy of LiB is transferred to and safely consumed by PbB. This energy consumption is more activated as battery temperature increases.
4. At extremely low temperatures, BIND Battery possesses a unique discharge mechanism where two different types of batteries complement each other and exhibit excellent low-temperature capability compared to single LiB and PbB.
5. When BIND Battery is stored at high temperatures, the current flow from LiB to PbB is activated. This current flow can suppress the degradation of LiB by lowering its SOC. Additionally, this current flow can also suppress the degradation of PbB by supplementing the OCV decrease and suppressing the progression of sulfation.
REFERENCES
[1]. Dincer, I. Renewable energy and sustainable development: a crucial review. Renewable and Sustainable Energy Reviews, 2000, 4, pp. 157-175.
[2]. Khara, V.; Nema, S.: Baredar, P. Status of solar wind renewable energy in India. Renewable and Sustainable Energy Reviews, 2013, 27, pp. 1-10.
[3]. Bekele, G.; Palm, B. Feasibility study for a standalone solar-wind-based hybrid energy system for application in Ethiopia. Applied Energy, 2010, 87, pp. 487-495.
[4]. Bevrani, H.; Ghosh, A.; Ledwich, G. Renewable energy sources and frequency regulation: survey and new perspectives, IET Renewable Power Generation, 2010, 4, pp. 438-457.
[5]. Alotto, P.; Guarnieri, M.; Moro, F. Redox flow batteries for the storage of renewable energy: A review. Renewable and Sustainable Energy Reviews, 2014, 29, pp. 325-335.
[6]. Diouf, B.; Pode, R. Potential of lithium-ion batteries in renewable energy. Renewable Energy, 2015, 76, pp. 375-380.
[7]. Matoba, T.; Tamaki, R.; Kobayashi, K.; Tsukamoto, T. bindbattery: a Novel Battery with the Overcharge Tolerance. the 55th Battery Symposium in Japan, 2014, 2A14.
[8]. Matoba, T.; Kato, K.; Kachi, N.; Tsukamoto, T. Energy Storage System with Bind Battery That Possesses Excellent Subzero Capability. the 57th Battery Symposium in Japan, 2016, 1C09.
[9]. Matoba, T.; Kachi, N.; Nakahara, Y.; Tsukamoto, T. Behavior of BIND Battery during High Temperature Storage. the 58th Battery Symposium in Japan, 2017, 1I08.
[11]. Matoba, T.; Kachi, N.; Nakahara, Y.; Tsukamoto, T. BIND Battery: Innovative Hybrid Battery Suitable for Renewable Energy Storage that Utilizes Mutual Autonomous Control between Lithium-ion Battery and Lead-acid Battery, Conference of the IEEJ in Okinawa, 2017, OKI-2017-30.
[12]. Bocklisch, T. Hybrid energy storage systems for renewable energy applications. Energy Procedia, 2015, 73, pp. 103-111.
[13]. Xiang, C.; Wang, Y.; Hu, S.; Wang, W. A New Topology and Control Strategy for a Hybrid Battery-Ultracapacitor Energy Storage System. Energies, 2014, 7, pp. 2874-2896.
[14]. Yoshida, H.; Tochikubo, K.; Mangahara, T. Development of VRLA Battery FC38-12 for Deep Cycle Use. FB Technical News, 2004, 60.
[15]. Denki kagakukai. Battery Handbook, Ohmsha, 2010, pp. 291.
[16]. Symanski, J. S.; Mahato, B. K.; Bullock, K. R. Defining a Recombination Efficiency for Sealed Lead-Acid Batteries. Journal of the Electrochemical Society, 1988, 135, pp. 548-551.
[17]. Kumai, K.; Miyashiro, H.; Kobayashi, Y.; Takei, K.; Ishikawa, R. Gas generation mechanism due to electrolyte decomposition in commercial lithium-ion cell. Journal of Power Sources, 1999, 81, pp. 715-719.
[18]. Arora, P.; Doyle, M.; White, R. E. Mathematical Modeling of the Lithium Deposition Overcharge Reaction in Lithium-Ion Batteries Using Carbon-Based Negative Electrodes. Journal of the Electrochemical Society, 1999, 146, pp. 3543-3553.
[19]. Ohsaki, T.; Kishi, T.; Kuboki, T.; Takami, N.; Shimura, N.; Sato, Y.; Sekino, M.; Satoh, A. Overcharge reaction of lithium-ion batteries. Journal of Power Sources, 2005, 146, pp. 97-100.
[20]. Wnag, Q.; Ping, P.; Zhao, X.; Chu, G.; Sun, J.; Chen, C. Thermal runaway caused fire and explosion of lithium ion battery. Journal of Power Sources, 2012, 208, pp. 210-224.
[21]. Rahimi-Eichi, H.; Ojha, U.; Baronti, F.; Chow, M-Y. Battery Management System: An Overview of Its Application in the Smart Grid and Electric Vehicles. IEEE Industrial Electronics Magazine, 2013, 7, pp. 4-16.
[22]. Ralbovsky IV, P. J. Understanding the Heat Signature from Charging and Discharging of Li-Ion Batteries. ECS Meeting Abstract, 2016-02, 341.
[23]. Lei, Z. Preheating method of lithium-ion batteries in an electric vehicle. Journal of Modern Power Systems and Clean Energy, 2015, 3, pp. 289-296.
[24]. Ishikawa, H.; Umeda, M.; Sone, Y.; Uchida, I. Charge/discharge Activation Energies of Commercial Lithium-ion Secondary Cell. BUNSEKI KAGAKU, 2013, 62, pp. 1029-1035.
[25]. Zachlin, A. C. Self Discharge in Lead-Acid Storage. Journal of the Electrochemical Society, 1947, 92, pp. 259-279. [26]. JIS D 5301: 2006, Lead-acid starter batteries
[27]. Ruetschi, P. Aging mechanisms and service life of lead–acid batteries. Journal of Power Sources, 2004, 127, pp. 33-44.