e-ISSN: 2278-7461, p-ISSN: 2319-6491
Volume 8, Issue 2 [February 2019] PP: 05-11
A Mathematical Model for Predicting Draught Output of an
Animal-Drawn MouldboardRidger
Kabri, H.U.,B. Umar, S. A. IyaandY. I. Tashiwa
Department of Agricultural and Environmental Engineering, ModibboAdama University of Technology, Yola, P.M.B. 2076, Adamawa State, Yola, Nigeria
Corresponding Author: Kabri, H. U.
ABSTRACT:-A Mathematical model for predicting the draught requirement of animal-drawn ridgerimplement was developed using implement and soil properties. The implement properties such as speed of operation, tillage depth, implement mass was considered in the model developed. The soil properties were soil moisture content and soil bulk density. The animal draught output model was developed by dimensional analysis, using the concept of Buckingham’s Pi Theorem. The assumptions were derived from empirical results. The developed model was verified by comparingthe predicted draught output by the model with the actual experimental results conducted in the field. The result reveals that the predicted model correlates well with the experimental results as could be seen from the r2 value of 0.9792. Also, a paired t-test revealed that the difference between the means of the predicted and measured experimental data was not statistically significant at 0.05 significant levels. The model can be used by animal-draught farmers in selecting the appropriate animal implement combination for any farm operation. The model can also be of value to scholars, consultants, government and international agencies interested in the development of animal drawn tillage implements especially in Nigeria.
Keywords:Model, Prediction, Animal-drawn, Mouldboardridger, Draught requirement, dimensional analysis --- --- Date of Submission: 05-08-2019 Date of acceptance:20-08-2019 --- ---
I.
INTRODUCTION
Despite the substantial progress made in mechanization of agriculture in the world, the challenges facing agricultural policy makers in the developing countries is how to increase agricultural production more than the subsistence production through increase in yield and labour saving. Nowadays, improvements in farm power availability through development and improvement of soil specific and farmer-friendly technologies for predominantly global agro-eco-regions, humans, draught animals and engines provide the motive power in various proportions for crop production, harvesting, transport and processing (Ogdigboh, 2000; Onwualuet al., 2006).
mouldboardridgertillage implement to provide a decision support system for agricultural planners and development agencies in achieving an efficient utilization of animal traction for crop production through choice of animals and implements combination to perform specific field operations.
II.
MATERIALS AND METHODS
This research work uses both theoretical as well as field experimental work. The theoretical part includes the development of the mathematical model for predicting the draught performance characteristics of the animal drawn ridger tillage tool. The field experiment involved the collection of data on-farm and on-station for development and validation of the mathematical model.
Theoretical Development: Modeling Factors Affecting Draught
Draught being a function of various factorsis affected by soil type and condition, implement type and shape, and animals which pull the implements. In addition to these, depth of operation, operating speed, power requirement, mass of the implement, soil moisture content and density of the soil affect the draught of animal-drawn implements. In this study, modeling of the effects of several pertinent factors that affect implement draught was carried out. These factors include soil moisture content, soil bulk density, speed of operation, depth of soil tillage, and implement mass.
Assumptions
The model development was based on certain assumptions in order to reduce the number of parameters involved in the draught determination to a manageable level: Soil in the test plots is assumed to be of homogenous type, the tillage treatments considered are economical of optimum draught characteristics with minimum labour requirements, the animals and operators used in this study are well experienced in carrying out field operations and the yoking system is efficient.
Formulation of the Prediction Equations
The output draught requirement of animal drawn mouldboardridgermodel was developed bydimensional analysisusing the Buckingham Pi theorem to derive a relationship between various physical quantities (Gajda and Biles, 1978).Considering some pertinent factors affecting draught,mathematical model of the implement draught can be represented as a function of dependent variable. The ‘effect’ (draught) could be hypothesized as a function of the ‘cause’ (draught characteristics) such as mass of the implement, depth of operation, speed of operation, soil bulk density and moisture content (Olatunjiet al., 2009; Okokoet al., 2018). Abstracting from error terms, the ‘cause-effect’ function could be expressed as:
f D, M, ρ, d, S, Im = 0 1
Where: D = Draught, N
Im = Implement mass, kg;
S = Speed of operation, m/s; d = Depth of operation, m; M = Soil moisture content, %;
ρ = Soil bulk density, kg/m-3;
f = functional relationship between the variables.
The general relationship between the dependent and the independent variables may be expressed as:
D = f M, ρ, d, S, Im orf D, M, ρ, d, S, Im = 0 2
Using the three basic dimension systems of mass (M), length (L) and time (T),the variables and their corresponding dimensions used in the model development are given in Table 1.while the dimension matrix is presented in Table 2.
The procedure for applying the Buckingham’s Pi Theorem to identify the dimensionless group to be formed is as follows:
Total number of quantities involved (n) = 6, Number of basic dimensions involved (b) = 3, the number of dimensionless (Pi terms) to be formed (Np) is given as: 6-3=3
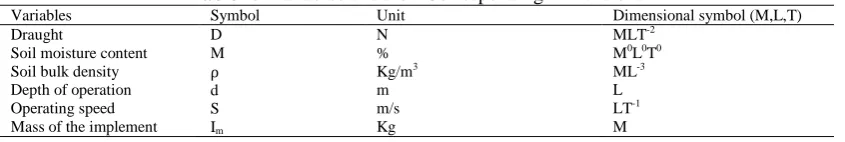
Table 1. Variables and their Corresponding Dimensions
Variables Symbol Unit Dimensional symbol (M,L,T)
Draught
Soil moisture content Soil bulk density Depth of operation Operating speed Mass of the implement
D M
ρ
d S Im
N % Kg/m3
m m/s Kg
MLT-2
M0L0T0
ML-3
L LT-1
Table 2. Dimensional Matrix of Variables
D M Ρ D S Im
M 1 0 1 0 0 1
T -2 0 0 0 -1 0
L 1 0 -3 1 1 0
Considering S,ρ, and d as repeating quantities
π1= f S, ρ, d, D = f S a d b ρ c D
Equating the dimensions and solving for the exponents:
M0L0T0= LT−1a L b ML−3 c MLT−2 This is dimensionless
π1= k1 S−2ρ−1d−2D = k1
D S2ρd2 3
π2= f S, ρ, d, Im = f S a ρ b d c Im
Equating the dimensions and solving for the exponents:
M0L0T0= LT−1a ML−3 b L c M . This is also dimensionless
𝜋2= 𝑘2 𝑆0𝜌−1𝑑−3𝐼𝑚 = 𝑘2
𝐼𝑚
𝜌𝑑3 4
𝜋3= 𝑘3𝑀 = 𝑀0𝐿0𝑇0 5
𝜋3= 𝑘3𝑀. Another dimensionless term
k1, k2, k3, represent an unknown function.
The three Pi terms required and the equation can be written as:
𝜋1= 𝑓 𝜋2, 𝜋3 6
Where:
𝜋1=
𝐷
𝑠2𝑑2𝜌, 𝜋2=
𝐼𝑚
𝜌𝑑3 , 𝜋3= 𝑀
These Pi terms specify the requirement for similarity and therefore included ratios defining geometric and dynamic similarities for the variables which are relevant to this problem. The general solution can therefore be written from the dimensional analysis including three dimensionless groups (π1 , π2 and π3) as:
𝐷
𝑆2𝑑2𝜌= 𝑓
𝐼𝑚
𝜌𝑑3, 𝑀 7
This involved an unknown function f. The formulation of the prediction equations involves the determination of the function for the general equation.
Field Experimental Study
The main field studies was conducted at the Department of Agricultural and Environmental Engineering Research Farm of the ModibboAdama University of Technology Yola within the Savannah region, Yola area (90 14’N and 120 32’E) of Adamawa State – Nigeria. The area is at an elevation of 200m above sea level and falls within the Eastern Sudan Savanna ecological zone of Nigeria. The area is an agrarian tropical environment marked by dry season (November-April) and wet season (May-October) with mean annual rainfall usually ranges from 700mm to 1,050mm (Adebayo and Tukur, 1999; UBRBDA, 2013). The soils type in the area is predominantly of sandy loam textures (Kabri, et al., 2010).The field study focused on the use of a pair of Zebu bulls as draught animals. The implement considered in this study was the animal-drawn mouldboardridgerthe most commonly used in the study area (Haqueet al,.2000). The variables observed include: Age of each animal (Yrs.), Weight of each animal (kgf), Pulling force (N), angle of pull in degree (o), distance travelled (m), working time (s), working speed (m/s), implement working depth (cm), implement working width (cm) and soil gravimetric water content (%). A 1 x 3 x 3 factorial experiment involving three speed levels (S1,
S2, S3) and three depth levels (d1,d2, d3) in a Completely Randomized Design (CRD) was designed for the study.
The experimental comprised of nine treatments replicated three times.These values were used as input data for the development of the model for prediction of draught requirement of animal-drawn ridger tillage implement. The Field data collected from the different treatment areasin real farmer environments within the study area were used as input data for the validation of the model developed.
Determination of the Component Equations
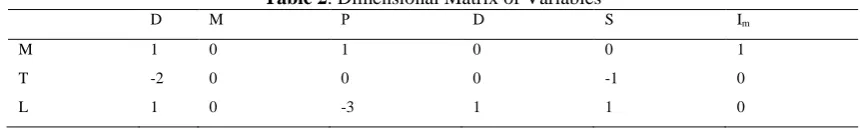
The component equations are formed from the plots of π1 against π2 and π1 against π3generated from
of the component equations formed a plane surface in linear space. These regression equations, being linear, favored combination by summation.
Table 3. Experimental Data for the Determination of π-terms
Treatment Draught (D)
N
Depth of Cut (d) cm
Bulk Density (ρ) g/cm3
Moisture Content (MC) % Implement
Weight (Im) kg
1 s1d1 301.5 8.00 1.18 6.08 56.7
2 s1d2 308.0 13.52 1.43 5.78
3 s1d3 320.0 18.06 1.59 5.47
4 s2d1 314.1 8.00 1.26 4.81
5 s2d2 337.1 13.52 1.58 4.20
6 s2d3 346.3 18.06 1.78 4.70
7 s3d1 323.2 8.00 1.45 4.31
8 s3d2 342.0 13.52 1.65 4.43
9 s3d3 356.4 18.06 1.86 5.11
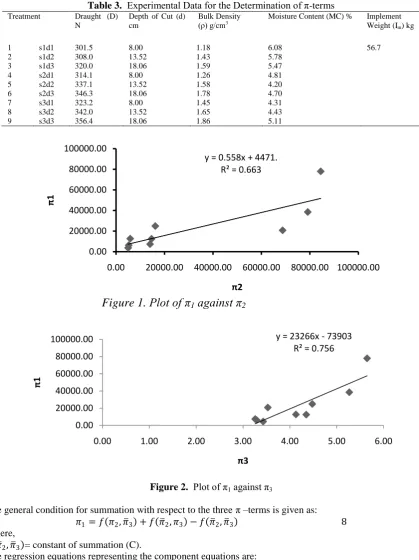
Figure 2. Plot of π1 against π3
The general condition for summation with respect to the three π –terms is given as:
𝜋1= 𝑓 𝜋2, 𝜋 3 + 𝑓 𝜋 2, 𝜋3 − 𝑓 𝜋 2, 𝜋 3 8
Where,
𝑓 𝜋 2, 𝜋 3 = constant of summation (C).
The regression equations representing the component equations are:
𝜋1= 0.5585𝜋2 + 4471.9 9
𝜋1 = 23266𝜋3 − 73903 10
Determination of the Constant of Summation (C) The constant of summation (C) for the three π-terms is:
𝐶 = 𝑓 𝜋 2, 𝜋 3 11
The constant C can be evaluated from any of the component equations y = 0.558x + 4471.
R² = 0.663
0.00 20000.00 40000.00 60000.00 80000.00 100000.00
0.00 20000.00 40000.00 60000.00 80000.00 100000.00
π
1
π2
y = 23266x - 73903 R² = 0.756
0.00 20000.00 40000.00 60000.00 80000.00 100000.00
0.00 1.00 2.00 3.00 4.00 5.00 6.00
π
1
𝐶 = 0.5585𝜋2 + 4471.9 12
Or
𝐶 = 23266 𝜋3− 73903 13
2.5 Determination of Prediction Equation
The general prediction equation for the system involving the three π-terms as indicated in equation (8) was formed by adding the component equations as:
𝜋1= 𝐹 𝜋2, 𝜋 3 + 𝐹 𝜋 2, 𝜋3 − 𝐶 14
Substituting equations 10 and 11 into equation 12
𝜋1= 0.5585 𝜋2 + 23266 𝜋3 − 118089.87 15
Therefore:
𝐷
𝑠2𝑑2𝜌= 0.5585
𝐼m
𝜌𝑑3+ 23266 𝑀 − 118089.87
𝐷 = 𝑠2𝑑2(0.5585 𝐼
𝑚𝑑−3+ 23266 𝜌𝑀 − 118089.87𝜌) 16
Equation 16gives the required model for predicting the draught requirement of animal-drawn tillage tool.
II.
RESULTS AND DISCUSSIONS
Model Validation
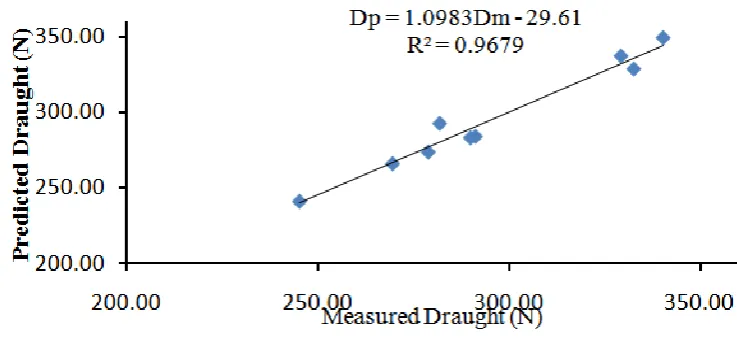
The proposed model Equation 16 was validated by comparing the results of the model generated and measured field experimental draught under farmers’ field conditions. The result showed a very well agreement between the predicted and field experimental data with R2 = 0.9679as shown in Figure 3 with the value of the slope and intercept (regression coefficient) as 1.0983 and 29.61 respectively. The regression equation obtained from the least square analysis for the predicted and measured results were:
𝐷𝑝 = 1.0983𝐷𝑚− 29.61 17.
Figure 3.Predicted Draught Output against the Measured Draught output for mouldboardRidger
Table 4.t-Test: Paired Two Sample for Means of Measured and Predicted Draught Data
Measured Variable 1 Predicted Variable 2
Mean 295.454 294.892
Variance 1032.14 1286.31
Observations 9 9
Pearson Correlation 0.98384
Hypothesized Mean Difference 0
Df 8
t Stat 0.23571
P(T<=t) one-tail 0.40979
t Critical one-tail 1.85955
P(T<=t) two-tail 0.81958
t Critical two-tail 2.306
Considering the overall means, the measured output data was 1.1% greater than the predicted output. However, the likely discrepancies noted in the measured draught requirement values could be due to the assumptions regarding the homogeneity of the soil and strength parameters used in the model; and the unsteady interaction between the soil-tool interface arising from tool-frame instability and the soil movement over the mouldboard during the tillage operations.
IV.
CONCLUSIONS
The equation D = s2d2(0.5585 I
md−3+ 23266 ρM − 118089.87ρ) was formulated to predict the
draught requirement of animal drawn mouldboardridger tillage implementusing a mathematical model which includes parameters such as implement mass, speed of operation, soil moisture content and bulk density. The differences between the means of the predicted and measured draught output of the animal – drawn mouldboardridgerdraught requirement are not statistically significant at 5 % level of significance.The draught requirements prediction results obtained are promising and showed a very well agreement between the predicted and experimental data.The developed model provides a simplified representation of the processes in soil tillage and the interactions of the speed and depth of operationat the farm level. It can be used as a tool for the strategic planning in tillage operations to improve the efficiency of draught animal power in crop production by estimating effect of work stress, work requirement and energy requirements for maintenance in Bosindicus cattle.
REFERENCES
[1]. Adebayo, A. A. and Tukur, A. L. (1999).Adamawa State in Maps. (1st Ed) Paraclete Publishers, Yola-Nigeria, 7-10
[2]. Ademiluyi, Y. S., Faleye, T. and Oyelade, O. A. (2007). Design Considerations for an Animal- Drawn Combination Tillage
Implement; In: Proceedings of the 8th International Conference of the Nigerian Institution of Agricultural Engineers, 29:
10-13
[3]. Al-Janobi, A. A. and Al-Suhaibani A. A. (1998).Draft of Primary Tillage Implements in Sandy Loam Soil.Trans of the ASAE, 14(4): 343-348
[4]. Amara, M. and Guedioura, I. (2013). A Force Prediction Model for the Plough Introducing its Geometrical Characteristics and its Comparison with Gorjachkin and Gee Clough Models. Erudite Journal of Engineering Sciences and Technology (EJEST), 1(1): 1 – 7
[5]. ASAE, (1994).Agricultural Machinery Management Data. 41st ed. ASAE D497; St Joseph, Michigan, USA: ASAE, p343
[6]. Bobobee, E.Y.H. (2007). Performance Analysis of Draught Animal-implement System to Improve Productivity and Welfare. Unpublished PhD Thesis, Department of Biochemistry and Engineering; Uppsala Swedish University of Agricultural Sciences; p27
[7]. Chawatama, S, Ndlovu, L. R, Richardsoni, F. K; Mhlanga, F and Dzama, K. (2003).A Simulation Model of Draught Animal Power
in Smallholder Farming Systems. Part I. Context and Structural Overview; Agricultural Systems, 76: 415-440
[8]. Fall, A. and Faye, A. (2010).Minimum Tillage for Soil and Water Management with Animal Traction in the West-African region; 25-31. Retrieved November 13, 2011; from: http://www.animaltraction.net/contil/contil-fall-westafrica. Pdf
[9]. Gajda, W.T. and Biles, W.E. (1978). Engineering: Modeling and Computation. Houghton Mifflin Company, Boston; 25-35
[10]. Gbadamosi, L. and Magaji, A.S (2004). Field Study on Animal Draught Power for Farmers in Zuguma Village of Niger State, Proceedings of 5th International Conference and 26th Annual General Meeting of Nigerian Institution Agricultural Engineers
(NIAE). 26: 84-85
[11]. Haque, M. A., Umar, B. and Kawuyo, U. A. (2000).A Preliminary Survey on the Use of Animal Power in Agricultural Operations in Adamawa State, Nigeria. Outlook on Agriculture, 29(2): 123 – 127
[12]. Inns, F.M. (1991).The Mechanics of Animal Draught Cultivation Implements. Part 2: Beam Pulled Implements. The Agricultural Engineer, 46(1): 18-21.
www.ijeijournal.com Page | 11
[14]. Kawuyo, U. A. (2011).Mathematical Modeling of Draught Characteristics of Selected Animal-Drawn Implements on the Upland Soils of Samaru, Nigeria. Unpublished Ph.D Thesis Submitted to the Postgraduate School, Department of Agricultural Engineering, ABU Zaria, Nigeria.
[15]. Kawuyo, U. A., Atiku, A. A. and Bwala, E. J. (2012). Draft Animal Power Utilization in Tillage Operations in Borno State, Nigeria. Journal of Engineering and Applied Sciences, 7(10): 1349 -1352
[16]. Odigboh, E. U. (2000). Mechanization of Nigerian Agricultural Industry Pertinent Notes: Pressing Issues; Pragmatic Options. A public Lectures Academic of Science International Conference Centre Abuja-Nigeria; 13-23
[17]. Okoko, P, Ajav, E. A., and Olosunde, W. A. (2018).Draught and Power Requirements for Some Selected Tillage Implements operating in Clay Loam Soil.AgriculturalEngineering International:CIGR Journal, 20(1):95-102
[18]. Olatunji, O. M.; Akor, A. J.; Ozogu, B. A.; Burubai, W and Davies, R. M. (2009).Modeling the Efffect of Weight and Forward Speed on the performance of Disc Plough.Electronic Journal of Environmental, Agricultural and Food Chemistry, 8 (2): 130-149, ISSN: 1579-4377.
[19]. Onwualu, A. P., Akubuo, C. O. and Ahaneku, I. E. (2006). Fundamentals of Engineering for Agriculture Immaculate Publications Limited (Press Division) Enugu
[20]. Onwualu, A. P; Watts, K. C. and ZeinEldin, A. M. (1991).An Evaluation of Methods for Predicting Dynamic Soil-Tool Interaction. ASAE paper 90-1543 ASAE St. Joseph, MI 49085
[21]. Sanni, S. A. (2008). Animal Traction: An Underused Low External Input Technology among Farming Communities in Kaduna State, Nigeria. TROPICULTURA, 26 (1): 48-52
[22]. Upper Benue River Basin Development Authority (UBRBDA), (2013). Upper Benue River Basin Development Authority, Yola Metrological Data Year book (Unpublished)