Object Oriented Test Case Generation Technique using
Genetic Algorithms
V.Mary Sumalatha
Research Scholar
Gitam University, Andhra Pradesh India
G.S.V.P.Raju,
PhD. Andhra University Visakhapatnam, Andhra PradeshABSTRACT
Computers have become a necessity in our everyday lives, and are used in a variety of systems, ranging from sophisticated ones to home appliances. Software plays an important role in many of these systems. As a result, the usage of software for a variety of purposes in different domains of modern life is rapidly increasing. With the advancements in technology, computers and in particular their software have become quite complex. Due to this reason, the correctness of software cannot be guaranteed, even by the programmer who has designed it. Since dependence on software is continuously increasing, one do not expect it to fail. However, software often contains errors. The severity of software errors can range from minor irritations to major economical losses or catastrophic situations. Software testing is one of the main activities to be carried out in the software development life cycle. It consumes more money and time, which leads to automation that reduces the human effort in finding bugs and errors. Automation in the last phase of system development is similar to manual testing. In both cases bugs are detected only after code has been complete. So rectifications and modification of the code takes lot of time. So testing process should be started from the beginning phase of software development life cycle and should continue till the last phase. For this it is proposed to generate test cases for object oriented software using UML diagrams like Sequence diagram. Test cases are optimized using the evolutionary algorithm, Genetic Algorithm.
Keywords
UML, Sequence diagrams, Genetic Algorithms, Evolutionary Algorithm, Software Testing, and Test case Generation.
1.
INTRODUCTION
Software testing is a process to analyze the software to detect the bugs, fault, failures; it is used to validate the features of the software, and is used to ensure that it satisfies the customers and developers requirements. Mainly there are three approaches in software testing namely, black-box testing, white-box testing and grey box testing. Black-box testing is testing the functionality against software specifications. Testers determine what input should be given, what output should be generated, and testers analyze the external behaviour of the software. On the other hand, white-box testing is an examination of the logic, and the procedure used in the software. It focuses on testing the data structures, branches, loops, conditions, objects, messages, critical paths generated. Grey-box testing is a combination of both white and black box testing. In grey box testing tested doesn’t have complete information of the system but has some idea about the system. So grey box testing is not completely white box or black box testing Software testing is a verification process which promises the clients expectations and requirements
about the software. Verification is done to guarantee that developed software is meets clients requirements. Requirements are broadly divided into two categories: functional requirements and non-functional requirements. Functional requirements specify what the proposed system should do. Non-functional requirements specify how the system should behave. There are many qualities that judge non functional requirements like reliability, scalability, security, maintainability, availability. Functional testing provides a test for functional requirements. Testers perform functional testing by performing integration testing. Testers can test each functional requirement using a Test case. A Test case is the input applied to the software during execution. A set of test cases is called Test suite.
1.1
Black box testing
Black box testing is mainly used to execute the requirements of the system. It mainly concentrates on whether the input is accepted and output is generated or not. It concentrates on functional requirements so it is also called as functional testing. Functional testing evaluates the correctness of the program without any knowledge of how the software is implemented. In black box testing, testers test software through user interfaces, data structures, data base, or the application programming interfaces at the later stages of software development. Code access is not allowed in black box testing. The software is successful if the program executes the test cases and returns the expected output. The expected results are stated in the user requirements. In the analysis phase of the software development life cycle, software architects must elicit requirements and transform them into program features that meet customers’ needs. In the design phase developers receive these requirements and produce design documents for their programmers. Black box testing techniques are boundary value analysis, equivalence classes, decision table testing, state transition testing and use case testing. Advantages of black box testing are ease of use and simplicity.
1.2
White box testing
1.3
Grey box testing
Grey-box testing is a combination of benefits of both black box-testing and white box-testing. As with black-box testing, grey-box testing uses a specification for creating test cases. In grey box testing the tester has limited knowledge of the system. The specification used in grey-box testing does not specify only the requirements of a system, but it also describes the behavior of the system. Grey-box testing is similar to white-box testing in this sense. The behavioral information embedded in a specification is also used for generating test cases
1.4
Software testing approaches
There are mainly three types of testing approaches namely Model based testing, Specification based testing and code based testing. In specification-based techniques test cases are derived directly from the specification or from some other kind of model of what the system should do. The principle of code based testing is to have each and every statement in the program executed at least once during the test. Code based testing attempts to test all reachable elements in the software under the cost and time constraints. The testing process begins by first identifying areas in the program not being exercised by the current set of test cases, follow by creating additional test cases to increase the coverage. Methods proposed for structural code based testing include statement coverage, decision coverage and condition coverage. Model-based testing is an approach that bases common testing tasks such as test case generation and test result evaluation of a model. A model of software is a depiction of its behavior where behavior can be described in terms of the input sequences accepted by the system, the set of actions, conditions, the flow of data through the application’s modules and routines. There are numerous such models, and each describes different aspects of software behavior. For example, control flow, data flow, and program dependency graphs express how the implementation behaves by representing its source code structure. Decision tables and state machines, on the other hand, are used to describe external so-called black box behavior. Examples of some software testing models are finite state machines, state charts, the unified modeling language (UML), Markov chains and grammars. This paper concentrates on model based approach. Activities in MBT are building a model, generating expected inputs and outputs, running the tests, comparing the actual outputs with expected outputs and stop testing after a criterion is reached
2.
RELATED WORK
Various researchers carried out their work in the field of test data generation. Bouchachia[1] proposed a modification to genetic algorithm by incorporating immune operators to it. This approach used ‘Condition coverage testing criteria’. In immune genetic algorithm, one more operator known as reselction’ is added to the genetic algorithm. X. Shen, Q. Wang, P. Wang, Bo Zhou[2] proposed the hybrid scheme of genetic algorithm and tabu search that came to known as GATS algorithm. ‘Function coverage’ is used as testing criteria. Tabu search is a local search technique and is used as a mutation operator in this work. M. A. Ahmed and
Hermadi[5] attempted to generate test data for multiple paths using genetic algorithm. M. Harman[6] focused on automated test data generation using search based software engineering. Automated test data generation using genetic algorithm is a part of search based software engineering. P.R. Srivastava and T.H. Kim[3] proposed a technique for generating test cases using ‘path coverage testing criteria’ and genetic algorithm. This technique was based on considering the criticality of the path. A. Rauf and S. Anwar[4] proposed a technique to generate software test data using ‘GUI based test criteria’. GUI applications are event driven. This technique uses genetic algorithm to generate software test data. Automatic Test Data Synthesis using UML Sequence Diagrams by Ashalatha Nayak and Debasis SamantaI[7] proposed an approach of synthesizing test data from the information embedded in model elements such as class diagrams, sequence diagrams and OCL constraints. In their approach, they enrich a sequence diagram with attribute and constraint information derived from class diagram and OCL constraints and map it onto a structured composite graph called SCG. The test specifications are then generated from SCG. Test Case Automate Generation from UML Sequence Diagram and OCL Expression by Li, Bao-Lin Li,Zhi-shu Qing, Li Chen, Yan-Hong[8] proposed a new test cases generation approach which based on UML sequence diagrams and Object Constraint Language (OCL). Monalisa sarma, D. Kundu and R.Mall [9] proposed a paper on sequence diagrams. This paper presents a novel approach of generating test cases from UML design diagrams. The approach consists of transforming a UML sequence diagram into a graph called the sequence diagram graph (SDG) and augmenting the SDG nodes with different information necessary to compose test vectors. These information are mined from use case templates, class diagrams and data dictionary. The SDG is then traversed to generate test cases. Several researchers have proposed different technique based on UML interaction diagrams (sequence and collaboration diagram) [10, 11, 12, 13, 14, 15]. Bertolino and Basanieri [14] proposed a method to generate test cases using the UML Use Case and Interaction diagrams (specifically, the Message Sequence diagram). It basically aims at integration testing to verify that the pre-tested system components interact correctly. It uses category partition method [16] and generates test cases manually following the sequences of messages between components over the Sequence Diagram.
3.
GENETIC ALGORITHM
3.1
Different types of search optimization
algorithms
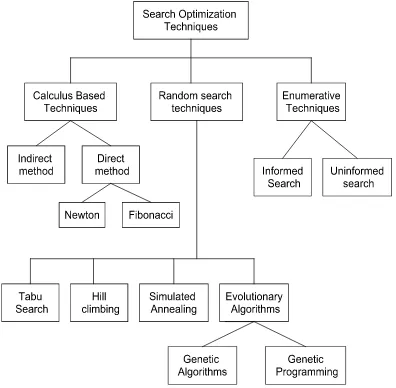
Figure 1. Optimization Techniques
This paper uses evolutionary algorithms and concentrates only on evolutionary algorithms. EA’s describe the process of search, and allows to carry out the search and allow to find optimal solution.
3.2
Evolutionary algorithms
Evolutionary algorithms apply on the principle of survival of the fittest. Evolutionary algorithms are part of optimization and search methods which is a subset of evolutionary computation, which is further a subfield of Artificial intelligence. Evolutionary computation is a general term for several computational techniques based on natural selection and genetic inheritance. Evolutionary algorithms refer to evolutionary computation models using randomness and genetic inspired operations. Evolutionary algorithms involve selection, recombination, random variation and competition of the individuals in a population of adequately represented potential solutions. The potential solutions are referred as chromosomes or individuals. Evolutionary algorithms mainly applied in the areas of engineering, operations research, genetics, feature extraction and data mining.
The evolutionary algorithms include
a. Genetic algorithms
b. Genetic programming.
GA is inspired by Darwin’s theory about evolution. Genetic algorithm uses the principle of selection to evolve a set of solutions and to find an optimum solution. Genetic algorithms simulate the survival of the fittest among individuals over generations for solving a problem. In nature competition among individuals results in the fittest individuals dominating the weaker ones. GAs uses several operations like selection, crossover and mutation.
procedure GA
begin
t = 0;
initialize P(t);
evaluate P(t);
while not finished do
begin
t = t + 1;
select P(t) from P(t-1);
reproduce pairs in P(t);
evaluate P(t);
end
end.
A Simple Genetic Algorithm
4.
UML DIAGRAMS
The Unified Modeling Language (UML) is a specification defined by the Object Management Group in the year 2010. UML is widely used for object-oriented analysis and design. UML consists of diagrams which describe structures and behavior of a system. The structural diagrams declare components of a system and how each component is connected to one another. Examples of a structural diagram are the class diagram, the component diagram, the composite structure diagram, and the deployment diagram. The behavioral diagrams depict the behavior of a system in different ways. Examples of behavioral diagrams are the activity diagram, interaction diagram, state machine diagram, and use case diagram. Software designers use a combination of structural diagrams and behavioural diagrams to specify the system
4.1
UML sequence diagram
A sequence diagram shows a set of system events that occur in a use case. It is said to implement a use case. A sequence diagram shows the messages that are exchanged among several objects, as well as certain control flow information. It shows the dynamic collaborations between a certain numbers of objects and also includes flow of events during interactions, with primary flows and alternative flows. Alternative flows represent conditional branches in the processing. In UML, a message is a request for a service from one object to another; these are typically implemented as method calls. Each sequence diagram represents a complete trace of messages during the execution of a user-level operation. Such diagrams capture important aspects of object interactions, and can be naturally used to define testing goals that must be achieved during testing. When a message is sent to an object, it invokes an operation of that object. Once a message is received, the operation that has been invoked begins to execute.
4.2
Basic notation used in sequence
diagram [17]
1. Actor: An internal or external participant or entity that interacts with the system
2. Object: Elements that are involved in interaction.
3. Unit: Unit is a header element that can send or receive messages
4. Separator: Represents an interface or boundary between subsystems
6. Action : Represents an action taken by an actor, object or unit
7. Asynchronous Message: A message that does not require a response before the sender continues.
8. Block : A block representing a loop or conditional for a particular header element
9. Call back Message: A message that returns back to the participant who is waiting for a return call.
10. Create Message: A create message creates a header element or a participant.
11. Destroy Element: Represents the destruction of a header element
12. Destroy Message: Represents the destruction of a header element as a result of a call from another element
13. Diagram Link: Represents a portion of a diagram being treated as a functional block. Similar to a procedure or function call that abstracts functionality or details not shown at this level.
14. Else Block: Represents an else block portion of a diagram block
15. Flow Note: Flow notes are used to add descriptive text.
16. Message: A simple messages are interactions between components
17. Return Message: A return message between header elements
18. Timer Start : Start of a timer for a particular header element
19. Timer Stop : Stop of a timer for a particular header element
20. Timer Expiration: Expiration of a timer for a particular header element
5.
METHODOLOGY
5.1
Sequence graph
To generate test cases from sequence diagram, first convert the sequence diagram to an intermediate form known as sequence graph.
Algorithm to convert Sequence diagram to Sequence graph
1. Collect all objects, method calls and messages.
2. For every conditional message allot one node and two edges.
3. For every return statement that contains true or false is represented using one node and two edges one for true and other for false.
4. For every other message allot one node and an edge.
5. Connect the nodes and edges according to the order they occur.
5.2
Proposed Method
1. Draw the sequence diagram.
2. Convert the sequence diagram to a sequence graph using the above said algorithm.
3. Assign weights to the nodes as the parents weight is the weight of the node. If a node has multiple parents then add the weights of the parents to be the weight of the node.
4. Apply Genetic Algorithm to the sequence graph.
5. Generate all paths between the source and destination with loops.
6. To calculate fitness value
For each path calculate the cost of the path, here the path’s cost will be the sum of all the costs assigned to each link in the path
Apply the fitness functions as F(X)=X*X
Calculate the probability of the individual as p(i)= F(x)/∑F(x)
7. To select the individuals from large initial population produce a new generation of solutions by picking from the existing pool of solutions with a preference for solutions which are better suited than others.
The probability range is divided into bins, sized according to the relative fitness of the solution which they represent.
By generating random values and seeing the bin where it fall into, to pick the individuals that will form the basis of the next generation.
8. To perform crossover, mate the first two strings together and the second two strings together and so on. For the first two pairs perform single point crossover on the fifth bit from left. For the next two pairs perform single point crossover on the third bit from left.
9. Mutate every fourth bit if random number generated is less than 0.2 to obtain the best path.
10. Reevaluate fitness of the new generation.
11. Repeat this process until the fitness value minimizes or all the paths have been covered or maximum number of generations is reached
12. Best Test path generated.
13. End.
6.
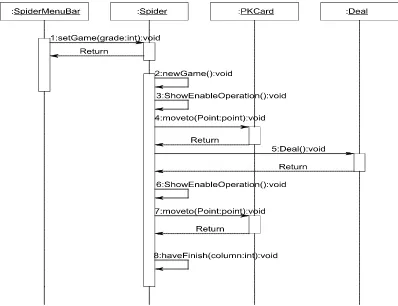
CASE STUDY: SPIDER CARD GAME,
Deal cards scenario.
Figure 2. The sequence Diagram for Deal cards scenario
[image:5.595.64.268.277.477.2]The sequence diagram is converted to sequence graph and the graph is as follows
Fig 3. The sequence graph for the Deal cards Scenario
The Possible unique paths generated from the above graph are
srcnode: A=>B=>C=>D=>E=>F=>I :dstnode, cost= 34
srcnode A=>B=>C=>D=>E=>F=>D=>G=>H=>I :dstnode, cost=54
srcnode A=>B=>C=>D=>G=>H=>I :dstnode, cost=39
srcnode A=>B=>C=>D=>G=>H=>D=>E=>F=>I :dstnode, cost=66
Number of all possible paths = 4
Find cost of the paths and start with the initial population. Find the fitness of the initial population and arrange them in the appropriate bins. Generate random numbers to select individuals from the initial population. Perform crossover and mutation. Fitness of the initial population and selection of next generation is given in the following tables.
Path no
chromoso me
X X*X probabil
ity
Associated bin
1 00100010 34 1156 0.102192 0-0.102192
2 01000010 66 4356 0.385078 0.1-0.48727
3 00100110 38 1444 0.127652 0.4-0.61492
4 01000010 66 4356 0.385078 0.6-1
total 11312
Table1. Fitness of Initial Population.
Rando m no
Falls into bin
Mati ng pool
Selection Crossover Mutation
0.8147 4 0 01000010 01000010 01000010
0.9058 4 1 01000010 01000010 01000010
0.1270 2 0 01000010 01000010 01010010
0.9134 4 3 01000010 01000010 01000010
Table2. Selection of New generation
Path
no chromosome X X*X probability
Associated bin
1 01000010 66 4356 0.220089 0-0.2200
2 01000010 66 4356 0.220089 0.22-0.44
3 01010010 82 6724 0.339733 0.44-0.77
4 01000010 66 4356 0.220089 0.77-1
total 19792
Table 3. Fitness of the new generation.
Random no
Falls into bin
Mating pool
Selection Crossover Mutation
0.8003 4 1 01000010 01000010 01000010
0.1419 1 1 01000010 01000010 01010010
0.4218 2 1 01000010 01000010 01000010
0.7157 3 1 01010010 01010010 01010010
Table4. Selection of New generation
Path
no chromosome X X*X probability
Associated bin
1 01000010 66 4356 0.19657 0-0.196
2 01010010 82 6724 0.30343 0.1-0.5
3 01000010 66 4356 0.19657 0.5-0.697
4 01010010 82 6724 0.30343 0.7-1
total 22160
Random no
Falls into
bin
Mating pool
Selection Crossover Mutation
0.7922 4 1 01010010 01010010 01010010
0.9595 4 0 01010010 01010010 01010010
0.6557 3 1 01000010 01000010 01000010
0.0357 1 2 01000010 01000010 01010010
Table6. Selection of New generation
Path
no chromosome X X*X probability
Associated bin
1 01010010 82 6724 0.274136 0-0.27436
2 01010010 82 6724 0.274136 0.2-0.5481
3 01000010 66 4356 0.177593 0.5-0.7254
4 01010010 82 6724 0.274136 0.7-1
total 24528
Table7. Fitness of next generation.
Random no
Falls into
bin
Mating pool
Selection Crossover Mutation
0.3922 2 1 01010010 01010010 01010010
0.6555 3 1 01000010 01000010 01000010
0.1712 1 2 01010010 01010010 01000010
0.7060 3 0 01000010 01000010 01000010
Table8. Selection of New generation
Path
no chromosome X X*X probability
Associated bin
1 01010010 82 6724 0.339733 0-0.33933
2 01000010 66 4356 0.220089 0.3-0.5592
3 01000010 66 4356 0.220089 0.5-0.7791
4 01000010 66 4356 0.220089 0.7-1
total 19792
Table9. Fitness of next generation.
Random no
Falls into bin
Mating pool
0.9502 4 1
0.0344 1 1
0.8387 4 0
0.3816 2 2
Table10. Mating pool of the final population.
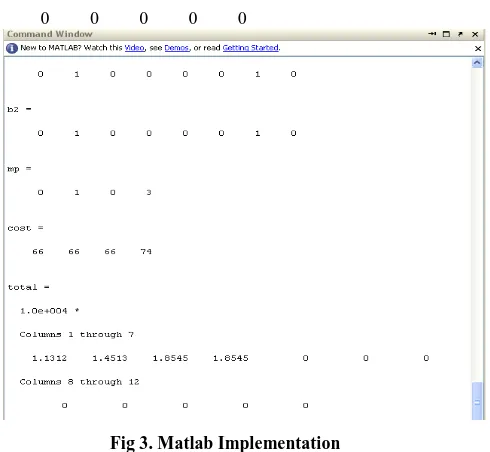
The difference of total value of the chromosomes between the two generations started decreasing, which terminates the algorithm with no further selection. The mating pool and the cost value 66 indicate that the algorithm terminates and the optimal path that must be traversed first is path 4 with cost 66. The same has been implemented in Matlab and the result is as follows.
>> a11
iter = 1
cost = 34 66 38 66
prob = 0.1022 0.3851 0.1277 0.3851
r = 0.8147 0.9058 0.1270 0.9134
fb = 4 4 1 4
mp = 1 0 0 3
iter = 2
cost = 66 66 38 66
prob = 0.3001 0.3001 0.0995 0.3001
r = 0.6324 0.0975 0.2785 0.5469
fb = 2 4 1 1
mp = 2 1 0 1
iter = 3
cost = 66 74 66 66
prob = 0.2349 0.2953 0.2349 0.2349
r = 0.9575 0.9649 0.1576 0.9706
fb = 4 4 1 4
mp = 1 0 0 3
iter = 4
cost = 66 66 74 66
prob = 0.2349 0.2349 0.2953 0.2349
r = 0.9572 0.4854 0.8003 0.1419
fb = 4 2 4 4
mp = 0 1 0 3
ans=
cost =
66 66 66 74
total =
1.0e+004 *
Columns 1 through 7
1.1312 1.4513 1.8545 1.8545
0 0 0 0 0
Fig 3. Matlab Implementation
Matlab implementation to find mating pool of the final population.
7.
CONCLUSION
This paper presented the test case generation by means of UML sequence diagram using Genetic Algorithm from which best test cases can be optimized. Moreover this method for test case generation inspires the developers to improve the design quality and to find multiple test cases ready for execution. In future, it is possible to build an automatic tool using this approach. This automatic tool will reduce cost of software development and improve quality of the software
8.
REFERENCES
[1]. A. Bouchachia, “An Immune Genetic Algorithm for Software Test Data Generation”, Seventh International Conference on Hybrid Intelligent Systems, 0-7695-2946-1/7 © 2007 IEEE. pp.84-89.
[2]. X. Shen, Q. Wang, P. Wang, Bo Zhou, “Automatic Generation of Test Case based on GATS Algorithm”, 2007AA04Z148, supported by Nation 863 Project.
[3]. P.R. Srivastava, T. Kim, “Application of Genetic Algorithm in Software Testing”, International Journal of Software Engineering and Its Applications, Vol. 3, No. 4, October 2009, pp.87-96.
[4]. A. Rauf, S. Anwar, “Automated GUI Test Coverage Analysis using GA”, 2010 Seventh International Conference on Information Technology, 978-0-7695-3984-3/10 © 2010 IEEE, pp.1057-1062
[5]. M. Harman, “Automated Test Data Generation using Search Based Software Engineering”, Second
International Workshop on Automation of Software Test (AST'07) 0-7695-2971-2/07 $20.00 © 2007IEEE.
[6]. M. A. Ahmed, I. Hermadi, “GAbased multiple paths test data generator”, Computers and Operations Research (2007).
[7]. Ashalatha Nayak, Debasis Samanta: "Automatic Test Data Synthesis using UML Sequence Diagrams", in Journal of Object Technology, vol. 09, no. 2, March{April 2010, pp. 75{104,
[8]. Li Bao-Lin, Li Zhi-shu, Li Qing, Chen Yan Hong ,” Test Case automate Generation from UML Sequence diagram and OCL Expression”, International Conference on Computational Intelligence and Security 2007, pp 1048-52.
[9]. Monalisa Sarma Debasish Kundu Rajib Mall, “Automatic Test Case Generation from UML Sequence Diagrams”,15th International Conference on Advanced Computing and Communications 2007, pp 60-65.
[10]. A. Abdurazik, and J. Offutt, Using UML Collaboration diagrams for static checking and test generation, in: Proceedings of the Third International Conference on the UML, Lecture Notes in Computer Science, Springer-Verlag GmbH, York, UK, vol. 939, 2000, pp. 383–395.
[11]. M. Lettrari M. and J. Klose, Scenario-Based Monitoring and Testing of Real Time UML Models, in the Proceedings of UML 2001, Springer Verlag, pp. 312-328.
[12]. F. Basanieri, A. Bertolino, and E. Marchetti, The cow suit approach to planning and deriving test suites in UML projects, in Proceedings of the 5th International Conference on the UML, LNCS, 2460, 2002, pp. 383– 397.
[13]. P. Tonella, and Potrich, A. Reverse Engineering of the Interaction Diagrams from C++ Code, in the Proceedings of IEEE International Conference on Software Maintenance (2003) 159–168.
[14]. A. Bertolino, and F. Basanieri, A practical approach to UML-based derivation of integration tests, in Proceedings of the Fourth International Software Quality Week Europe, Brussels, Belgium, 2000.
[15]. F. Fraikin, and T. Leonhardt, SEDITEC-testing based on sequence diagrams, in Proceedings 17th IEEE International Conference on ASE, 2002, pp. 261–266.
[16]. T.J. Ostrand, and M.J. Balcer, The category-partition method for specifying and generating functional tests, Communications of the ACM 31 (6) (1998).
[17]