A Taxonomical Review on MANET Networks for IoT based
Air Pollution Controls
1
B.KameswaraRao,
2Dr. A. S. N. Chakravarthy
1Dept. of Computer Science and Engineering, JNTUK, Kakinada, AP, India 2JNTUK University College of Engineering, Vizianagaram, AP, India
Abstract
Continuous up gradation nature of the infrastructure and modernization of methods in the air pollution control space demands continues enhancements in the framework architecture and management of Internet of Things.A number of research attempts are made in order to standardize the framework for the MANETs using IoT for air pollution controls by various
researchers. Nevertheless, the fissure between the solutions for
technical issues like bandwidth, energy conservation, time and architectural complexities and the demand for the up gradation is never a match. The additional components such as practical implementation complexity and cluster based management complexities including lack of MANET data collection standards make the further development into a bottleneck of improvements.
Specifically, the demand of the modern infrastructure management
for MANET using IoT is posing a strong demand on timely data analysis and delivery, thus focusing on the need for a highly time
efficient architecture to the current research improvements. Thus,
this work analyses the current state of the modern research and considers the empirical analysis of the existing models. In the due course of the analysis, this work proposes a novel theoretical framework and compares the results with the existing methods. The major outcome of the work is to build the foundation for the further research and provide a standard framework for IoT based MANET development for Air pollution control.
Keywords
MANET, WSN, Point to Point Communication, IoT, Air Pollution, TEEN, SEP, EAMMH
I. Introduction
The pollutants in the air are the components which can have adversarial effects on the ecosystem and the on the living beings. The pollutants in the air can be in the form of liquid drops mixed with other substances, particles or the other gas elements evaporated from various sources. The pollutants, based on the
effects on the environment, are classified into two categories as
primary and secondary [1]. The primary pollutants are generated from a human made processes like carbon monoxide from combustion or the sulphur dioxide from the chemical processes. The secondary pollutants are made out of the interactions between primary pollutants and the natural air substances like ground level ozone.
A number of pollutants are being released into the air as an outcome of human process in the form primary pollutants.
Firstly, the Carbon Dioxide is the pollutant ranked highest by various researchers as the leading pollutant in the environment [2].
The work by Vaidyanathanet. al [3] provides significant proofs as
the Carbon Dioxide is the worst climate pollutant. Nevertheless the work by Johnsonet. al. [4] demonstrates that the overly concentration of Carbon Dioxide in the air can be highly harmful
for the ecosystem. Thus deciding the limit for the CO2 is the major challenge in the modern ecology. The work by Barbalace et al. [5]
has demonstrated the measures of controlling CO2 emission in the
air thus restricting CO2 in becoming the pollutant. Many significant
studies have demonstrated the increasing concentrations of the
CO2 in the environments from 280 PPM at the pre-industrial era to
405 PPM at today [6]. The recent researchers have demonstrated that the majority of the CO2 emission happens due to the processes where the natural fossil fuels are being used [7-8].
Secondly, the Sulphur Oxide is yet another cause of air pollution. The recent reports published by World Health Organization mentioned 7 million deaths [9] due to air pollution and SO being one of the major pollutions in the air.
Thirdly, the Nitrogen Oxide, Carbon Monoxide and Volatile Organic Compounds are also causing high pollutions in the air and further degrading the environment.
Fourthly, the small particles mixed with the moist, free radicals, toxic metals are proven to the major cause for pulmonary cardiovascular diseases.
Various countries and researchers from various organizations
are trying to find measures to control the air pollutions. The results are significant. Nevertheless, various research attempts
by researchers [10], specially the work by AruniBhatnagaret. al. [11] has demonstrated the growing risk by air pollution on the human and on the earth’s ecosystem.
In the course of the survey, this work identifies the highly air
polluted but popular cities in the world (Table 1) [12].
Table 1: World’s Popular Cities with High Air Pollution Factors
Name of the City Particle Matters, Microgram per Cubic Metter
Cairo (Egypt) 168
Delhi (India) 150
Kolkata (India) 128
Tianjin (China) 125
Chongqing (China) 123
Kanpur (India) 109
Lucknow (India) 109
Jakarta (Indonesia) 104
Shenyang (China) 101
A number of research attempts are been carried out using Internet
of Things or specifically, using the MANETs to detect the air
pollution in the air. Nonetheless, the structural complexities of the system and the growing nature of the pollutant types are the bottleneck of the improvements.
This work realizes the existing improvements of air pollution
detection methods using MANET using IoT and defines the
limits of the architecture. Further, the work proposes a novel architecture. To support the proposed improvements, the accuracy of data accumulation and speed for data accumulation is also demonstrated in the work.
The rest of the paper is furnished such as in the Section – II the current improvements are been analysed, the Section – III formulates the guidelines for MANET development focusing air pollution monitoring, considering the limitations and the proposed guideline in Section – IV the framework is been furnished, in the Section – V the simulation results are been discussed and the work presents the conclusion in the Section – VI.
I. Review of Current State of ART
Recent enhancements in the space of mobile communication
using MANET and IoT define endless opportunities for social
use. Mobile Adhoc Network are widely popular due to the nature of inexpensive automated collection of devices and collaborative
framework with IoT and sensors. The MANETs are popular due
to the flexibility of attaching to the existing framework. The
collaborated and connected network can be used further to interlink services for various purposes and enable sending, receiving and analysing data.
The smart cities building on the technology base are using MANET with IoT for solving various problems [13]. This wide adaptation
is due to the functional benefits of MANET as self-configuration and high sustainability. The benefits of the using MANETs for
public safety and environment monitoring is fastest growing and
the benefits are visible [14]. The notable work by S. Leeet. al.
[15] taken a case study of the highly populated area in Korea and
demonstrated the benefits. The novelty of the methods proposed there is basically using the functional benefits of the system.
The recent advancements in the space of mobile devices, especially the mobile phones are primarily build with the wireless communication interfaces as IEEE 802.11 interface, Bluetooth interfaces and 4G LTE interfaces. These integrations develop the low power connectivity solutions for hosting various services [16].
This work analyses the availabilities of the significantly less
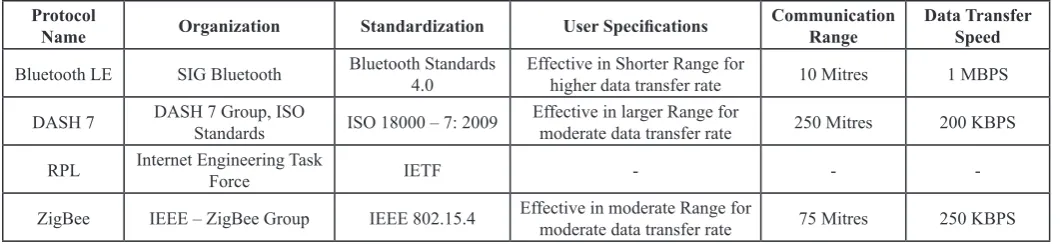
power consuming protocols for integration with the proposed Air pollution monitoring framework (Table 2).
Table 2: Low Power Consuming Protocols for Air Pollution Monitoring System
Protocol
Name Organization Standardization User Specifications Communication Range Data Transfer Speed
Bluetooth LE SIG Bluetooth Bluetooth Standards 4.0 Effective in Shorter Range for higher data transfer rate 10 Mitres 1 MBPS
DASH 7 DASH 7 Group, ISO Standards ISO 18000 – 7: 2009 Effective in larger Range for moderate data transfer rate 250 Mitres 200 KBPS
RPL Internet Engineering Task Force IETF - -
-ZigBee IEEE – ZigBee Group IEEE 802.15.4 Effective in moderate Range for moderate data transfer rate 75 Mitres 250 KBPS
This analysis will certainly help in building the guidelines for MANET using IoT frameworks to be deployed for air pollution monitoring framework.
In the next section using this information, the standardization is demonstrated.
III. Guidelines for MANET Development
In order to make the MANET solutions fully workable with IoT based solutions, the need for standardization cannot be ignored. Specifically the middleware technology standards must be correct in order to support the standards of these communication protocols.
This work analyses the available standards for the communication protocols for integration and further enhancements in the space of Bluetooth, RFID, RPL and ZigBee [17-20].
Firstly, the Personal Area Network compatible specification is the Bluetooth LE. The major benefits for a Bluetooth communication
protocol are to build the short range networks where the data transfer
rate is expected to be high. Special transmission need, where the data transfer is not continuous rather a regular bursts of data steam
is expected. Yet another benefit of the Bluetooth / Bluetooth LE is the devices can be fixed in small sized components.
Secondly, for a much higher range of communication the DASH 7 is a popular choice for building the IoT based networks. The non-dominant factor for the DASH is extremely low data transfer rates. However the durability of the network due to the very high power awareness of DASH is the main reason for DASH implementation popularities.
Thirdly, ZigBee represents a compromise between multiple technologies, reasonable for several application domains, with moderate range and moderate data rate. ZigBee offers symmetric upstream and downstream bandwidths, making it a good choice for Machine-to-Machine communication and for any scenario that requires both data uploading and collection.
Fourth and finally, the RPL is leading the technology space for
routing techniques for data collection optimization, nevertheless it also supports point-to-point communication, having the advantage
of being able to integrate seamlessly. Also the memory consumption for the RPL based protocols is significantly low.
Further, this work builds the application building guidelines for these protocol based IoT enabled air pollution monitoring systems (Table 3).
Table 3: Protocol to Programming Support – Standardization
Protocol
Name Standardization Protocol Application Standardization(Expected) Programming Support
Bluetooth LE Bluetooth Standards 4.0 • • Repeater applications for small areas with fewer nodes. No parallelism approach C, C++, Objective C, Swift, MATLAB
DASH 7 ISO 18000 – 7: 2009 • • Repeater applications for larger areas. Multi point hops for multi node architecture. Java, Python
RPL IETF • • Repeater applications for medium range areas.Continuous data transmission Java, Python, MATLAB
ZigBee IEEE 802.15.4 • • Seamless communication for repeating data transmissions Point to Point Communication C, Java, Python, Swift, Java Script
Thus, this proposed standardization will significantly help in
buildingIoT ready applications.
In the next section of this work, the proposed cluster based IoT enabled architecture is proposed.
IV. Proposed Framework
Firstly to propose the cluster based IoT enabled architecture, the basic MANET architecture is bought into the focus (Fig. 1).
The nodes in a MANET can be classified by their capabilities.
A Client or Small Mobile Host (SMH) is a node with reduced processing, storage, communication, and power resources. A Server or Large Mobile Host (LMH) is a node having a larger share of resources. Servers, due to their larger capacity contain the complete DBMS and bear the primary responsibility for data broadcast and satisfying client queries. Clients typically have
sufficient resources to cache portions of the database as well as
storing some DBMS query and processing modules.
Fig. 1 Traditional MANET Architecture
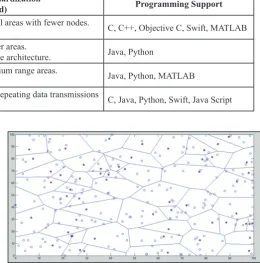
Henceforth, the proposed model for IoT enabled MANET is explained here (Fig. 2) (Fig. 3) (Fig. 4).
Fig. 2: Simulated MANET During Initialization
In this architecture, each node has an area of influence. This is the
area over which its transmissions can be heard. As the power level
decreases, the area of influence of any node will shrink because
the power available to broadcast is reduced. Network nodes may operate in any of three modes that are designed to facilitate the reduction in power used.
Fig. 3. Simulated MANET During RELAY
This approach partitions the whole network into sub-networks. Each of the sub-network themselves then dynamically elects a node among themselves which acts as gateway to the other sub-network. This builds a hierarchy among the nodes and the hierarchy can be one-tire or multiple tier one.
Fig. 4: Simulated MANET In Low Energy Mode
Further, in the next section of this work, the data transfer rate is been analysed for various popular algorithms.
V. Model Simulation Results and Discussions
The proposed architecture is simulated with popular routing algorithms to analyse the performance. The simulation model
is built with 100 nodes and classified into various random
clusters.
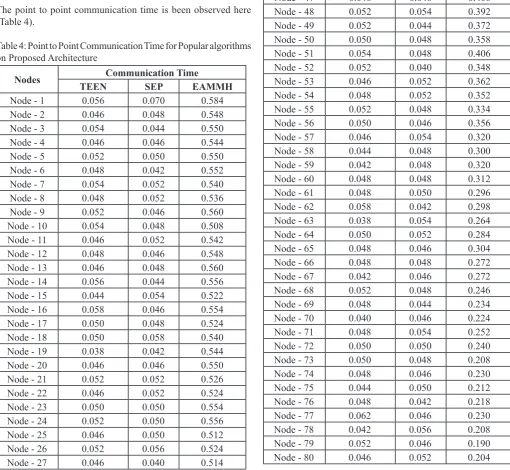
The point to point communication time is been observed here (Table 4).
Table 4: Point to Point Communication Time for Popular algorithms on Proposed Architecture
Nodes TEENCommunication Time SEP EAMMH
Node - 1 0.056 0.070 0.584
Node - 2 0.046 0.048 0.548
Node - 3 0.054 0.044 0.550
Node - 4 0.046 0.046 0.544
Node - 5 0.052 0.050 0.550
Node - 6 0.048 0.042 0.552
Node - 7 0.054 0.052 0.540
Node - 8 0.048 0.052 0.536
Node - 9 0.052 0.046 0.560
Node - 10 0.054 0.048 0.508
Node - 11 0.046 0.052 0.542
Node - 12 0.048 0.046 0.548
Node - 13 0.046 0.048 0.560
Node - 14 0.056 0.044 0.556
Node - 15 0.044 0.054 0.522
Node - 16 0.058 0.046 0.554
Node - 17 0.050 0.048 0.524
Node - 18 0.050 0.058 0.540
Node - 19 0.038 0.042 0.544
Node - 20 0.046 0.046 0.550
Node - 21 0.052 0.052 0.526
Node - 22 0.046 0.052 0.524
Node - 23 0.050 0.050 0.554
Node - 24 0.052 0.050 0.556
Node - 25 0.046 0.050 0.512
Node - 26 0.052 0.056 0.524
Node - 27 0.046 0.040 0.514
Node - 28 0.044 0.046 0.518
Node - 29 0.056 0.044 0.514
Node - 30 0.038 0.050 0.498
Node - 31 0.036 0.050 0.514
Node - 32 0.048 0.052 0.492
Node - 33 0.042 0.052 0.468
Node - 34 0.050 0.048 0.478
Node - 35 0.066 0.046 0.482
Node - 36 0.044 0.050 0.464
Node - 37 0.052 0.044 0.458
Node - 38 0.052 0.048 0.442
Node - 39 0.040 0.050 0.452
Node - 40 0.050 0.046 0.416
Node - 41 0.042 0.052 0.434
Node - 42 0.054 0.052 0.398
Node - 43 0.050 0.048 0.396
Node - 44 0.052 0.042 0.382
Node - 45 0.050 0.052 0.398
Node - 46 0.046 0.042 0.392
Node - 47 0.046 0.046 0.406
Node - 48 0.052 0.054 0.392
Node - 49 0.052 0.044 0.372
Node - 50 0.050 0.048 0.358
Node - 51 0.054 0.048 0.406
Node - 52 0.052 0.040 0.348
Node - 53 0.046 0.052 0.362
Node - 54 0.048 0.052 0.352
Node - 55 0.052 0.048 0.334
Node - 56 0.050 0.046 0.356
Node - 57 0.046 0.054 0.320
Node - 58 0.044 0.048 0.300
Node - 59 0.042 0.048 0.320
Node - 60 0.048 0.048 0.312
Node - 61 0.048 0.050 0.296
Node - 62 0.058 0.042 0.298
Node - 63 0.038 0.054 0.264
Node - 64 0.050 0.052 0.284
Node - 65 0.048 0.046 0.304
Node - 66 0.048 0.048 0.272
Node - 67 0.042 0.046 0.272
Node - 68 0.052 0.048 0.246
Node - 69 0.048 0.044 0.234
Node - 70 0.040 0.046 0.224
Node - 71 0.048 0.054 0.252
Node - 72 0.050 0.050 0.240
Node - 73 0.050 0.048 0.208
Node - 74 0.048 0.046 0.230
Node - 75 0.044 0.050 0.212
Node - 76 0.048 0.042 0.218
Node - 77 0.062 0.046 0.230
Node - 78 0.042 0.056 0.208
Node - 79 0.052 0.046 0.190
Node - 81 0.050 0.046 0.202
Node - 82 0.050 0.058 0.198
Node - 83 0.048 0.042 0.186
Node - 84 0.050 0.054 0.188
Node - 85 0.050 0.052 0.168
Node - 86 0.042 0.052 0.166
Node - 87 0.060 0.052 0.188
Node - 88 0.052 0.052 0.148
Node - 89 0.046 0.056 0.160
Node - 90 0.048 0.050 0.150
Node - 91 0.040 0.056 0.142
Node - 92 0.056 0.048 0.162
Node - 93 0.054 0.054 0.148
Node - 94 0.046 0.050 0.152
Node - 95 0.038 0.046 0.150
Node - 96 0.044 0.044 0.140
Node - 97 0.046 0.058 0.130
Node - 98 0.042 0.044 0.140
Node - 99 0.048 0.048 0.112
Node - 100 0.052 0.056 0.126
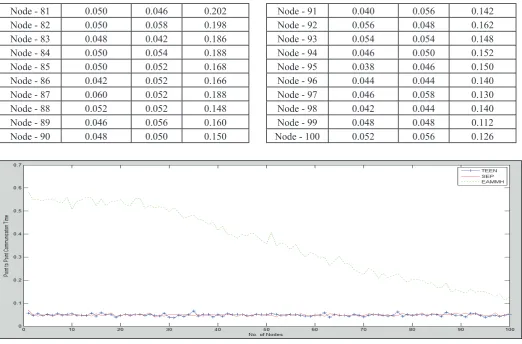
Fig. 5: Point to Point Time Communication Time
Further, the average time taken to communicate between nodes are been analysed here (Table 5).
Table 5: Average Point to Point Communication Time
Communication Time (Avg.)
Number of Nodes TEEN SEP EAMMH
Node – 1 to 10 0.056 0.070 0.584
Node –1 to 20 0.046 0.048 0.548
Node –1 to 30 0.054 0.044 0.550
Node –1 to 50 0.046 0.046 0.544
Node –1 to 80 0.052 0.050 0.550
Node –1 to 90 0.048 0.042 0.552
Node –1 to 100 0.054 0.052 0.540
VI. Conclusion
The uses of MANET with IoT for air pollution monitoring systems in the modern cities are the growing demand for the research. The trade-off between the higher availability and the higher complexity of the proposed architectures is the major bottleneck for the enhancements. The lack in architectural improvements can be the primary reason for slow implementations of smarter cities in India. Thus this work analyses and proposes a cluster based MANET framework compatible with various IoT enabled devices. The proposed framework is been tested with various MANET routing algorithms and the results are been satisfactory. The produces consistent communication bandwidth on the proposed architecture is been proven for the algorithms such as TEEN, SEP and EAMMH. The major outcome of this work results into a cluster based architecture for MANET and IoT enabled devices for air pollution monitoring systems in order to save the precious environment of the earth.
References
[1] "Air pollution". World Health Organization, 2016.
[2] "Air Pollution Causes, Effects, and Solutions". National Geographic, 2016.
[3] Vaidyanathan, ClimateWire, Gayathri,"The Worst Climate
Pollution is Carbon Dioxide". Scientific American.
[4] Johnson, Keith,"How Carbon Dioxide Became a 'Pollutant?". Wall Street Journal, 2009.
[5] Barbalace, Roberta C. (2006),"CO2 Pollution and Global
Warming: When does carbon dioxide become a pollutant",
[Online] Available: http://www.environmentalchemistry.
com
[6] The relentless rise of carbon dioxide". Climate Change: Vital Signs of the Planet. NASA.
[7] "How much of U.S. carbon dioxide emissions are associated with electricity generation?", 2016.
[8] "Full Mauna Loa CO2 record". Earth System Research Laboratory, 2017.
[9] "7 million premature deaths annually linked to air pollution". WHO, 2014.
[10] "Evidence growing of air pollution's link to heart disease,
death". Archived from the original on 2010. Retrieved 2010//
American Heart Association, 2010
[11] Pope, CA; AruniBhatnagar; James P. McCracken; Wesley T. Abplanalp; Daniel J. Conklin; Timothy E. O'Toole,"Exposure to Fine Particulate Air Pollution Is Associated with Endothelial
Injury and Systemic Inflammation". Circulation Research.
119: 1204–1214. PMID 27780829, 2016. [12] "World Bank Statistics" (PDF). 2010.
[13] G. Yovanof, G. Hazapis,“An architectural framework and enabling wireless technologies for digital cities and intelligent urban environments,” Wireless Pers. Commun., Vol. 49, No. 3, pp. 445–463, 2009.
[14] WSN for Smart Cities: A Market Study, San Diego, CA, USA, 2007.
[15] S. Lee, H. Han, Y. Leem, T. Yigitcanlar,“Towards ubiquitous city: Concepts, planning and experiences in the Republic of Korea,” In Knowledge-Based Urban Development: Planning and Applications in the Information Era, T. Yigitcanlar, K. Velibeyoglu, and S. Baum, Eds. Hershey, PA, USA: Information Science Reference, pp. 148–170, 2008. [16] Short Range Wireless ICs: Bluetooth, NFC, UWB, 802.15.4
and Wi-Fi Market Forecasts, ABI Research, New York, NY, USA, 2010.
[17] Bluetooth Core Specifications v. 4.0, Bluetooth SIG, Kirkland,
WA, USA, 2010.
[18] ISO/IEC 18000-7:2009: Information Technology—Radio Frequency Identification for Item Management, International
Organization for Standardization, Geneva, Switzerland, 2009.
[19] T. Winter, P. Thubert, A. Brandt, T. Clausen, J. Hui, R. Kelsey, P. Levis, K. Pister, R. Struik, J. P. Vasseur (2011). RPL: IPv6 Routing Protocol for Low Power and Lossy Networks
[Online] Available:
http://tools.ietf.org/html/draft-ietf-roll-rpl-19
[20] ZigBee Specification, ZigBee Alliance, San Ramon, CA,
USA, 2005.
B.KameswaraRao, Research scholar from JNTUK, Kakinada from the department of computer science and engineering. He is working as faculty member in department of computer science and Engineering from VizagInstitue of Technology, India. He is a member of ISTE. He published papers in various National
/International journals. His areas of
interest Web Technology Applications, Wireless Sensor Networks, computer Networks, Spatial Databases, Computer Applications in Geo Science.
Dr. A. S .N. Chakravarthy, Currently is working as Professor in Dept. of Computer Science and Engineering in JNTUK UCEV. He received Ph.D. in Computer Science & Engineering from Acharya Nagarjuna University, Guntur, India in 2011. He is having 14 years of teaching experiance .He has
published papers in various National /